Sudi Ariyanto, Measurement of Radioactivity in Dust in the Air ...
Measurement
of Radioactivity
in Dust in the Air using Gamma-ray
Spectroscopic
Analysis
Sudi Ariyanto ,Ko Noguchi
Date: August 23-24,2001, Place:NuTEC,lAERI Abstrak
Pengukuran Radioaktif di udara dilakukan dengan menggunakan spektrometri gamma. Kertas penyaring He-40T ditata pada kolektor udara setinggi 0.5-1.5 meter dari tanah. Pengumpulan udara dilakukan selama 1.5 jam dan kecepatan alir rata-rata udara yang melalui penyaring diukur. Penyaring kemudian di letakkan 3 em dari detektor HPGe . Pengukuran radioaktifpada kertas saring menggunakan sistem MCA. Pengukuran dilakukan selama 3000 detik. Data eksperimen menunjukkan bahwa konsentrasi radioaktif Pb-212 di udara pad a rentang 6.11 e-8-17.2 e-8Bq/cm3
.
Abstract
Experiment on measurement of radioactivity in the air using gamma spectrometry has been done. He-40T filter paper was set-up on the air collector (stapler) at 0.5-1.5 meters from the ground. Duration of air collection was set for 1.5 hours and flow rate of the air passing through the filter was measured. The filter, then, was put at 3 ern from a HPGe detector. Measurement of radioactive in the filter used a MCA system. The system was set at 3000 seconds for the counting time. Data obtained from the experiment have shown that radioactive concentration ofPb-212 in the air was in the range of 6.11 e·g -17.2 e-gBq/crrr'. Introduction
Generally it is known that there are two main radiation according to its occurrence: man-made radiation and natural radiation. Due to the existence of natural radiation, people are always exposed by radiation. For radiation workers, the existence of natural radiation gives addition radiation doses besides of the dose from hand-made radiation. In nuclear facility, the working environment, especially air, is regularly monitored.
The purpose of air contamination monitoring in working environment is to confirm that the works are executed under an adequate condition in term of radiation safety, to prevent workers skin contamination and internal exposure by detecting unexpected air also estimating the contamination. In addition, the purpose includes to estimate maximum radioactivity inhaled into body due to the monitoring results, and to obtain information for planning on internal exposure monitoring and the protection.
The origin of radioisotopes in the air is due to the presence of long-lived nuclides uranium and thorium under the ground and also from cosmic radiation. The decays of uranium produces successive decays that forms uranium series. Thorium decay also produces thorium decay series.
Successive Radioactive Decay Consider there is a successive decay of radionuclides as follows:
NI~N2~NJ
dNl =-AN
dt I I
dN2
=
1N -A N dt "1122N
=
N _~_( -AjI_ -l2t)2 10 e e
A2 -AI
N 3
=
N 10 J.... 1J.... 2( ().,
-
).<, -)~~ ,
). , ))
+( (
,
t, -
,
te, -)~~,
,
t, ))
+( (,t, -
,
t:;~~,-
,
t
.
J
If the radioactive achieve equlibrium between the nuclides and its short half-live daughter in
the air, then radioactivity of the daughter
nuclides is constant and it can be expresses by
The number of daugther atoms at time t after
sampling can be calculated by the following
relationship:
1sl daughter nuclide: N10eOAI"
2nd
daughter nuclide: N20 e-u1+ N2,
3rd daughter nuclide: N30e-u1+ N3+ N3,
If the dust collecting time is longer than 3
times of the half-life of the nuclide, the
radioactivity of these nuclides become
constant and the concentration in the air can
be expressed as follows:
2
Widyanuklida Vo1.5No,l, Juli 2004: 1-5
C Q693
.-
1
· 1
'
1
1
~
s T 17n
n
60
t
Q
69
~}
S
1'2
F
1().
_
.
-
'
1f2100100
1
-
e
where:
F : true average flow rate of air (l/min)
T112 : half life of the activity (min)
Tc : collection time (min)
T' :lapsed time after the sampling
TIm:counting efficiency (%)
TIc : collection efficiency of filter paper
(%)
Sf : total collection area of filter paper
(crrr')
S : Collection area of filter paper
measured (em')
Ao can be calculated by taking into account
correction of counting time,
A=
An
o
(1-
e
-~c ).Ie . IE
A:radioactivity at the beginning of
counting
f... :decay constant of the nuclide
no:counts at intended peak
f. :counting efficiency for energy of
gamma - ray
fE :emission rate per decay
tc:counting time.
Experiment
Procedure of energy calibration
1. Open the cover of sample chamber and
put a composite sample (Ba-133,
Co-60, Cs-137), close the cover
2. Set counting time of MCA to be 300
sec and start counting
3. Start up gamma spectrometry software
to get the data from the MCA
4. Store the result in the computer
Procedure of counting efficiency energy
Sudi Ariyanto, Measurement of Radioactivity in Dust in the Air ...
1. Open the cover of sample chamber and put Eu-152, close the cover
2. Set counting time of MCA to be 300 sec and start counting
3. Start up gamma spectrometry software to get the data from the MCA and then let it calculating calibration equation
4. Store the result in the computer Procedure of dust sampling
1. On the surface of the HE-40T filter paper draw a circle of 50mm in diameter. Set the filter on the air collector (Stapler)
2. Set the Stapler at the measuring point of 0.5 to 1.5m high from the floor, and switch the power on. Record the time of power on and the indicated flow rate of air.
3. After 1.5 hours operation of the Stapler,
read and record the flow rate again. Switch the power off and record the time.
4. Remove the filter paper out and cut the circle off,and set it in stainless steel dish.
Procedure of sample counting (0
I. Open the cover of sample chamber and put the sample at a distance of 3 cm from the detector
2. Set counting time of MCA to 3000 sec and start counting
3. Start up gamma spectrometry software to get the data from the MCA
4. Print the result
Procedure of sample counting (10
1. Open the cover of sample chamber and put the sample at a distance of 3 cm from the detector
2. Set counting time ofMCA to 180 sec and start counting
3. Start up gamma spectrometry software to get the data from the MCA
4. Print the result
5. Plot the data of each element on a graph paper and predict the number of element at the end of counting
6. Calculate concentration
Result
Counting Efficiency
Figure 1 shows data obtained for measuring the detector efficiency. From this figure it is found that the counting efficiency as a function of energy can be expressed by below relationship:
TIc= 3.6393 E·O.8438
Table below shows the experiment condition for the 1SI (left) and 2nd (rigth)
measurement.
Location Gamma counting room #I
bate 23 August,2001
[rime b9:47-11:17
~ollecting time ~Omin
Pump speed 625 liter/min
Start of counting 11:35
irounting time ~OOOs
!,--ocation ~amma counting room #I lOate ~3 August,200 I
trime b9:46 - 11:16
~ollecting time 90 min
Pump speed 600 liter/min
Start of counting 12:14
bounting time 3000 s
The result of 1st measurement can be seen
in Table .. while for 2nd measurement in Table
a
Element Energy, keY counts
IPb-212 ~38.66 145 + II
IPb-214 1351.94 1500+ 28
lBi-214 1609.37 1706 ± 29
Element Acs, Bq C, Bq/crrr'
Pb-212 ~.21±0.12 6.11 E-08 ± 2.22E-OQ
Pb-214 ~3.51± 1.78 ~.45E-06 ± l.30E-07
Bi-214 ~4.62 + 3.58 1.56E-06 ± 1.2 5 E -0 1
b
Element Energy,keY counts IPb-212 1238.66 [84 ± 12
IPb-214 1351.94 1612±32
!Bi-214 1609.37 895+34
Element Acs, Bq C,BQ/cmJ
Pb-212 8.51±0.31 1.72E-07 ± 6.22E-09 Pb-214 41.02 ±2.p 4.72E-06+2.55E-07 Bi-214 56.56 ± 4.55 2.48E-06+1.99E-07
The total concentration of these three elements in the lSI measurement is 4.07E-6 Bq/cnr', while for the 2nd measurement is 7.37E-6 Bq/cnr' . Although the samples are taken in the same room, the next day measurement (2nd measurement) results in higher concentration. The concentration becomes higher in the 2nd measurement because two air suction ports in the room are closed from the day before. In the 1st measurement, these two ports are closed just before the sampling is performed.
The experiment results show that the proportion of each element to the total of these three elements seem to be constant. The following table shows the proportion of element obtained in the 1st and 2nd measurement. From the table it is known that the proportion of Pb-212 is 1.92 ± 0.58 %,
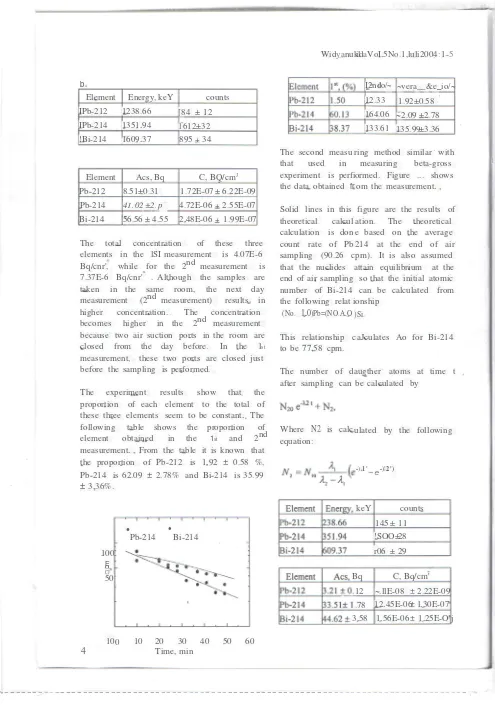
ring method similar with
measuring beta-gross II ormed. Figure ... shows
I om the measurement.
figure are the results of
I
ation. The theoreticale based on the average 214 at the end of air pm). It is also assumed attain equilibrium at the
so that the initial atomic can be calculated from ionship
)Si.
aJculates Ao for Bi-214
augther atoms at time t be calculated by
ulated by the following
-).1' -)'2') the data obtained fr
Solid lines in this theoretical calcul calculation is don count rate of Pb sampling (90.26 c that the nuclides end of air sampling number of Bi-214 the following relat (No. 1.0)Pb=(NO.A.O
This relationship c to be 77.58 cpm.
The number of d after sampling can
Where N2 is calc equation:
Sudi Ariyanto, Measurement of Radioactivity in Dust in the Air ...
C O N C L U SIO N S
Experiment on measurement of radioactivity
in air using gamma spectrometry has been
done and the following are clarified:
I. The radioactivity concentration of
Pb-212 in the gamma counting room #1
is in a range of6.lle-8 - l.72e-7, Pb-214 in a range Of 2.45e-6 - 4.72e-6, and
Bi-214 in a range of 1.56e-6 - 2.48e-6
Bq/cm'.
2. The concentration calculated at the
second day shows a higher value than the first day. The higher value is obtained due to the fact that two air suction ports are closed for about 24 hours before the 2nd measurement is initiated.
The ratio of each element (Pb-212, Pb-214,
Bi-214) to the total of these three element 'seems to be constant: Pb-2l2: 1.92%, Pb-2l4:
62.09%, Bi-214: 33.61%
R E FE R E N C E
1. Knoll, Glen F. Radiation Detection and
Measurement 2nd Edition, John Willey &
Sons, New York (1989)
."