QlikView 11 for Developers
Develop Business Intelligence applications with
QlikView 11
Miguel García
Barry Harmsen
P U B L I S H I N G
professional expertise distilled
QlikView 11 for Developers
Copyright © 2012 Packt Publishing
All rights reserved. No part of this book may be reproduced, stored in a retrieval system, or transmitted in any form or by any means, without the prior written permission of the publisher, except in the case of brief quotations embedded in critical articles or reviews.
Every effort has been made in the preparation of this book to ensure the accuracy of the information presented. However, the information contained in this book is sold without warranty, either express or implied. Neither the authors, nor Packt Publishing, and its dealers and distributors will be held liable for any damages caused or alleged to be caused directly or indirectly by this book.
Packt Publishing has endeavored to provide trademark information about all of the companies and products mentioned in this book by the appropriate use of capitals. However, Packt Publishing cannot guarantee the accuracy of this information.
First published: November 2012
Production Reference: 1161112
Published by Packt Publishing Ltd. Livery Place
35 Livery Street
Birmingham B3 2PB, UK.
ISBN 978-1-84968-606-8
www.packtpub.com
Foreword
At QlikTech we often describe ourselves as "an American company with a Swedish soul". We celebrate our roots in the delightful and urbane university town of Lund in southern Sweden; indeed, the development teams who built QlikView are still mostly based there. We power our business from our headquarters and major offices in Philadelphia, Boston, and San Mateo.
Nevertheless, we have more than a Swedish soul and a US business; in fact the QlikView community of customers, partners, and consultants is truly international. To understand that scope, you need only look at the authors of this excellent new book. Barry Harmsen is well known in the Netherlands as an independent Business Intelligence consultant. He is undoubtedly a star of the QlikTech community. Miguel García, from Mexico, has worked globally consulting on QlikView.
The sheer range of experience that Barry and Miguel bring to this book is one of its most valuable qualities. Their examples are carefully thought out, and very thorough; but they also take time to explain the business background to their thinking.
At QlikTech we often say that QlikView is not so much a tool for Business Intelligence as it is a platform for Business Discovery. This is not just a marketing term: we do not want only something different to say. In fact, every day we see customers making discoveries—finding new information and insights—with QlikView.
A traditional BI report simply tells you what you already know and is packaged and formatted to keep that knowledge up-to-date and share it easily. A typical dashboard enables you to track key indicators and, with some good design, also "drill down" to understand the details or trends underlying those indicators. But Business Discovery does this and more. Business Discovery enables users to formulate new questions and explore the answers and implications with very few restrictions.
As they progress along a thoroughly practical path, the authors introduce you to the mechanics of collecting data from sources. They guide you through numerous techniques for transforming, modeling, and exploring this data. They provide practical advice on best practices for security, visualization, and more complex analyses.
In short, for new developers, this is an excellent guide to get them started. For more experienced users, the thoughtful examples and careful notes make this an excellent companion in your work.
Donald Farmer,
About the Authors
Miguel García
is a Business Intelligence Consultant and QlikView Solutions Architect from Monterrey, Mexico. Having worked throughout many successful QlikView implementations, from inception through implementation, and performed across a wide variety of roles on each project, his experience and skills range from applications development and design, to pre-sales, technical architecture, system administration, as well as functional analysis and overall project execution.He currently holds the QlikView Designer and QlikView Developer Certifications, backed by QlikTech, for versions 9, 10, and 11.
His passion for QlikView led him to create and host the iQlik's blog (http://iqlik. wordpress.com). You can follow his blog updates via Twitter on @iQlik.
He currently works for DataIQ, a QlikView consulting firm with presence in Argentina, Mexico, Uruguay, and Paraguay.
Barry Harmsen
is an independent Business Intelligence Consultant based in the Netherlands. Originally from a background of traditional Business Intelligence, Data Warehousing, and Performance Management, in 2008 he made the shift to QlikView and a more user-centric form of Business Intelligence. Since then he has completed many successful QlikView implementations in many different industries, from Financial Services to Telecoms, and from Manufacturing to Healthcare. He writes a QlikView blog at QlikFix.com.Acknowledgements
Writing a book is not a solo - or duo - exercise. This result could not have been achieved without the contributions of a great team.
We want to thank Donald Farmer for writing the foreword and for helping us acquire permission to use some of QlikTech's materials in this book. Thanks to John Trigg for supporting this project as well.
Ralf Becher, Steve Dark, and Stephen Redmond performed the technical review of this book. Their insightful comments and suggestions have added an extra dimension of quality to the book. For that we thank them.
About the Reviewers
Ralf Becher
was born in 1968. He had his apprenticeship as an Information Technology Officer at the Leipzig Graduate School of Management (HHL) in 1992. He worked as an IT System Architect and as an IT Consultant in the areas of banking, insurance, logistics, automotive, and retail. He co-founded TIQ Solutions in 2004.The Leipzig Company specializes in modern, quality-assured data management; since 2004 it has been helping its customers process, evaluate, and maintain the quality of company data. TIQ Solutions supports its customers from the initial problem analysis on, helping them introduce, implement, and improve complex solutions in the fields of data architecture, data integration, data migration, master data management, meta-data management, data warehousing, and business intelligence.
He is an internationally recognized QlikView expert with a strong position in the community. He has contributed QlikView add-on solutions for data integration, especially in the Java and Big Data realm.
Steve Dark
was a SQL Server / MS ASP developer, building web based reporting solutions for ten years, until he was shown a demo of QlikView. Soon after this revelation, he left his previous employer to set up Quick Intelligence—a consultancy focusing entirely on QlikView and delivering Business Intelligence solutions.Preferring to stay at the coalface, he spends the majority of his time with clients, building QlikView applications, managing servers, and running projects.
He is active on QlikCommunity and other social media sites, where he shares his enthusiasm for QlikView and assists other users. Through his blog he shares tutorials, examples, and insights about QlikView. Read it at http://www.quickintelligence.co.uk/.
I would like to thank Barry and Miguel for writing this book and the publishers for making it possible. I honestly believe it fills a vital gap in the QlikView universe.
Stephen Redmond
is the CTO of CapricornVentis Limited (http://www. capventis.com), a QlikView elite partner. He is the author of several books, including the very popular DevLogix series for SalesLogix developers.After many years working with CRM systems, reporting and analysis solutions, and data integration, in 2006 he started working with QlikView. Since then,
CapricornVentis have become QlikView's top partner in the UK and Ireland territory and, with Stephen as the head of the team, have implemented QlikView in a wide variety of enterprise and large business customers across a wide range of sectors from public sector to financial services to large retailers.
www.PacktPub.com
Support files, eBooks, discount offers and more
You might want to visit www.PacktPub.com for support files and downloads related to
your book.
Did you know that Packt offers eBook versions of every book published, with PDF and ePub
files available? You can upgrade to the eBook version at www.PacktPub.com and as a print book customer, you are entitled to a discount on the eBook copy. Get in touch with us at
[email protected] for more details.
At www.PacktPub.com, you can also read a collection of free technical articles, sign up for a range of free newsletters and receive exclusive discounts and offers on Packt books and eBooks.
TM
http://PacktLib.PacktPub.com
Do you need instant solutions to your IT questions? PacktLib is Packt's online digital book library.
Here, you can access, read and search across Packt's entire library of books.
Why Subscribe?
• Fully searchable across every book published by Packt
• Copy and paste, print and bookmark content
• On demand and accessible via web browser
Free Access for Packt account holders
If you have an account with Packt at www.PacktPub.com, you can use this to access PacktLib today and view nine entirely free books. Simply use your login credentials for immediate access.
Instant Updates on New Packt Books
Dedicated to our families.
Miguel García
Table of Contents
Preface
1
Chapter 1: Meet QlikView
7
What is QlikView? 8
How does QlikView differ from traditional BI? 8
Associative user experience 9
Technology 11
Adoption path 11
Exploring data with QlikView 13
Getting QlikView 13
Navigating the document 14
Slicing and dicing your data 15
List-boxes 15
Selections in charts 16
Search 16
Bookmarking selections 17
Undoing selections 19
Changing the view 19
Cyclic Groups 19
Drill down Groups 19
Containers 20
But wait, there's more! 21
The technology and components behind QlikView 22
The way the data flows 23
When QlikView use expands 24
Create content 25
Reload, publish, and distribute content 25
Consume content 26
Meet HighCloud Airlines 27
Table of Contents
Chapter 2: Seeing is Believing
29
What is a SiB? 30
Preparing the workspace 30
Setting up the folder structure 30 Creating the QlikView document 31
Creating the app 32
The requirements 32
Constructing the data model 33
What is a data model? 33
Loading the fact table 33
Playing with listboxes 36
Associating additional tables 40
Creating the dashboard tab 43
Creating and positioning the filters and user controls 43
Number of flights over time 46
One chart and multiple analyses with cyclic expressions 50
Adding a time drill-down group 52
Top 10 routes 54
Summary 57
Chapter 3: Data Sources
59
Using ODBC and OLE DB drivers 60
Installing the drivers 60
Accessing custom data sources 61
Third-party custom connectors 62
Reading table files 63
Extracting data—two hands-on examples 63
Extracting data from MS Access 64
Configuring the driver 64
Creating the OLE DB connection string 66
Querying the database 69
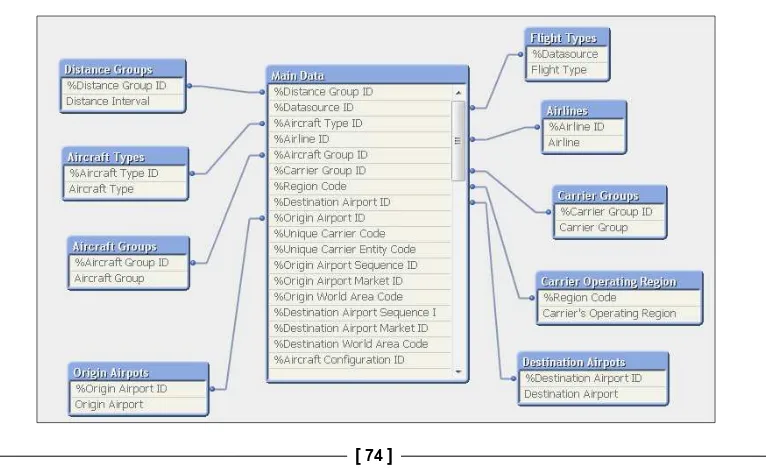
Reloading the script 73
The resulting data model 74
Loading a table file 75
Specifying the file attributes 76
The transformation step 79
Refining the input table 80
The resulting script 82
QVD and QVX files 84
QVD files 84
QVX files 84
Loading an Inline table 85
Table of Contents
[ iii ]
Chapter 4: Data Modeling
87
Dimensional data modeling 88
Back in the day 88
Relational databases and ER modeling 88
Dimensional modeling 90
The star schema 90
The snowflake schema 91
Creating the dimensional model 92
Dimensional models in QlikView 93
The associative data model 94
Guidelines for table associations 95
How associations are created 96
Avoiding data model conflicts 98
The Table Viewer window 104
Table information 105
Field information 105
Table preview 106
Table viewer menu 106
Summary 108
Chapter 5: Styling Up
109
Design requirements 110
The Document Properties window 112
The Sheet Properties dialog 115
Setting the object properties 117
Caption colors and style 117
Changing the caption colors 117
Setting the caption font 120
Setting the content font 121
Setting the global font 121
Propagating the object appearance 122 Setting the default Sheet Object Style 123
Hiding captions 123
Working with listboxes 124
Adding listboxes 124
The List Box Properties dialog 125
Table of Contents
The Multi Box 130
The Current Selections Box 131
Making selections from the Current Selections Box 132
Adding a Bookmark Object 132
Aligning and resizing sheet objects 133
Selecting objects 133
Moving objects 133
Resizing objects 134
Resizing a Multi Box 134
Aligning sheet objects 135
Do a little house keeping 135
Creating and applying a default color map 136
Defining chart colors 136
Setting the default color map 137
Summary 138
Chapter 6: Building Dashboards
139
User types 139
Dashboard users 140
Analysts 141
Report users 142
Applying the DAR principle to Airline Operations 142
Document requirements 143
Creating the Analysis sheet 144
Adding a new chart 145
Bar Chart 147
Additional bar chart properties 149
Expressions and the Edit Expression window 150
Expressions 150
The Edit Expression window 150
The Expression Overview window 153
Line Chart 154
Additional line chart properties 156
Combo Chart 157
Container 159
Scatter Chart 161
Button 163
Statistics box 164
Creating the new Dashboard sheet 166
Linked Objects 167
Gauges 170
Cloning the object for re-use 175
Table of Contents
[ v ]
More Gauge styles 177
Adding a Text object 177
Using a Text Object to display an image 179
Adding actions to a Text object 181
Adding a Pie chart 182
Dimension Limits 183
Adding the dimension value to the data point values 185
Creating the Reports sheet 187
Variables 187
The Expression Overview window in action 189
Copying sheets 191
KPIs per airline, origin, and destination country 192
Cyclic and Drill-down groups 192
Straight table 194
Not all expressions are numbers 196
Pivot tables 198
Auto minimize 200
The Report Editor window 201
Other charts 205
Building the aircraft dimension table 217
Loading the aircraft information 217
Adding the aircraft groups 219
Loading the second aircraft table 221
Making it all right 223
Table of Contents
Storing tables 237
Renaming tables and fields 237
Deleting tables and fields 238
Setting variables 238
Controlling script flow 239
Conditional functions 241
Dealing with different data types 242
Strings 242
String operators 242
String functions 242
Numbers and numeric functions 245
Date and time functions 246
Debugging script 247
Syntax check 248
Saving logs to disk 248
The script debugger 249
Using breakpoints 250
Limited load 250
Tracing script 251
Standardizing and organizing script 252
Using tabs 252
Comments 253
Adding an information tab 254
Script layout 256
Managing file locations and connection strings 261
Summary 263
Chapter 8: Data Modeling Best Practices
265
Data consistency 265
Dealing with dimensions without facts 266
An alternative approach 270
A solo exercise 271
Dealing with facts without dimensions 272
Reducing storage requirements 277
Using number-based key fields 277
Removing unused fields 278
Table of Contents
[ vii ]
Design challenges of data modeling 280
The Airline Employment statistics table 280 Concatenating fact tables 281
Structural asymmetry 281
Natural and forced concatenation 282
Concatenating the Employment Statistics table 284
Working with link tables 286
A link table example 286
Creating a link table in the Airline Operations document 289
Finding a balance 292
The master calendar 293
A final note on data modeling 297
Summary 298
Chapter 9: Basic Data Transformation
299
Changing the source table structure 299
"Cleansing" a dirty table 300
File contents 300
Working with the Transformation Step wizard 301
The final result 311
Other transformation tricks 313
Loading a Crosstable 313
A Crosstable example 313
Working with the Crosstable Wizard 314
A solo exercise 318
Expanding a hierarchy 318
A hierarchy example 319
Working with the Hierarchy Wizard 320
The tree-view list-box 323
Generic load 324
Loading a generic table into QlikView 325
Summary 328
Chapter 10: Advanced Expressions
329
Using variables 329
Creating a variable 330
Using variables in charts 331 Interactively changing a variable's value 333
Using the Input Box object 333
Using the Slider object 334
Using variables based on expressions 335 Using variables to store expressions 337 Variable naming convention 338 The Dollar Sign Expansion syntax 338
Dollar Sign Expansion with parameters 339
Table of Contents
Using the TOTAL qualifier 344
The Aggr function 346
Using Aggr for nested aggregation 346
A word on calculated dimensions 348
Aggregations over the Aggr output 349
A word on using the Distinct qualifier 351
Getting the Average Load Factor per Route per Airline 351
Conditional functions 353
The If function 353
The syntax 353
A use case 354
Numeric versus text comparisons 360
The Class function 360
A solo exercise using the Class function 362
The Pick function 363
Using Pick with Dimensionality 363
A tip on copying expressions 366
Summary 367
Chapter 11: Set Analysis and Point In Time Reporting
369
The magic of Set Analysis 369
What is it for? 370
Syntax and examples 371
Using variables in set expressions 374
Dynamic record sets 374
More assignment operators 375
Set operators 376
Using element functions 377
Point In Time Reporting 378
The challenge 378
Defining the set modifiers 379
Obtaining the base period record set 379
Obtaining the compare-to period record set 380
Constructing the expressions 382 Enabling additional period comparisons 383
More Point In Time Reporting examples 384
Storing set expressions into variables 386
Set expressions with parameters 388
Portable set expressions 390
Set variables and the Master Calendar 392
Comparative analysis with alternate states 393
A comparative analysis example 393 Alternate states step-by-step 394
Table of Contents
[ ix ]
Combining alternate states and the default state 398
Applying alternate states to layout objects 399 Document navigation with alternate states 400
Clearing selections in an alternate state 400
Always validate 400
Summary 401
Chapter 12: Advanced Data Transformation
403
Data architecture 403
Two-stage architecture 404
Three-stage architecture 406 Setting up our environment 407
Loading data already stored in QlikView 408
Cloning a QlikView data model 408
Loading from RAM 410
Resident load 410
Aggregating data 411
Aggregating the Flight Data table 412 The Transformation output 416
Aggregation functions 417
Sorting tables 418
Ordering the Order-By fields 418
The Peek function 419
Dealing with slowly changing dimensions 427
The Carrier Decode table 428
IntervalMatch magic 429
Expanding the intervals 429
Some considerations 432
Applying IntervalMatch to the Carrier Decode table 432
Ordering, peeking, and matching all at once 436
The use case 437
Incremental loads 438
Table of Contents
Chapter 13: More on Visual Design and User Experience
443
Creating a consistent QlikView UI 443
Screen resolution 444
Background image 444
Themes 446
Applying themes 447
Creating themes 448
Additional interactivity 454
Triggers 455
Document triggers 455
Sheet triggers 457
Actions 458
Advanced search expressions 461
A solo exercise 463
Dynamic bookmarks 463
Alerts 463
Conditionally showing and calculating objects 467
Summary 470
Chapter 14: Security
471
Hidden script 471
Section access 473
Section access fields 476
Reduction fields 478
Initial data reduction 480
Omitting fields 481
Document-level security 483
Sheet-level security 485
Summary 486
Preface
The need for Business Intelligence (BI) solutions and data analysis has always existed, and so have different approaches to fulfill this need. Traditional BI software has heavily relied on techniques that have been around and persisted through the decades, but newer technologies have emerged in recent times that have proven to be more flexible and, therefore, more adequate for the evolving environment in which they are used. QlikView is an example of this kind of disruptive technology, a kind of software that changes the rules of the game.
QlikView is different; that's a fact. It's different in an advantageous way. If you have worked with traditional BI software before, it might be necessary to let go of some of the preconceptions you may have regarding how BI solutions are built. If, on the other hand, you are a newcomer to the BI landscape, we will help you get the basics in order for you to get up-to-speed. In any case, rest assured that you are on the right track by having picked QlikView as your tool and this book as your guide.
The good news is the material between these covers has been written in such a way that newcomers, BI professionals experienced in other tools, and even seasoned QlikView practitioners, will find useful. This book will provide you with the knowledge required to understand how QlikView works, and the skills needed to build QlikView documents from start to finish: from loading data to building charts. Even if you have worked with QlikView before, you will find that the exercises presented in each chapter, and the recommended practices we discuss, will help you extend your knowledge and become more proficient with QlikView.
Among other features you will find in this book, some of the most important are: • The book is practical and hands-on. This book is filled with examples that
Preface
• In every chapter, a piece of a final QlikView document is built , which allows you to follow its evolution from start to finish. It also enables us to cover different development challenges that you may encounter in a real-world QlikView project.
• We made sure to cover both backend and frontend development, so you will find that all 14 chapters cover different topics, from scripting and data extraction to data modeling, design, charts and expressions, as well as security, and everything in between. We also talk about various best practices related to each of these topics.
• All of the examples discussed in the book are complemented with solution files for the reader to follow the exercises and compare his work. The
QlikView files we provide are Personal Edition enabled, which means that a purchased QlikView license is not required to open them.
• Although the case and story used in the book are built around a fictional company, the data we use in our examples and final application is real. Thanks to the Open Government initiative and the Bureau of Transportation Statistics of the United States, which compiles and maintains a complete dataset about airline operations in the US, you will be able to work with real data and build a QlikView application to analyze flights, enplaned passengers, cargo, and many others across multiple dimensions such as carriers, airports, cities, aircraft types, and so on.
Congratulations on taking a step towards learning to develop Business Intelligence applications with QlikView. Are you ready for take off? Qlik On!
What this book covers
Chapter 1, Meet QlikView, introduces QlikView and shows how it can be used to explore data. We will also learn about the technology and components behind QlikView and will be introduced to the case that is used throughout the book: HighCloud Airlines.
Chapter 2, Seeing is Believing, helps us get hands-on with QlikView by building a simple QlikView document. We will learn what dimensions and expressions are in the context of a QlikView document. We will also learn to build simple charts to visualize and aggregate data, and how to design a basic user interface for navigating through the QlikView document.
Preface
[ 3 ]
Chapter 4, Data Modeling, explains which type of data model is best suited for
QlikView. We will see which "rules" need to be followed when designing a QlikView data model and will also learn how best to take advantage of the associative data model to make our documents highly dynamic.
Chapter 5, Styling Up, will help us learn how to style our QlikView documents. We will learn about the various document and sheet properties and will use them to manage the visual style of our document. We will also take a closer look at some of the most fundamental objects and learn how we can change their appearance.
Chapter 6, Building Dashboards, introduces us to the three basic types of QlikView users, and how we can best cater to their needs. We will learn about the various charting options that are available in QlikView, and will see how we can add interactivity to our QlikView documents. We will also be introduced to basic calculations.
Chapter 7, Scripting, introduces us to the QlikView scripting language and editor. We will learn about the most important script statements, and how we can use them to manipulate data and control the flow of the script. We will also be introduced to some of the most important operators and functions for dealing with various data types. Finally, we will look at the options for debugging scripts, how to organize and standardize scripts, and how we can reuse our scripts.
Chapter 8, Data Modeling Best Practices, expands on the knowledge about data modeling and scripting we gained in earlier chapters. We will learn how to make sure that data models are consistent and how to work with complex data models and multiple fact tables. We will also learn how to reduce storage requirements for a data set and how to best deal with date and time information.
Chapter 9, Basic Data Transformation, focuses on how to deal with unstructured data and how to transform it for use in our QlikView data model. We will learn about basic data transformation subjects, such as cleansing data and how to restructure pivoted and hierarchical tables for inclusion in the QlikView data model.
Chapter 10, Advanced Expressions, we will learn more about the use of variables. We will also learn how to use conditional functions and how to handle advanced aggregations.
Chapter 11, Set Analysis and Point In Time Reporting, takes a closer look at Set Analysis and will explain how it can be used for Point In Time Reporting. We will also learn about comparative analysis using alternate states.
Preface
Chapter 13, More on Visual Design and User Experience, gives us a closer look at the visual design of our QlikView documents and will learn how to create a consistent user interface. The second part of the chapter introduces us to some additional options for making our documents more interactive, and proactive.
Chapter 14, Security, shows us how to secure our QlikView documents. We will see how to allow only authorized users to open our documents and will learn how we can limit what a user can do and see within our document.
What you need for this book
To use this book, you primarily need the QlikView Desktop software. If you do not yet have this software, Chapter 1, Meet QlikView, explains how to obtain it. With regards to computer requirements, you will need a PC with at least Windows XP (or better), 2 GB of hard disk space, and 2 GB of RAM. A 32-bit machine can be used, but a 64-bit machine is recommended for this book and QlikView development in general.
For best understanding, a general knowledge of Business Intelligence and its terminology is required. Basic understanding of databases and SQL is preferred, but not compulsory for this book.
Who this book is for
This book is aimed at developers and power users who want to learn how to develop Business Intelligence applications with QlikView. Developers who have already been using QlikView for some time may find that this book contains useful tips and best practices to make more effective use of QlikView.
This book only covers QlikView Desktop. Deployments to QlikView Server and Publisher are beyond the scope of this book. The book is not aimed at QlikView Server Administrators.
Conventions
In this book, you will find a number of styles of text that distinguish between different kinds of information. Here are some examples of these styles, and an explanation of their meaning.
Preface
[ 5 ] A block of code is set as follows:
LOAD
[%Origin Airport ID], [Origin Airport]; SQL SELECT
`%Origin Airport ID`, `Origin Airport` FROM `Origin Airports`;
New terms and important words are shown in bold. Words that you see on the screen, in menus or dialog boxes for example, appear in the text like this: "We will now click on Test Connection to make sure the connection is established ".
Warnings or important notes appear in a box like this.
Tips and tricks appear like this.
Reader feedback
Feedback from our readers is always welcome. Let us know what you think about this book—what you liked or may have disliked. Reader feedback is important for us to develop titles that you really get the most out of.
To send us general feedback, simply send an e-mail to [email protected], and mention the book title through the subject of your message.
If there is a topic that you have expertise in and you are interested in either writing or contributing to a book, see our author guide on www.packtpub.com/authors.
Customer support
Now that you are the proud owner of a Packt book, we have a number of things to help you to get the most from your purchase.
Downloading the example code
Preface
Disclaimer
"QlikTech makes no representations or warranties with respect to the accuracy or completeness of the contents of the Book or the QlikView Materials referenced herein and specifically disclaims all warranties, including without limitation warranties of fitness for a particular purpose. The advice and strategies contained in the Book or the QlikView Materials may not be suitable for every situation. QlikTech shall not be liable for any damages, claims, costs, or causes of action, whether known or unknown, arising from the Book."
Errata
Although we have taken every care to ensure the accuracy of our content, mistakes do happen. If you find a mistake in one of our books—maybe a mistake in the text or the code—we would be grateful if you would report this to us. By doing so, you can save other readers from frustration and help us improve subsequent versions of this book. If you find any errata, please report them by visiting http://www.packtpub. com/support, selecting your book, clicking on the erratasubmissionform link, and entering the details of your errata. Once your errata are verified, your submission will be accepted and the errata will be uploaded to our website, or added to any list of existing errata, under the Errata section of that title.
Piracy
Piracy of copyright material on the Internet is an ongoing problem across all media. At Packt, we take the protection of our copyright and licenses very seriously. If you come across any illegal copies of our works, in any form, on the Internet, please provide us with the location address or website name immediately so that we can pursue a remedy.
Please contact us at [email protected] with a link to the suspected pirated material.
We appreciate your help in protecting our authors, and our ability to bring you valuable content.
Questions
Meet QlikView
Congratulations on your decision to start learning QlikView development! You are now well on your way to building and delivering analytical applications which will help you and your organization quickly gain new insights and make fact-based decisions.Before we dive in and start building all sorts of wonderful things, we first need to review some of the basics. This first chapter introduces us to the business end of QlikView. We will discover what QlikView is, how it's different from other tools, and how we can explore and interact with our data within a QlikView document. Of course, this being a technical book, we will also be looking at the various technical components that QlikView consists of. This chapter concludes with an introduction to HighCloud Airlines, the case we will be working on throughout the book.
In this chapter, specifically, we will look at: • What is QlikView?
• Exploring data with QlikView
• The technology and components behind QlikView
• HighCloud Airlines, and why QlikView might be just the tool they need
Meet QlikView
What is QlikView?
QlikView is developed by QlikTech, a company that was founded in Sweden in 1993, but has since moved its headquarters to the US. QlikView is a tool used for Business Intelligence, often shortened to BI. Business Intelligence is defined by Gartner, a leading industry analyst firm, as:
An umbrella term that includes the application, infrastructure and tools, and best practices that enable access to and analysis of information to improve and optimize decisions and performance.
Following this definition, QlikView is a tool that enables access to information in order to analyze this information, which in turn improves and optimizes business decisions and performance.
Historically, BI has been very much IT-driven. IT departments were responsible for the entire Business Intelligence life cycle, from extracting the data to delivering the final reports, analyses, and dashboards. While this model works very well for delivering predefined static reports, most businesses find that it does not meet the needs of their business users. As IT tightly controls the data and tools, users often experience long lead-times whenever new questions arise that cannot be answered with the standard reports.
How does QlikView differ from traditional BI?
QlikTech prides itself in taking an approach to Business Intelligence that is different from what companies such as Oracle, SAP, and IBM—described by QlikTech as traditional BI vendors—are delivering. They aim to put the tools in the hands of business users, allowing them to become self-sufficient because they can perform their own analyses.
Chapter 1
[ 9 ]
QlikTech chooses to describe itself as a BusinessDiscovery enterprise instead of Data Discovery enterprise. It believes that discovering business insights is much more important than discovering data. The following diagram outlines this paradigm:
Besides the difference in who uses the tool—IT users versus business users—there are a few other key features that differentiate QlikView from other solutions.
Associative user experience
The main difference between QlikView and other BI solutions is the associative userexperience. Where traditional BI solutions use predefined paths to navigate
Meet QlikView
An example is shown in the following image. While in a typical BI solution, we would need to start by selecting a Region and then drill down step-by-step through the defined drill path, in QlikView we can choose whatever entry point we like—Region, State, Product, or Sales Person. We are then shown only the data related to that selection, and in our next selection we can go wherever we want. It is infinitely flexible.
Additionally, the QlikView user interface allows us to see which data is associated with our selection.
For example, the following screenshot (from QlikTech's What's New in QlikView 11 demo document) shows a QlikView Dashboard in which two values are selected. In the Quarter field, Q3 is selected, and in the Sales Reps field, Cart Lynch is selected. We can see this because these values are green, which in QlikView means that they have been selected. When a selection is made, the interface automatically updates to not only show which data is associated with that selection, but also which data is not associated with the selection. Associated data has a white background, while non-associated data has a gray background. Sometimes the associations can be pretty obvious; it is no surprise that the third quarter is associated with the months July, August, and September. However, at other times, some not-so-obvious insights surface, such as the information that Cart Lynch has not sold any products in
Chapter 1
[ 11 ]
Technology
QlikView's core technological differentiator is that it uses an in-memorydatamodel, which stores all of its data in RAM instead of using disk. As RAM is much faster than disk, this allows for very fast response times, resulting in a very smooth user-experience.
In a later part of this chapter, we will go a bit deeper into the technology behind QlikView.
Adoption path
Meet QlikView
QlikView is free of charge for single-user use. This is called the PersonalEdition or PE. Documents created in Personal Edition can be opened by fully-licensed users or deployed on a QlikView server. The limitation is that, with the exception of some documents enabled for PE by QlikTech, you cannot open documents created elsewhere, or even your own documents if they have been opened and saved by another user or server instance.
Often, a business user will decide to download QlikView to see if he can solve a business problem. When other users within the department see the software, they get enthusiastic about it, so they too download a copy. To be able to share
documents, they decide to purchase a few licenses for the department. Then other departments start to take notice too, and QlikView gains traction within the organization. Before long, IT and senior management also take notice, eventually leading to enterprise-wide adoption of QlikView.
QlikView facilitates every step in this process, scaling from single laptop deployments to full enterprise-wide deployments with thousands of users. The following graphic demonstrates this growth within an organization:
Chapter 1
[ 13 ]
Exploring data with QlikView
Now that we know what QlikView is and how it is different from traditional BI offerings, we will learn how we can explore data within QlikView.
Getting QlikView
Of course, before we can start exploring, we need to install QlikView. You can download QlikView's Personal Edition from http://www.qlikview.com/download. You will be asked to register on the website, or log in if you have registered before.
Registering not only gives you access to the QlikView software, but you can also use it to read and post on the QlikCommunity (http://community.qlikview.com) which is the QlikTech's user forum. This forum is very active and many questions can be answered by either a quick search or by posting a question.
Meet QlikView
The example we will be using is the Movie Database, which is an example document that is supplied with QlikView. Find this document by scrolling down the Examples
list (it is around halfway down the list) and click to open it. The opening screen of the document will now be displayed:
Navigating the document
Most QlikView documents are organized into multiple sheets. These sheets often display different viewpoints on the same data, or display the same information aggregated to suit the needs of different types of users. An example of the first type of grouping might be a customer or marketing view of the data, an example of the second type of grouping might be a KPI dashboard for executives, with a more in-depth sheet for analysts.
Chapter 1
[ 15 ]
The tabs in the Movie Database document also follow a logical order. An introduction is shown on the Intro tab, followed by a demonstration of the key concept of QlikView on the How QlikView works tab. After the contrast with
Traditional OLAP is shown, the associative QlikView Model is introduced. The last two tabs show how this can be leveraged by showing a concrete Dashboard
and Analysis:
Slicing and dicing your data
As we saw when we learned about the associative user experience, any selections made in QlikView are automatically applied to the entire data model. As we will see in the next section, slicing and dicing your data really is as easy as clicking and viewing!
List-boxes
But where should we click? QlikView lets us select data in a number of ways. A common method is to select a value from a list-box. This is done by clicking in the list-box.
Let's switch to the How QlikView works tab to see how this works. We can do this by either clicking on the How QlikView works tab on the top of the sheet, or by clicking on the Get Started button.
The selected tab shows two list boxes, one containing Fruits and the other containing
Colors. When we select Apple in the Fruits list-box, the screen automatically updates to show the associated data in the Colors list-box: Green and Red. The color Yellow
Meet QlikView
Selections in charts
Besides selections in list-boxes, we can also directly select data in charts. Let's jump to the Dashboard tab and see how this is done. The Dashboard tab contains a chart labeled Number of Movies, which lists the number of movies by a particular actor. If we wish to select only the top three actors, we can simply drag the pointer to select them in the chart, instead of selecting them from a list-box:
Because the selection automatically cascades to the rest of the model, this also results in the Actor list-box being updated to reflect the new selection:
Of course, if we want to select only a single value in a chart, we don't necessarily need to lasso it. Instead, we can just click on the data point to select it. For example, clicking on James Stewart leads to only that actor being selected.
Search
Chapter 1
[ 17 ]
For example, we may want to run a search for the actor Al Pacino. To do this, we first activate the corresponding list-box by clicking on it. Next, we simply start typing and the list-box will automatically be updated to show all values that match the search string. When we've found the actor we're looking for, Al Pacino in this case, we can click on that value to select it:
Sometimes, we may want to select data based on associated values. For example, we may want to select all of the actors that starred in the movie Forrest Gump. While we could just use the Title list-box, there is also another option: associated search.
To use associated search, we click on the chevron on the right-hand side of the search box. This expands the search box and any search term we enter will not only be checked against the Actor list-box, but also against the contents of the entire data model. When we type in Forrest Gump, the search box will show that there is a movie with that title, as seen in the screenshot below. If we select that movie and click on Return, all actors which star in the movie will be selected.
Bookmarking selections
Meet QlikView
Creating a new bookmark
To create a new bookmark, we need to open the Add Bookmark dialog. This is done by either pressing Ctrl + B or by selecting Bookmark | Add Bookmark from the menu. In the Add Bookmark dialog, seen in the screenshot below, we can add a descriptive name for the bookmark. Other options allow us to change how the selection is applied (as either a new selection or on top of the existing selection) and if the view should switch to the sheet that was open at the time of creating the bookmark. The
Info Text allows for a longer description to be entered that can be shown in a pop-up when the bookmark is selected.
Retrieving a bookmark
Chapter 1
[ 19 ]
Undoing selections
Fortunately, if we end up making a wrong selection, QlikView is very forgiving. Using the Clear, Back, and Forward buttons in the toolbar, we can easily clear the entire selection, go back to what we had in our previous selections, or go forward again. Just like in our Internet browser, the Back button in QlikView can take us back multiple steps:
Changing the view
Besides filtering data, QlikView also lets us change the information being displayed. We'll see how this is done in the following sections.
Cyclic Groups
Cyclic Groups are defined by developers as a list of dimensions that can be
switched between users. On the frontend, they are indicated with a circular arrow. For an example of how this works, let's look at the Ratio to Total chart, seen in the following image. By default, this chart shows movies grouped by duration. If we click on the little downward arrow next to the circular arrow, we will see a list of alternative groupings. Click on Decade to switch to the view to movies grouped by decade.
Drill down Groups
Drill down Groups are defined by the developer as a hierarchical list of dimensions
Meet QlikView
In the Movies Database document, a drill down can be found on the tab labeled
Traditional OLAP. Let's go there.
This drill down follows the path Director | Title | Actor. Click on the Director A. Edward Sutherland to drill down to all movies that he directed, shown in the following screenshot. Next, click on Every Day's A Holiday to see which actors starred in that movie. When drilling down, we can always go back to the previous level by clicking on the upward arrow, located at the top of the list-box in this example.
Containers
Containers are used to alternate between the display of different objects in the same screen space. We can select the individual objects by selecting the corresponding tab within the container. Our Movies Database example includes a container on the
Analysis sheet.
Chapter 1
[ 21 ]
On the time chart, we can switch between Average length of Movies and Movie List
by using the tabs at the top of the container object.
But wait, there's more!
Meet QlikView
Click on the XL icon in the Movie List table to export the list of currently selected movies to Excel.
A word of warning when exporting data
When viewing tables with a large number of rows, QlikView is very good at only rendering those rows that are presently visible on the screen. When
Export values to Excel is selected, all values must be pulled down into an
Excel file. For large data sets, this can take a considerable amount of time
and may cause QlikView to become unresponsive while it provides the data.
The technology and components
behind QlikView
Now that we have seen how QlikView works from the point of view of a business user, it is time to get a little more technical. Let's take an in-depth look at the various components that QlikView consists of.
One of the key elements of QlikView is that it utilizes an in-memory database. Compared with a disk-based database, this offers a great advantage when it comes to performance. While disk-access time is measured in milliseconds, RAM access time is measured in nanoseconds, making it many orders of magnitude faster.
"But hold on—" you may say, "my hard disk has much more space than I have RAM in my PC; won't that mean that I can only load limited amounts of data into memory?"
This is a very valid question. Fortunately, there are two factors which counter this potential problem:
• Cheap memory and the advancement of 64-bit processors and operating systems: While 1 megabyte of memory, in 1957, would have cost a staggering US$ 411 million, nowadays, a gigabyte can be had for less than US$ 5 (source: http://www.jcmit.com/memoryprice.htm). Coupled with 64-bit operating systems, which can address much larger amounts of RAM than 32-bit systems (up to 2 terabyte on Windows 2008 R2), it is feasible and (relatively) affordable to load huge amounts of data into RAM.
• Clever compression: QlikView utilizes some sophisticated compression algorithms (and some common sense, such as de-duplicating data) to significantly reduce the amount of memory that is required to store data. Typically, on-disk data is compressed to 10 percent of its original size when it is loaded into QlikView.
Chapter 1
[ 23 ]
The way the data flows
While the in-memory database is excellent technology, it cannot function on its own. Functionally, data flows through QlikView in the following manner (also shown in the following image):
1. It starts with the source data. QlikView can load data from a large variety of sources, including ODBC, OLEDB, Flat Files (Excel, CSV, and so on), and
XML. There are also many different connectors, ranging from big enterprise applications such as SAP, to social networks such as Twitter.
2. The data is loaded into QlikView using a load script. This script can be used to extract, transform, and load data into the in-memory data model or to store it to the disk in intermediary data files called QVD files.
3. Data in the in-memory database is stored in an unaggregated format, meaning all aggregations are calculated on the fly. This simplifies data modeling in QlikView, as there is no need for separate aggregation tables. 4. Selections made by the user automatically cascade throughout the entire data
model and these changes are shown by QlikView's presentation engine. 5. QlikView applications can be presented in multiple clients. The Windows
Meet QlikView
When QlikView use expands
While QlikView deployments within an organization often start with a single (or few) local installations, they often do not stay that way. As the use of QlikView expands, keeping track of different versions, dealing with huge amounts of data, reloading and distributing applications, and making sure that only the right people have access to applications becomes increasingly hard when using only the Windows client.
Fortunately, QlikTech offers a large range of components which ensure that QlikView can scale from a local deployment on a laptop all the way to an enterprise-wide solution. These components can be classified into three classes (also shown in the following screenshot):
• Create content
Chapter 1
[ 25 ]
Create content
The Windows application we used earlier to navigate and analyse the data in Movies Database can not only be used to consume content, but it is also the main tool with which to create QlikView documents. As this book is focused on developers, this will be the main focus for the remaining chapters.
Reload, publish, and distribute content
When QlikView deployments expand, it becomes impractical to update and
distribute files manually. Also, data is loaded into RAM when using a local Windows application to open QlikView files. When working with huge amounts of data, each PC would also need a huge amount of RAM. This might work for developer PCs, but it is hardly a cost-effective solution to outfit each user in the organization with large amounts of RAM.
Fortunately, QlikView has three components to mitigate these potential roadblocks to broader adoption:
• QlikView Publisher: This component can take care of reloading, reducing, and distributing the QlikView documents. Jobs can be scheduled or triggered by external events. When QlikView Publisher has not been licensed,
QlikView Server can handle the task of reloading QlikView documents. • QlikView Server: This is a centralized server which can load QlikView
documents into memory and allows clients to interact with these documents remotely by using one of the QlikView clients. In addition to providing a central place where documents are stored, this also has the advantage of clients not needing huge amounts of RAM and CPU cores.
The clients do not need to load all of the data locally and the processing power of the server is used for calculating and aggregating data.
Meet QlikView
Consume content
QlikView documents can be consumed in multiple ways. While this book mainly focuses on the QlikView Desktop Windows application, it is interesting to take note of the other possibilities for deployment:
• Web browser—plugin or AJAX client: There are two options for consumption of QlikView documents via a web browser. The first option is an ActiveX plugin. While this plugin offers an experience that is closest to the native Windows application, it only works in Internet Explorer and requires the QlikView plugin software to be installed on each client PC. Because rolling out software to each client PC might not be practical, and because there are web browsers other than Internet Explorer, there is also a second option: the AJAX client. This client does not require any software to be installed and works with most modern browsers.
• iPad and other tablets: Tablets can access QlikView by using the AJAX client in their browser. The AJAX client automatically detects when a tablet is being used and switches to a touch-enabled interface. This makes it possible to develop a single QlikView document which can then be rolled out to both regular computers and mobile devices.
• iPhone, Android, and BlackBerry: Mobile devices with a smaller screen, such as most smartphones, can use a special version of the AJAX client: the Small Device version. Instead of displaying complete worksheets, which would be unreadable on a small screen, this client shows each of the objects (chart, table, and so on.) one by one.
• QlikView Workbench and SharePoint Web Parts: Using QlikView Workbench, objects from QlikView documents can be embedded within .NET-based web solutions. The SharePoint Web Parts can be used to embed objects from QlikView documents into SharePoint sites.
• PDF: In addition to all clients that allow interaction with the QlikView documents, and with an additional license, there is also an option to distribute static PDF reports from QlikView Publisher.
Chapter 1
[ 27 ]
Meet HighCloud Airlines
It's a typical Monday morning at the office. Sara, an executive at HighCloud Airlines, arrives early to begin a busy week. Work has been hectic lately.
Ever since the start of the Euro crisis, the market for air travel and cargo in HighCloud's home market in Europe has been steadily declining. As a result, HighCloud's financial results have also been sloping downward.
A few weeks ago, in an effort to turn the company around, Steve, the CEO, launched an initiative to investigate the company's expansion into other markets. Sara and her team have been tasked with investigating the US airline market. It's a project that, if done well, might really raise the profile of Sara and the team.
Unfortunately, data from many different sources, complicated query tools, and dozens of spreadsheets have made progress slow so far. Even worse, each presentation of preliminary results has triggered a wave of new questions which cannot be answered by the existing reports and analyses. Morale within the team has been steadily dropping and Sara has noticed that Steve is increasingly annoyed by the lack of results.
Unlike the rest of the team, Sara is in an exceptionally good mood this morning. After hearing good things about QlikView, she decided to download a copy of the Personal Edition last weekend. Experimenting with it, she managed to load some data into QlikView and has even created a few charts and tables.
With her laptop under her arm and a smile on her face, she walks confidently into the CEO's office and announces, "Steve, you have to see this."
Meet QlikView
Summary
This concludes our first chapter. In this chapter, we've learned what QlikView is and how it differs from traditional BI solutions. We've also seen how QlikView works from the perspective of a business user, and have had a peek at the various technical components that QlikView consists of. We concluded this chapter with an introduction to Sara and her team, and their task—to investigate if expanding to the US market might help the struggling HighCloud Airlines make a recovery.
To sum it all up, in this chapter, we have learned:
• That QlikView is a Business Intelligence solution that is different from traditional BI solutions because of its associative user experience, its underlying technology, and its typical bottom-up adoption path. • How to make sense of our data: by selecting, filtering, searching,
bookmarking, cycling, and drilling.
• How the technology behind QlikView works, how it is deployed, and the various ways in which applications can be consumed.
• What HighCloud's current problems are and how Sara and her team hope to help resolve them using QlikView.
Seeing is Believing
As we've seen in the previous chapter, HighCloud Airlines has a particular need: to be able to analyze the US airline market from different perspectives, be able to create reports that help them better understand what the situation is, and evaluate if entering that market is a good strategy. Sara took the risk and showed the CEO what they could potentially do with QlikView and he was impressed by what he saw. After their meeting, Sara was asked to arrange a formal proof-of-concept session.
This chapter will not only follow a QlikView team working on the Seeing is Believing (SiB) phase of the pre-sale process, along with the HighCloud Airlines executives evaluating it, but it will also help us learn some basic concepts about developing QlikView documents.
So, let's get our hands on the subject and start creating. There is no better way to learn than by doing, and this chapter will be the initial platform on which we will base our QlikView development experience. It will help you build your first business discovery app with QlikView, completely hands-on from the start.
On a technical level, after going through the tutorial presented in this chapter, you will be able to:
• Understand the steps required in the construction process of a QlikView document
• Identify what dimensions and expressions are within the context of a QlikView document
• Build charts to visualize and aggregate data
Seeing is Believing
What is a SiB?
A SiB (an acronym for Seeing is Believing) is the proof-of-concept session in which, during the pre-sale process, the technical capabilities of the QlikView software are demonstrated to the prospective customer. The way we demo QlikView at this stage usually involves creating a targeted QlikView document that uses the customer's actual data in a limited amount of time.
That's why, in this chapter, we will build a QlikView document based on real and useful data, focused on HighCloud Airlines' line of business. The dataset we will use is publicly available and covers information about airline operations in the US. The original data files have been downloaded from The Bureau of Transportation Statistics of the United States website (http://transtats.bts.gov), and have been pre-processed so that we can focus on the main concepts this chapter is intended to outline. As the book evolves, we will introduce more advanced concepts so that, in the end, we are able to work with the original data files throughout the whole processing phase.
Because of the nature of the SiB phase, the analytical application should be
developed rather quickly by the QlikView team. Since it will mainly be focused on technical features and data discovery functionalities, some design details (such as color, style, object positioning, and so on) have been left out for now. However, these details will be covered in their own good time, later in the book.
Preparing the workspace
Before we start, we need to make sure we have everything we'll need throughout the chapter.
Since the previous chapter covered the QlikView Desktop installation process, we assume that it is already installed on your machine by now. If not, please take a moment to install it before continuing.
Setting up the folder structure
We will create a Windows folder structure with which we'll work throughout the book. This set of folders will help us organize the various files we'll be using and arrange them by the specific role these files play in our project.
The files provided along with the book are already
structured with the folders we need. If you have already
Chapter 2
[ 31 ]
A typical QlikView deployment scenario will include different types of files, but for now we'll just focus on two of them:
• The source data files • The QlikView document
Downloading the example code
You can download the example code files for all Packt books you have
purchased from your account at http://www.packtpub.com. If you purchased this book elsewhere, you can visit http://www.packtpub. com/support and register to have the files e-mailed directly to you.
Follow these steps to set up the environment:
1. Create a Windows folder with which you will work throughout the entire book and call it QlikView Development. Place it in the location of your choice. 2. Inside this folder, create another one. This folder will specifically be used
to store the set of files we will work with. You may name the new folder as Airline Operations.
3. Inside the Airline Operations folder, create two additional subfolders, one called Data Files and the other called Apps.
4. Inside the Data Files folder, create yet another folder and name it QVDs. The final folder structure is depicted in the following screenshot:
5. Copy the QVD files corresponding to this chapter into the Data Files\QVDs folder.
Our environment is almost set up. The only thing left is to create the QlikView document.
Creating the QlikView document
To create the QlikView file we will use to build our app, follow these steps: 1. Launch the QlikView program.
Seeing is Believing
3. The Getting Started wizard dialog may instantly appear, asking you to select a data source. We will, for now, ignore it. Click on Cancel.
° Don't worry if this dialog window doesn't appear when launching QlikView.
4. Go to the File menu again and click on Save as…. We will save the document inside the Airline Operations\Apps folder and name it Airline Operations.qvw.
Now that we have our environment ready, let's move on to create our analytical application.
QlikView documents are often referred to as 'applications' or 'apps' as they offer a much more interactive experience than the term 'document' would imply. In this book, we will be using the terms 'document', 'application' and 'app' interchangeably.
Creating the app
We can think of a QlikView document as being composed of two major elements: • The dataset that the user analyzes: This is the backend of our QlikView
document and includes all of the source tables needed to build a data model, as well as the logic to update its source data.
• The user interface through which the user analyzes the data: This is the frontend of our analytical app and includes the objects contained in the document (like a listbox to make selections and filter data), or the charts and tables used to visualize the information.
In hand with the elements described above, we will break the construction of our QlikView document into two major phases:
• Constructing the data model • Designing the user interface
However, before moving on to create our QlikView document, we should have a clear understanding of the business-side requirements for our app, so the construction and design phases are fully focused towards meeting those requirements.