Automatic Samples Selection Using Histogram of Oriented
Gradients (HOG) Feature Distance for
Tsunami Victims Detection
Inzar Salfikar1,2, Indra Adji Sulistijono1, Achmad Basuki1
1Graduate School of Engineering Technology Politeknik Elektronika Negeri Surabaya (PENS)
Electrnics Engineering Polytechnic Institute of Surabaya (EEPIS) Kampus PENS, Jalan Raya ITS Sukolilo, Surabaya 60111, Indonesia
2Politeknik Aceh
Kampus Politeknik Aceh, Jalan Politeknik Aceh, Banda Aceh 23119, Indonesia E-mail: [email protected],{indra,basuki}@pens.ac.id
Abstract
Finding victims at a disaster site is the primary goal of Search-and-Rescue (SAR) operations. Many technologies created from research for searching disaster victims through aerial imaging. but, most of them are difficult to detect victims at tsunami disaster sites with victims and backgrounds which are look similar. This research collects post-tsunami aerial imaging data from the internet to builds dataset and model for detecting tsunami disaster victims. Datasets are built based on distance differences from features every sample using Histogram-of-Oriented-Gradient (HOG) method. We use the longest distance to collect samples from photo to generate victim and non-victim samples. We claim steps to collect samples by measuring HOG feature distance from all samples. the longest distance between samples will take as a candidate to build the dataset, then classify victim (positives) and non-victim (negatives) samples manually. The dataset of tsunami disaster victims was re-analyzed using cross-validation Leave-One-Out (LOO) with Support-Vector-Machine (SVM) method. The experimental results show the performance of two test photos with 74.36% precision, 81.60% accuracy, 61.70% recall and f-measure 67.44% to distinguish victim (positives) and non-victim (negatives).
Keywords: Support-Vector-Machine (SVM), Victim Detection, Tsunami Disaster Sites, Aerial Imaging, Histogram-of-Oriented-Gradients (HOG).
1. INTRODUCTION
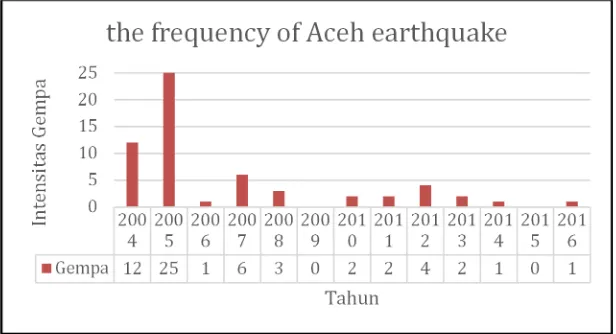
struck in various regions of Indonesia. The earthquake in Aceh Province was the worst to result in a tsunami that claimed more than 200,000 lives [1].
The handling of the evacuation of victims from disasters involves various parties, such as Search-And-Rescue (SAR), Indonesian-Red-Cross (PMI) and academics and scientists to form an integrated team to evacuate disaster victims to the maximum [2]. The search for disaster victims requires precise and accurate information so that it can be handled effectively and efficiently. The cause of delay in handling the disaster victims is the slowness of location information and the number of victims [3].
Figure 1. Graph of earthquake intensity (>6.0 SR) in the last 13 years in Aceh.
In this paper, the concentration of research is to build datasets and models for the detection of disaster victims by using image processing to speed up the reconstruction process. An excellent method for detecting human body to date is SVM and HoG [4]. This method has a good performance to detect the human body like a pedestrian [5] and disaster victims [6]. The model used greatly affects the end result of the detector.
Figure 2. Photos of victims after the tsunami disaster
The case used in this research is the tsunami disaster victims' body model, as shown in Figure 2. Disaster victims who mingle with the ruins of
buildings and other objects with almost indistinguishable colors and shapes. In the post-tsunami disaster area, very few body parts of victims are clearly seen, such as parts of the body covered with mud that have the same color and texture as the surrounding objects. Therefore in this research used two classifications to form a detection model by using Support-Vector-Machine (SVM) [4]. In this case, a special model is required in the manufacture of a model detector that refers to any object that may be around the victim as negative samples and collect as many positive samples as possible of the human body pose.
However, the lack of dataset of the tsunami victims made the detection process less accurate. That's why we need to collect photo samples of Tsunami disaster victims to create the dataset. We collected as many as possible post-tsunami victim disaster photos taken from aerial imaging in internet as well as some trusted sources such as the National SAR Agency (BASARNAS) and Tsunami-Disaster-and-Mitigation-Research Center (TDMRC), collected snippets of images from each photo and grouped them into two classifications: Groups of victims (positives) and non-victims (negatives).
The sampling process as a dataset until today done by manual crop, so it takes a long time. In this paper, we provide a faster dataset creation solution automatically with step provide fixed size on sliding windows (image slicing), compare the distance of HOG feature on first sample with next sample, automatic crop on sliding windows position with difference of feature distance upper than 0.15, makes the most recent sample as the new comparator data and repeats the next samples up to the last pixel. It is expected that this research can be an effective and efficient solution to the process of making tsunami disaster victims dataset.
2. RELATED WORK
Mykhaylo Andriluka, et al [8] from TU Darmstadt, Germany. They offer a new method of detecting people visually through aerial photographs. They use 220 images collected indoors using a quadrotor that flies with a height between 1.5 to 2.5 meters. They assume 50% of the upper human body visible from each dataset with criteria similar to the "Progressive Search Space Reduction for Human Pose Estimation" study presented by Vittorio Ferrari, et al [9]. Comparisons were made using the HOG detector of Dalal and Triggs [4] Reaching 15.1% equal error rate (EER), then using a similar concept that is the upper body of the human "HOG-upper" [9] with EER 21.9%, poselet detector [10] yields 32.0% EER, DPM detector [11] 42.5 and 51.5% EER respectively. The desired results from the evaluation of several detection methods and feature extractions are datasets suitable for detecting victims rather than monolithic models.
Yücel Uzun, et al [6] from Yildiz Technical University, Turkey. They researched on how to detect disaster victims using USARSim simulation software that is used in one of RoboCup's "Robot Virtual Robot Search and Rescue Competitions" [12]. Where the competition rules the robot only allows the camera as a sensor to detect the victim. They used the feature extraction method of HOG [4] in the simulation to study the difference in features of the victim and non-victims. In their research described that they use datasets constructed from various forms of human body pose (victims) in the simulation software. They used 100 samples as training data and 100 samples as a test. The feature extraction results were trained using the Support Vector Machine (SVM) method [4], [5]. In their research, they managed to achieve 95% success in the detection of victims automatically.
Indra Adji Sulistijono dan Anhar Risnumawan [3] From Electrical Engineering Polytechnic Institute of Surabaya (EEPIS), Indonesia. They conducted a victim-detection research on the victim in disaster sites with cluttered background photos using Multilayer Neural Networks method, where the dataset was built is a photo of the actual disaster victims taken with the camera obtained from the internet, the dataset consists of 50 photos of victims of disaster named "IDV-50". They demonstrated deep learning method for detection of disaster victims using IDV-50 datasets with satisfactory detection results.
Takuya Kobayashi, et al [5], from the University of Tsukuba and the Institute of Advanced Industrial Science and Technology (AIST), Japan. They research about pedestrian features by using the HOG feature extract [4]. In their research, feature extraction was performed on the pixel part of the sample of 16x16 pixels. Features that have been collected from pedestrian photos are trained using SVM [4]. Evaluation of the research was the selection of appropriate HOG features and trained to be models for detecting pedestrians.
which there are edge-based features, texture measures, and color information. There are several other studies that lead to hybrid features on [14], [15], [16], [17], [18], [19]. However, performance improvements appear with the dimension of the feature as well.
Amit Satpathy, et al [20], Member, IEEE. Using the INRIA dataset [4], Caltech Pedestrian Data Set [21] and Daimler Pedestrian Classification Benchmark [22]. The performance of the proposed approach is compared with some of the current methods in the given dataset. In their research, they explain the detector performance for INRIA dataset and Caltech Pedestrian, cell size is an 8x8 pixel, block size 2x2 with overlap 50%. While on the Daimler dataset using 3x3 pixel cell size, 2x2 block curve and with overlap 66.6%. The number of the bin from that three datasets is 18bin. The normalization procedure used is clipping value 0.08. The accuracy obtained is ± 90%.
David S. Bolme, et al [23], From Colorado State University, USA. They conducted research on human detection simply by using HOG [4] as its feature extract. Research carried out offers a detection rate of up to 25 frames per second on a video. Training data performed on videos with a duration of 12 seconds resulted in a detection window of 3,145,728. The algorithm flow to detect is the Region-of-Interest (ROI), preprocessing, training using Average-of-Synthetic-Exact-Filters (ASEF) [24] correlation filter. Training is done by using 32 frames of the video, each frame is divided into 4 regions, each region randomized as much as 4 times. ASEF filter on 512 images (32 x 4 x 4 = 512). The training window size is 96x64 pixels and produces 3,201,024 detection windows. Training time is 11.5 seconds using Apple MacBook Pro with a 2.4Ghz Intel Core 2 Duo processor. The comparison of training time to 512 images on ASEF with a size of 96x64 pixel window detection is 0.12 seconds.
3. ORIGINALITY
4. SYSTEM DESIGN
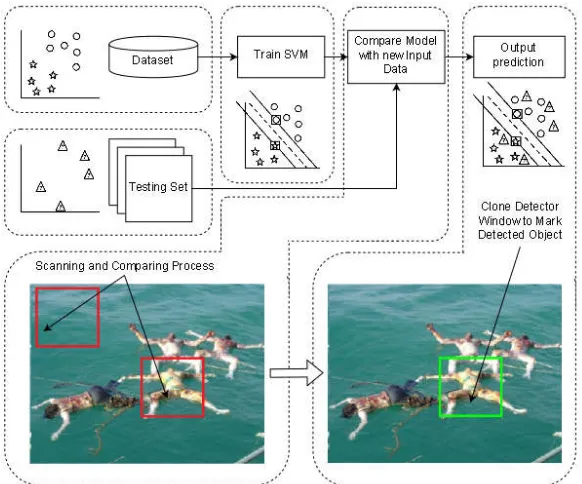
Our system consists of 4 steps: (1) Data Collection, (2) Data Processing, (3) Trial and Performance Analysis. The system diagram is shown in Figure 3.
Figure 3. Overall system design of sample collecting process to build dataset and model of tsunami disaster victim detection
4.1. Data Collection
This study uses photos collected from several sources, Tsunami Disaster and Mitigation Research Center (TDMRC), National SAR Agency (BASARNAS) and news archives on the internet. The photographs are photos of tsunami victims that occurred on December 26, 2004. Of the 4 photos we get, 2 photos of them are used to create a dataset and 2 other photos are used to test the accuracy of tsunami disaster victim detection from dataset model that has been made
4.2. Data Preprocessing
In this section, the data is prepared to serve as sample pieces that will later become training data. The steps taken are, (1) Automatic Slicing for Dataset, (2) Feature Extraction, (3) Selection and Analysis, discussed in section 4.2.1-4.2.3.
4.2.1. Automatic Slicing for Dataset
At this stage, we use a 96x96 pixel sliding window, 50% overlap and feature extraction using the Histogram of Oriented Gradient (HOG). Cutting this data only aims to collect samples that will be used as a dataset after the feature extracted first.
4.2.2. Feature Extraction
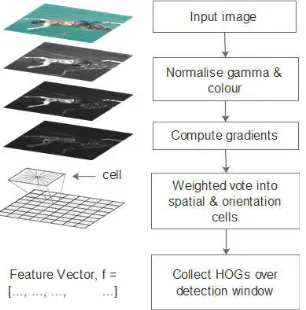
The dataset consists of a positive sample (victim) and a negative sample (non-victim). To convert the dataset into numerical data is done feature extraction process using the Histogram-of-Oriented-Gradient (HOG) [4].
Figure 5. Feature extraction using Histogram-of-Oriented-Gradient (HOG)
In the extraction of this HOG feature, we use a picture image RGB which is converted to black and white (grayscale) to minimize the color difference (histogram equalization). To calculate the gradient of the samples in the dataset, we apply the Sobel operator with 3x3 kernel size;
= −1 0 1−2 0 2
−1 0 1 =
−1 −2 −1 0 1 0
1 2 1 (1)
Using the derived values of each sample in the dataset, voting on pixels calculated by formula;
= + (2)
Then, edge orientation calculated by formula;
= (3)
4.2.3 Selection and Analysis
The selection process is done by measuring the feature spacing between samples that have been collected in the process of Automatic Slicing. Samples with significant (longest) distances will be candidates in the dataset. Feature distance measurements are based on the surrounding samples (sequential sample indices). At this stage, eligible samples of distance more than 0.15 will be selected and collected into new sample data which will be the dataset. All sample data were classified by manual observations based on most dominate victim body in every sample classify as positive class and less dominate victim body which includes cluttered background and other object classify as negative class.
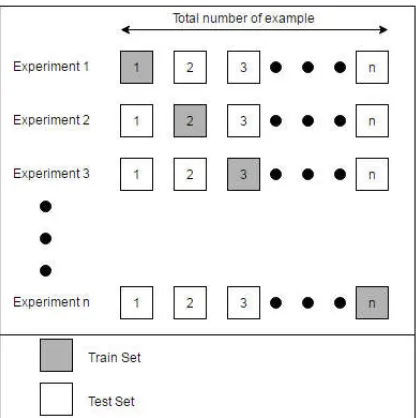
Furthermore, dataset validation is done by dividing between data trained with experimental data before modeling using classification algorithms. Some studies use validation models such as holdout, random sub-sampling, K-fold cross-validation, bootstrap and leave-one-out (LOO).
Figure 8. Leave-one-out cross-validation flow process
In this study chose LOO as a cross-validation sample because our data contains almost similar information between the background and the victim, we need to validate each sample data to avoid similar features between positives and negatives sample to build a good model detection. Figure 8 above shows the flow of LOO cross-validation process.
= ∑ (6)
where,
= Experiment
The performance of the classification can be measured by calculating accuracy, precision, recall, and F-measure using formula (7-10).
= (7)
= (8)
= (9)
− = 2 × × (10)
where,
TP = True Positive FP = False Positive TN = True Negative FN = False Negative
Our research focuses on accuracy to detect tsunami victims in cluttered backgrounds.
5. EXPERIMENT AND ANALYSIS
In this study, we conducted an analysis of the detection results in the test images using a model built from training data. Model-making steps and conducting detection experiments are described in Section 5.1-5.4.
5.1. Data Collection
In the process of collecting data, we obtained data from the internet and some other trusted sources such as TDMRC and BASARNAS. The data is separated into two parts namely testing and training. We used four photos in this study. Figure 9 shows two photographs used as testing images (for dataset creation) and 2 photographs used for detection experiments on models constructed from training images.
(a) (b) (c) (d)
5.2. Data Preprocessing
Data processing is done by collecting samples of tsunami disaster victim by automatic photo sliced using the comparison of HOG feature distance as the initial sample with the next sample. The distance more than 0.15 will be selected. Bellow is the steps to completion of this automatic sample collection:
Step 1: Automatic Slicing for Dataset
The initial data retrieval at the initial position of the photo is the size of the sliding window (96x96 pixels) starting from pixels (0,0) to pixels (96.96). The shift in the sliding window is set to 50% overlap from the sliding window size (slide every 48,48 pixels).
Step 2: Feature Extraction using HOG
In this step, the initial sliding window position is taken as a sample data sample against the next sample. At this stage, the operator's Sobel is applied to the sliding window position and feature extracted using HOG.
Step 3: Selection and Analysis
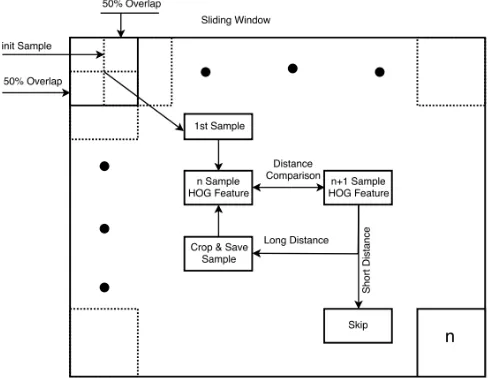
Using the vector distance data, the sample is selected with a minimum distance >0.15. If the distance between the two samples is <0.15, the sample is considered to resemble. Conversely, if the distance between the two samples is >0.15, the sample at the sliding window position is taken, cut and saved as the new sample to be compared again to the next sample on the sliding window until the sliding window ends in the final pixel of a photo.
Figure 10. Automatic capture process in collecting sample data
Picture annotation:
1. The comparative sample (update every new sample are selected). 2. Sliding window.
3. The result of sample collection.
1
2
In Figure 10with label “1” above, the sample is shown on the small box as the latest sample and the results are directly stored into a folder. The collected samples included victim (positive) and non-victim (negative) samples that had not been classified.
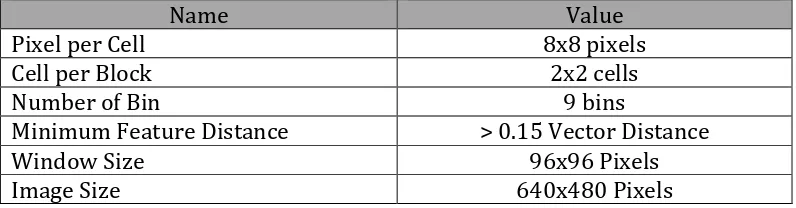
Table 1. The configuration of HOG feature extraction
Name Value
Pixel per Cell 8x8 pixels
Cell per Block 2x2 cells
Number of Bin 9 bins
Minimum Feature Distance > 0.15 Vector Distance
Window Size 96x96 Pixels
Image Size 640x480 Pixels
Automatic data collection is run on a computer with Intel dual-core processor 3.0 GHz, 4 GB RAM, NVIDIA GeForce GTX 460 SE 768 MB GPU, Windows 7 Ultimate Operation System and Python 2.7 programming language with Open-Computer-Vision (OpenCV) 2.4.13 library.
Table 2. Total sample and collecting time
Name Collecting Time (min) Auto Manual Total Sample (image) Auto Manual
Train1.jpg 0.34 11 95 13
Train2.jpg 0.11 15 30 18
Manual Classification 5 N/A N/A N/A
Total 5.45 26 125 31
data from collecting automatically then divided into 2 class namely the victim (positive) and non-victim (negative) manually (5 min). The dataset that has been built will be converted into numerical data using HOG feature extraction method. Some of the image snippets from the data collection are automatically shown in Figure 12 below:
Positive
Negative
5.3. Cross-Validation and Testing Model for Detection
We test data that has been classifying and labeled using SVM method. This stage we use LOO as cross-validation with the following result shown in Table 3 below:
Table 3. Performance of sample data per photo (A=Auto, M=Manual) Sample
Source Accuracy(%) Precision(%) A M A M Recall(%) A M F-measure(%) A M Train1.jpg 87.37 84.62 95.45 80 65.62 100 77.77 88.88 Train2.jpg 76.67 72.22 75 66.67 80 33.33 77.42 44.44 Combine 81.60 78.65 74.36 78.57 61.70 78.57 67.44 78.57
Testing of photos which not included in creating dataset is done using the result of a combination of data sample with automatic selection method showing 81.60% accuracy and using manual selection showing 78.65% accuracy shown in Table 3 above.
5.3.1. Testing Detection Using SVM Method
SVM is a method of learning through training that aims to determine the dividing line between the two classes. SVM does this by mapping positive and negative training data into high-dimensional space features based on the features contained in the data. After all training data is mapped, we calculate the hyperplane of the two groups of data that has the largest margin to the nearest positive and negative exercise data vector. Determination of the vector margins of the data of this training is called the support vector [25], [26], [27].
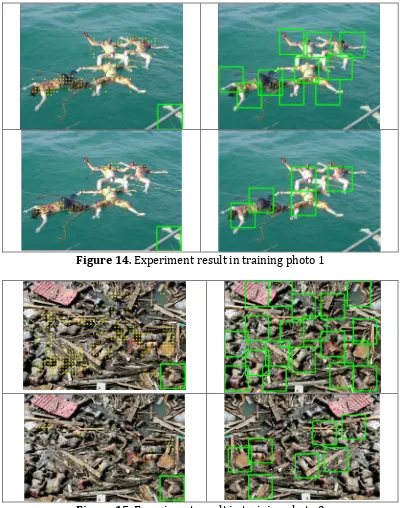
Experiment result of tsunami disaster victim detection on 2 training image shown in Figure 14 and Figure 15, and on 12 testing image shown in Figure 16 to Figure 27 below, the first line in Figure 14 to Figure 27 below is the result of the detection of the training dataset constructed automatically, the second line in Figure 14 to Figure 27 is the result of the detection using manually constructed dataset training.
Figure 14. Experiment result in training photo 1
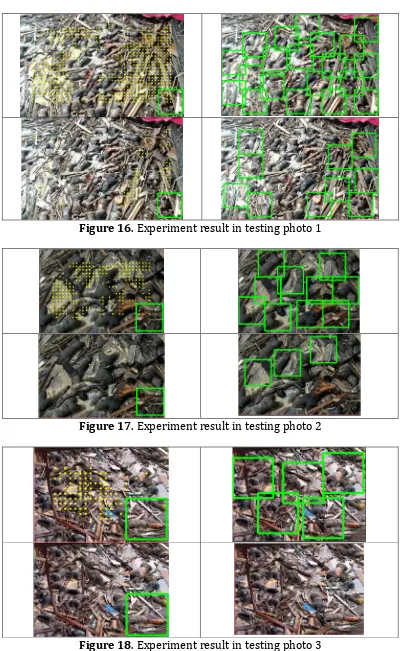
Figure 16. Experiment result in testing photo 1
Figure 17. Experiment result in testing photo 2
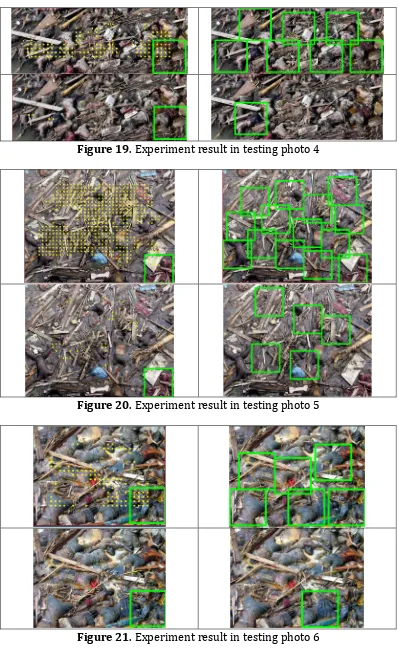
Figure 19. Experiment result in testing photo 4
Figure 20. Experiment result in testing photo 5
Figure 22. Experiment result in testing photo 7
Figure 24. Experiment result in testing photo 9
Figure 25. Experiment result in testing photo 10
Figure 27. Experiment result in testing photo 12
The performance of the above experimental results is shown in Table 4 below:
Table 4. Tsunami post-disaster victim detection performance
Image Result Auto Precision (%) Manual Auto Recall (%) Manual Train1.jpg Figure 14 100 100 100 100 Train2.jpg Figure 15 68.42 42.87 72.22 18.72 Test1.jpg Figure 16 55 40 36.67 22.22 Test2.jpg Figure 17 60 33.33 75 14.27 Test3.jpg Figure 18 80 N/A 40 N/A Test4.jpg Figure 19 71.42 100 62.50 10 Test5.jpg Figure 20 28.57 20 80 20 Test6.jpg Figure 21 66.66 100 50 11.11 Test7.jpg Figure 22 35.71 50 100 42.87 Test8.jpg Figure 23 83.33 N/A 35.71 N/A Test9.jpg Figure 24 33.33 100 100 100 Test10.jpg Figure 25 66.66 N/A 100 N/A Test11.jpg Figure 26 66.66 N/A 100 N/A Test12.jpg Figure 27 33.33 N/A 100 N/A
around the victims we want to detect. The left side of Figure 14 to Figure 27 above just draw dot the center of the boxes for easy analysis. The right side of Figure 14 to Figure 27 is the final result after removing the redundant bounding boxes by grouping the boxes with some close region.
6. CONCLUSION
Research on automatic sample collection using a distance of HOG feature vector has been successfully performed. The dataset is classified into two parts: victim (positive) and non-victim (negative). Dataset is tested using SVM with LOO validation method. our experiment produces an accuracy of 81.60%, precision of 74.36%, recall of 61.70% and F-measure of 67.44%. This result is obtained from some samples of aerial photographs of tsunami victims taken to different heights so that the objects and victims inside have different scales for each photo, Whereas dataset creation is done assuming the height of image capture is fixed or equal, so the objects in it have the same scale for all photos and cutting the image is done using the same size. The next research is to try to create a dataset with varying sizes of images.
Acknowledgements
REFERENCES
[1] R. Bethany, Ring of fire, 1st ed. Santa Barbara, California: ABC-CLIO, LLC, 1998.
[2] BRR, “ACEH DAN NIAS SETAHUN SETELAH TSUNAMI Upaya Pemulihan Dan Langkah Ke Depan,” 2005.
[3] I. A. Sulistijono and A. Risnumawan, “From Concrete to Abstract : Multilayer Neural Networks for Disaster Victims Detection,” Int. Electron. Symp. (IES), Denpasar, pp. 93–98, 2016.
[4] N. Dalal and B. Triggs, “Histograms of oriented gradients for human detection,” Proc. - 2005 IEEE Comput. Soc. Conf. Comput. Vis. Pattern Recognition, CVPR 2005, vol. I, pp. 886–893, 2005.
[5] T. Kobayashi, A. Hidaka, and T. Kurita, “Selection of histograms of oriented gradients features for pedestrian detection,” Lect. Notes Comput. Sci. (including Subser. Lect. Notes Artif. Intell. Lect. Notes Bioinformatics), vol. 4985 LNCS, no. PART 2, pp. 598–607, 2008.
[6] Y. Uzun, M. Balcilar, K. Mahmoodi, F. Davletov, M. F. Amasyali, and S. Yavuz, “Usage of HoG (histograms of oriented gradients) features for victim detection at disaster areas,” ELECO 2013 - 8th Int. Conf. Electr. Electron. Eng., pp. 4–7, 2013.
[7] C. Papageorgiou, “A Trainable System for Object Detection in Images and Video Sequences,” Int. J. Comput. Vis., vol. 38, no. 1685, pp. 15–33, 2000.
[8] M. Andriluka et al., “Vision based victim detection from unmanned aerial vehicles,” IEEE/RSJ 2010 Int. Conf. Intell. Robot. Syst. IROS 2010 - Conf. Proc., pp. 1740–1747, 2010.
[9] V. Ferrari, M. Marin-Jimenez, and A. Zisserman, “Progressive Search Space Reduction for Human Pose Estimation,” IEEE Conf. Comput. Vis. Pattern Recognit., vol. 2, no. figure 1, pp. 1–8, 2008.
[10] L. Bourdev, J. Malik, U. C. Berkeley, A. Systems, P. Ave, and S. Jose, “Poselets : Body Part Detectors Trained Using 3D Human Pose Annotations,” 2009 IEEE 12th Int. Conf. Comput. Vis., pp. 1365--1372, 2009.
[11] P. Felzenszwalb, D. McAllester, and D. Ramanan, “A Discriminatively Trained, Multiscaled, Deformable Part Model,” Cvpr, pp. 1–8, 2008. [12] S. Carpin, M. Lewis, J. Wang, S. Balakirsky, and C. Scrapper, “USARSim:
A robot simulator for research and education,” Proc. - IEEE Int. Conf.
Robot. Autom., pp. 1400–1405, 2007.
[13] W. R. Schwartz, A. Kembhavi, D. Harwood, and L. S. Davis, “Human detection using partial least squares analysis,” Comput. Vision, 2009 IEEE 12th Int. Conf., p. 1, 2009.
[14] A. Bar-hillel, D. Levi, E. Krupka, and C. Goldberg, “LNCS 6314 - Part-Based Feature Synthesis for Human Detection,” Eur. Conf., pp. 127– 142, 2010.
classification,” Proc. IEEE Comput. Soc. Conf. Comput. Vis. Pattern Recognit., no. July, 2007.
[16] P. Dollár, Z. Tu, P. Perona, and S. Belongie, “Integral Channel Features,” BMVC 2009 London Engl., pp. 1–11, 2009.
[17] P. Dollar, S. Belongie, and P. Perona, “The Fastest Pedestrian Detector in the West,” Procedings Br. Mach. Vis. Conf. 2010, p. 68.1-68.11, 2010.
[18] S. Walk and N. Majer, “[Poster]New Features and Insights for Pedestrian Detection,” Comput. Vis. Pattern Recognit., pp. 8–8, 2010. [19] C. Wojek and B. Schiele, “A performance evaluation of single and
multi-feature people detection,” Jt. Pattern Recognit. Symp., pp. 82– 91, 2008.
[20] A. Satpathy, X. Jiang, and H. L. Eng, “Human detection by quadratic classification on subspace of extended histogram of gradients,” IEEE Trans. Image Process., vol. 23, no. 1, pp. 287–297, 2014.
[21] P. Dollár, C. Wojek, B. Schiele, and P. Perona, “Pedestrian detection: An evaluation of the state of the art,” IEEE Trans. Pattern Anal. Mach. Intell., vol. 34, no. 4, pp. 743–761, 2012.
[22] S. Munder and D. M. Gavrila, “An experimental study on pedestrian classification,” IEEE Trans. Pattern Anal. Mach. Intell., vol. 28, no. 11, pp. 1863–1868, 2006.
[23] D. S. Bolme, Y. M. Lui, B. a. Draper, and J. R. Beveridge, “Simple real-time human detection using a single correlation filter,” 2009 Twelfth IEEE Int. Work. Perform. Eval. Track. Surveill., pp. 1–8, 2009. [24] D. S. Bolme, B. A. Draper, and J. R. Beveridge, “Average of synthetic
exact filters,” 2009 IEEE Comput. Soc. Conf. Comput. Vis. Pattern
Recognit. Work. CVPR Work. 2009, pp. 2105–2112, 2009.
[25] A. Ben-hur, D. Horn, and V. Vapnik, “Support Vector Clustering,” vol. 2, pp. 125–137, 2001.
[26] D. Roth, “Support Vector Machines,” pp. 1–12, 2016.