Customer Satisfaction Control Application in Quality
Assurance Departement at Petra Christian University
using Fuzzy Aggregation
Andreas Handojo
Informatics Departement Petra Christian University Jl. Siwalankerto 121-131, SurabayaIndonesia
Rolly Intan
Informatics Departement Petra Christian University Jl. Siwalankerto 121-131, SurabayaIndonesia
Denny Gunawan
Informatics Departement Petra Christian University Jl. Siwalankerto 121-131, SurabayaIndonesia
ABSTRACT
As an institution that want to give a good service to their customer, Petra Christian University need to watch over the service quality that each department/unit give to their customer. To do it, Quality Assurance Department (QAD) was created to measure, supervise and maintain the customer satisfaction level in the university. To do that, QAD must distribute many questionnaires from each department/unit to their own customer which is include all university students, administration staff, and faculty member. And then, the result from that questionnaire must be calculated to produce customer satisfaction level, which is need a lot of time.
In this research, an Customer Satisfaction Control Application was created to help Quality Assurance Department to distribute questionnaire, and to help in measuring the performance of every department/unit in Petra Christian University. This application will be build using fuzzy aggregation to examine the customer satisfaction questionnaire result and build using MYSQL and PHP.
Based on testing, this application has helped the users in evaluating the performance, and with the usage of graphics which explain the result of the questionnaire in more detail, and distributing the questionnaires to most of university students, administration staff, and lecturers.
Keywords
Fuzzy Aggregation, Customer Satisfaction, Quality Assurance Departement.
1.
INTRODUCTION
As an educational institution, Petra Christian University has an obligation to maintain their quality service that provided to each civitas academica and stakeholders. Based on that a Quality Assurance Department (QAD) has been established to measure, supervise, and maintain the university services quality, by accommodating all of comments and suggestions from students, administrative staff, and faculty member that collect every semester via questionnarie.
To achieve this objective, one of the activities carried by QAD is to distribute the questionnaire from each department/unit to
their customer (that can be students, administration staff, or faculty member). The purpose of this questionnaire is to evaluate the satisfaction level from students, administration staff, and faculty member of the University toward all of the services that provided by the university. Using this questionnaire all criticisms, suggestions, and recommend about all the service can become an input to Petra Christian University to improving a better education.
The Difficulties that encountered by QAD is that the number of subjects (that must be cover) from the questionnaire is so big because the university has around 29 academic department and 15 non academic department/unit (such as Biro, library, and other service center) and to process this questionnaire it will be takes a lot of time. Besides that, there is another difficulty, how to assess customer satisfaction levels that have a qualitative input to a quantitative result.
Therefore, this research try to create an customer satisfaction control application that build base on website, so make the questionnaire from each department easy to distribute to their each customer and this application also process the questionnaire result to become level of customer satisfaction using fuzzy aggregation method to accomodate the qualitative problem.
2.
FUZZY SET
Fuzzy set is a generalization of crisp sets in which each member of the set was characterized by a membership function. Range/domain values that used as a membership function values have a value between 0 and 1 [2]. This membership function of a fuzzy set A of a universal set X is expressed as μA:
1
,
0
:
X
Figure 1. Fuzzy Set “approaching value 3” The description of Figure 1 is as follows:
• A (3) = 1 and A (x) <1 for all x ≠ 3 • A symmetrical peak of x is worth 3 points • A (x) decreases from 1 to 0 on each difference
2
)
3
(
x
(2)Overall, for A can be expressed: [3]
5
1
,
0
5
1
,
2
)
3
(
1
)
(
x
and
x
for
x
for
x
x
A
(3)2.1
Fuzzy Aggregation
Aggregation is a process of combining the values (numeric or non numeric) into one, so the result of aggregation is the result of the calculation of these values [2]. Aggregation Operators are divided into three general classes, and each class has a different nature or meaning, namely:
2.1.1
Conjunctive Operators
Conjunctive operators function is to combine multiple values by using the operator "and", so the result of the combination is high if and only if all the combined value of high [2]. Triangular norms (t-norms) are used in the conjunctive operators for fuzzy sets are:
)
,
(
min
)
,
(
x
y
x
y
f
(4)2.1.2
Disjunctive Operators
Disjunctive operators function is to combine multiple values by using the operator "or", so the result of the combination is high if one or some combination of high value [2]. Triangular conforms (t-conorms) are used in disjunctive operators for fuzzy sets are:
)
,
(
max
)
,
(
x
y
x
y
f
(5)2.1.3
Averaging Operators
Between conjunctive and disjunctive operators, there is one more class of operators which is averaging operators. The value of averaging operators is located in between the minimum and maximum value, which is the distance between norms and t-conorms [2]. Averaging operators have compensative properties (offset), where a low value could be offset by the high yield combined with intermediate value.
)
,
max(
)
,
(
)
,
(
min
x
y
f
x
y
x
y
(6)2.1.4
Ordered Weighted Averaging (OWA)
Operators
By using OWA operators [1], some fuzzy values can be combined as in the averaging operator by giving the weight to each condition, which
w
w
1,
w
2,
...,
w
n is the OWAweight to calculate the value of a set of values
a
1,
a
2,
...,
a
ncan be generated by the following equation:
h
w(
a
1,
a
2,
...,
a
n)
w
1b
1w
2b
2...
w
nb
n (7)Where’s
b
1,
b
2,
...,
b
n is the permutation value fromn
a
a
a
1,
2,
...,
that create to make
n
n
b
b
b
b
b
1 2 3...
1. Example: assume that
]
1
.
0
,
2
.
0
,
3
.
0
,
4
.
0
[
w
and
h
w(
0
.
7
,
1
.
0
,
3
.
0
,
0
.
6
)
. If it is sorted, then we will get b1 = 1.0, b2 = 0.7, b3 = 0.6, and b4 = 0.3. By doing aggregation, it will get:hw(0.7, 1, 0.3, 0.6) = (0.4)(1) + (0.3)(0.7) + (0.2)(0.6) + (0.1)(0.3) = 0.76
3.
DESIGN AND IMPLEMENTATION
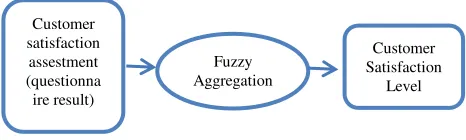
Generally, the process from this system can be seen in Figure 2.
Figure 2. System Process Outline
At Petra Christian University, customer satisfaction assessment process carried out by a standard assessment which covers five aspects of service such as reliability, tangible, responsiveness, assurance, and empathy. This all five aspects will be cover on each questionnaire that has been distributed to all university members (student, administration staff, and faculty member) via website. The result from this questionnaire will automatically calculate on the website, which is the level of importance and the level of satisfaction about the service that has been given by each department/unit to their customer, and the difference between that two will become their performance result.
To calculate service quality performance that has been given by each department/unit. First, we define the fuzzy membership level of the importance (Figure 3), level of satisfaction (Figure 4), and performance result (Figure 5), along with performance rules that are used in the calculation process (Table 1).
Figure 3. Fuzzy Membership for Level of The Importance A1 = Not Important
A2 = Quite Important A3 = Important
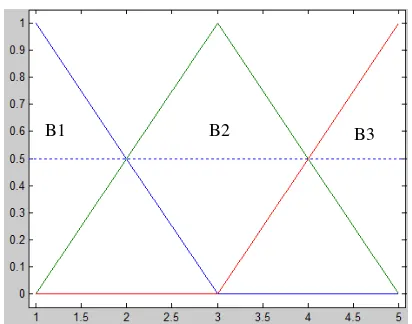
Figure 4. Fuzzy Membership for Level of Satisfaction Value
B1 = Not Satisfied B2 = Quite Satisfied B3 = Satisfied
Figure 5. Fuzzy Membership for Performance Result
C1 = Very Poor C2 = Poor C3 = Fair Enough C4 = Fair
C5 = Good Enough C6 = Good C7 = Very Good
On Table 1 show an example of rules that used to calculate the performance result using Fuzzy.
Table 1. Performance Rules that Used in Calculating Using Fuzzy
Level of
Importance &
Level of Satisfaction →
Performance Result A1 & B1 → C1 A2 & B1 → C2 A3 & B1 → C3 A1 & B2 → C4 A2 & B2 → C5 A3 & B2 → C5 A1 & B3 → C4 A2 & B3 → C6 A3 & B3 → C7
The next step is to get the membership of the input value of the level of importance and satisfaction for each of the existing rules. Then for any rules, find the minimum value and then get the maximum value from the minimum values that obtained before. After that, we will get the performance results according to table the performance results, using the equation below:
Wide
weight
x
wide
result
e
Performanc
(3.1) After that, by using ordered weighted averaging operators [5] we can get the value of the performance by calculating the predetermined weights and the average point.
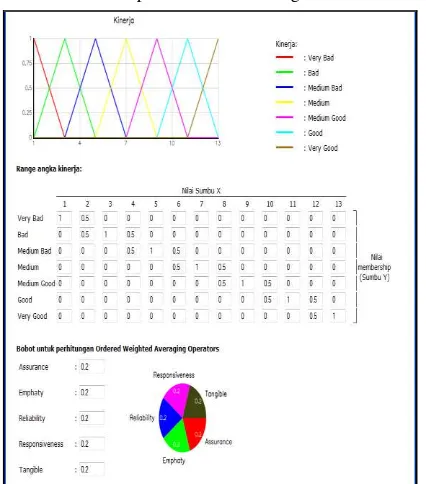
On the application, before the questionnaire distribute to the respondent, the administrator from QAD first must determined the fuzzy membership value from level of the importance, level of
B1 B2 B3
A1 A2 A3
satisfaction, and performance result, along with rules that are used in the calculation process as show in Figure 6.
Figure 6. Determined the Fuzzy Membership Value
Then, the administrator can create the question from the questionnaire that wants to distribute (Figure 7). This questionnaire will save as a question data bank that can be use to build a questionnaire template (Figure 8).
This question can be group into the five aspects like tangible, reliability, responsiveness, assurance, and empathy as standard assessment.
So the template can be use as a master from the questionnaire that can be use in many department/unit, especially department/unit that give similar services or have same target respondent. This template also can be edited according specialty from each department/unit.
Figure 7. Create Question for the Questionnaire
Figure 8. Manage Questionnaire Template to Distribute
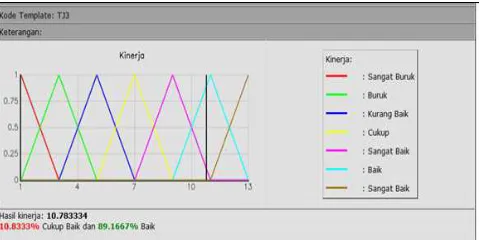
After the questionnaires has been distributed and filled out by the respondents, then after a fixed time, this distribution process has been closed and the calculation performance process has been performed. The performance result can be show on bar chart (Figure 9) or as a fuzzy membership (Figure 10).
Figure 10. Performance Result on Fuzzy Membership
4.
CONCLUSION
This application has helped the QAD to distribute the questionnaire from many department/unit on university to their customer to know their service performance on give the best service to their customer.
By applying fuzzy aggregation for determine level of the importance, satisfaction, and performance result, along with performance rules that are used in the calculation process,
can solve the problem on evaluating the performance, and with the usage of graphics which explain the result of the questionnaire in more detail view.
5.
REFERENCES
[1] F.ChicIana, F.Herrera, E.Herrera-Viedma and L.Martinez, 2003. A Note on the Reciprocity in the Aggregation of Fuzzy Preference Relations Using OWA Operators, Fuzzy Sets and Systems.
[2] Grabisch, M., Orlovski, S.A., and Yager, R.R. 1999. Fuzzy aggregation of numerical preferences. Norwell, United States of America: Kluwer Academic Publisher [3] Hellman, M. 2003. Fuzzy logic introduction. France:
Laboratoire Antennes Radar Telecom
[4] Klir, G., Yuan, B. 1995. Fuzzy sets and fuzzy logic: Theory and applications. Upper Saddle River, United States of America: Prentice Hall Inc.