YIELD STABILITY OF NEW HYBRID RICE ACROSS LOCATIONS
Satoto *), I.A. Rumanti and Y. Widyastuti Indonesian Center for Rice Research
Jl. Raya 9 Sukamandi Subang 41256 West Java Indonesia *)Corresponding author email: [email protected]
Received: September 28, 2015/ Accepted: January 13, 2016
ABSTRACT
The adaptation of hybrid rice varieties mostly are in specific location and season, but there are some of the varieties have a wide adaptation then adopted by the farmer in the large area. Replicated yield trials were conducted to study the stability of hybrid rice yield and identify the best location to optimize their yield per ha. The trials were conducted in three location such as Sukamandi, Salatiga and Malang during two seasons in 2011. Data across location and season were analazed by using AMMI and Eberhart Russel methods. The AMMI analysis showed that the IR79156A/PK88 was adaptable to favorable environments but unstable. This hybrid is always performing well and produce the higher yield compare to check variety. Some of other hybrids were good only in specific location, i.e. IR62829A/BP2280-1E-12-22 and IR58029A/ BP2280-1E-12-22. Those hybrids produced higher yield in Salatiga and Malang, respectively. Seem to AMMI analysis, the result of Eberhart and Russell method also showed that IR79156A/PK81 was the best hybrid with regression slope (b) around 1 with the yield average higher than average of all hybrids. It indicated that this hybrid has a wide adaptation and probably can be cultivated in the wider ecosystem.
Keywords: AMMI; hybrid rice; stability; yield
INTRODUCTION
Plant breeders invariably encounter geno-type x environment interactions (GEIs) when testing varieties across a number of environ-ments. Depending upon the magnitude of the interactions or the differential genotypic responses to environments, the varietal rankings can differ greatly across environments.
Genotype-environment interaction (GEI) in hybrid rice (Oryza sativa L.) varieties is the differ-ential response of genotypes to changing envi-ronmental conditions. Some researchers reported
that hybrid rice varieties may not produce uniform yields across different environment as a result of the existence of genotype x environment (G x E) interaction (Satoto et al., 2010; Sreedhar et al., 2011; Widyastuti and Satoto, 2012; Satoto et al., 2013).
Univariate and multivariate statistical stability are the two major methods to analyse genotype x environment interactions and pheno-typic stability (Lin et al., 1986). Some of the me-thods have been suggested for analyzing the genotype x environment interaction and yield sta-bility of a genotype. Finlay and Wilkinson (1963) stated that bi considers a cultivar stable if its response to environments is parallel to the mean response of all cultivars in the trial. Varieties with regression coefficient b1=0, shows the rela-tionship between fluctuations in yield and changes in the environment. The higher coefficient value (bi > 1.0), the higher level of response of a variety. In the case when (bi < 1.0), a variety shows a weaker response to environmental conditions than the average pool of the varieties under study. Eberhart and Russell (1965) revealed that S2d considers a cultivar stable if the residual mean square from
Finlay and Wilkinson’s regression model is not
significant. The stability characteristics of a genotype will be higher, if the sum of yield devi-ation squares of genotype is low. A genotype is defined stable if having a coefficient regression over the environments close to 1.00 (bi=0) and the minimum deviations from the regression of S2d=0.
The multiplicative interaction model was first introduced by Crossa (1990), then adapted to the agricultural framework as AMMI by Gauch and Zobel (1996). The main additive effect and multiplicative interaction (AMMI) analysis is a model that combines both additive and multi-plicative components of a two way data structure that allows a breeder to obtain precise prediction on potential genotype and environmental effects on it (Akter et al., 2014). This method has proven effective because it intercepts a large part of the
Cite this as: Satoto, I.A. Rumanti and Y. Widyastuti. 2016. Yield stability of new hybrid rice across locations.
AGRIVITA. 38(1): 33-39. doi: 10.17503/agrivita.v38i1.675 Accredited: SK No.81/DIKTI/Kep/2011
GEI sum of square, it obviously separates main and interaction AMMI effects. The analysis not only serves an estimate of the total G x E interaction effect of each genotype but further partitions it into the environmental effects due to the interaction of the individual (Ebdon and Gauch, 2001). It com-bines the analysis for the genotypic and main environmental effect with several graphically represented interactions for principal component analysis (IPCA). Thus, it helps to summarize the pattern and relationship of genotypes, the environment, and their interaction. The aim of this research was to establish yield stability parameters in eighteen hybrid rice combination and to select the most valuable ones for the development of a stable variety.
MATERIALS AND METHODS
Eighteen new promising hybrid rice were used as testing materials compared to Hipa10 as hybrid check variety and Ciherang as popular inbreed check variety. These hybrids rice derived from CMS introduced from IRRI namely IR580 25A, IR62829A, IR68885A, IR68897A, IR79156A and IR80151A.
Field experiments were conducted in the 2011 dry season (DS) and in the 2011 rainy season (WS) at three location i.e. Sukamandi West Java (Alluvial, 16 m above the sea level), Batang Central Java (Alluvial, 200 m above the sea level) and Malang (Alluvial, 400 m above the sea level), Indonesia. In each location-season site, 18 hybrids were tested compare to Hipa10 as hybrid check and Ciherang as inbred check varieties in a field experiement by using Random-ized Complete Block Design (RCBD) with three replications. The plot size was 3 x 5 m2. Each plot consisted of ten rows with 25 hills per row. The area was plowed and harrowed. Fertilizer of 300 kg urea/ha, 100 kg TSP/ha, and 100 kg KCl/ha were applied in the field and according to the recommended time and doses. After land preparation, the experimental plots were laid out and labeled accordingly. Twenty-one days old seedlings were planted in each designated plot. Each of the twenty-six genotypes was transplanted in each block using one-two seedling per hill, with planting space of 20 x 20 cm. Hand weeding was done when weeds were observed growing after the rice plants have recovered. Normal cultural practices were followed. The crop was protected from insect pest and diseases through chemical
control as and when needed. Harvesting was done when 85% of the grains were straw (i.e. yellow) colored and hard dough stage. Each plot har-vested after cutting one row at border, off-type and abnormal plant.
The grain yield and its components (i.e. the length of the panicle, productive tiller number per hill, filled grains number per panicle, unfilled grains number per panicle, percentage of filled grains per panicle (seed set), and 1000 filled grains weight) were observed. Data of grain yield and yield components were analyzed using IRRISTAT (ver-sion 4.4) and the analysis of variance in RCBD was used to determine treatment differences. Groups of plant types were compared based on the least significant difference test (LSD) at the 5%. AMMI analysis and Eberhart Russel method were carried out using the IRRISTAT program. Standard heterosis (SH) was calculated as equation below by using of the standard variety Ciherang as the popular variety in Indonesia.
where and are the mean of F1 progenies and standard variety Ciherang in all replications.
RESULTS AND DISCUSSION
The combined analysis of variance is presented in Table 1. Genotype (G), environment (E) and genotype × environment interaction (GxE)
Table 1. The combined analysis of variance for grain yield at 6 environments
Source of variation Degree of
freedom Sum square Mean square
Explained sum square (%) Total 284 355.390
Replications 2 0.129
Environment (E) 5 192.53 38.506** 54.17 Genotype (G) 19 78.154 4.113** 21.99 G x E 95 83.471 0.879* 23.49 Error 190 1.107 0.006
Remarks: * = significant at 5% level, ** = significant at 1% level
Table 2. Grain yield and environment index of eighteen hybrid rice combinations in six testing locations, 2011
No Hybrid rice/check varieties
Grain yield (t ha-1) at across locations and seasons:
Mean Salatiga
DS
Sukamandi DS
Malang DS
Salatiga WS
Sukamandi WS
Malang WS
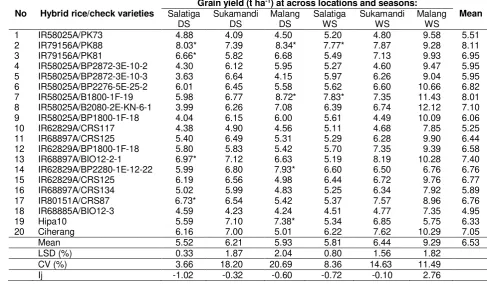
1 IR58025A/PK73 4.88 4.09 4.50 5.20 4.80 9.58 5.51 2 IR79156A/PK88 8.03* 7.39 8.34* 7.77* 7.87 9.28 8.11 3 IR79156A/PK81 6.66* 5.82 6.68 5.49 7.13 9.93 6.95 4 IR58025A/BP2872-3E-10-2 4.30 6.12 5.95 5.27 4.60 9.47 5.95 5 IR58025A/BP2872-3E-10-3 3.63 6.64 4.15 5.97 6.26 9.04 5.95 6 IR58025A/BP2276-5E-25-2 6.01 6.45 5.58 5.62 6.60 10.66 6.82 7 IR58025A/B1800-1F-19 5.98 6.77 8.72* 7.83* 7.35 11.43 8.01 8 IR58025A/B2080-2E-KN-6-1 3.99 6.26 7.08 6.39 6.74 12.12 7.10 9 IR58025A/BP1800-1F-18 4.04 6.15 6.00 5.61 4.49 10.09 6.06 10 IR62829A/CRS117 4.38 4.90 4.56 5.11 4.68 7.85 5.25 11 IR68897A/CRS125 5.40 6.49 5.31 5.29 6.28 9.90 6.44 12 IR62829A/BP1800-1F-18 5.80 5.83 5.42 5.70 7.35 9.39 6.58 13 IR68897A/BIO12-2-1 6.97* 7.12 6.63 5.19 8.19 10.28 7.40 14 IR62829A/BP2280-1E-12-22 5.99 6.80 7.93* 6.60 6.50 6.76 6.76 15 IR62829A/CRS125 6.19 6.56 4.98 6.44 6.72 9.76 6.77 16 IR68897A/CRS134 5.02 5.99 4.83 5.25 6.34 7.92 5.89 17 IR80151A/CRS87 6.73* 6.54 5.42 5.37 7.57 8.96 6.76 18 IR68885A/BIO12-3 4.59 4.23 4.24 4.51 4.77 7.35 4.95 19 Hipa10 5.59 7.10 7.38* 5.34 6.85 5.75 6.33 20 Ciherang 6.16 7.00 5.01 6.22 7.62 10.29 7.05 Mean 5.52 6.21 5.93 5.81 6.44 9.29 6.53 LSD (%) 0.33 1.87 2.04 0.80 1.56 1.82
CV (%) 3.66 18.20 20.69 8.36 14.63 11.49 Ij -1.02 -0.32 -0.60 -0.72 -0.10 2.76
Remarks: Value within column with *: significantly different at LSD 5% than Ciherang; Ij: Environmental index, DS: Dry season, WS: Wet season
Table 2 shows that the coefficient of varia-tion ranged from 3.66% (Salatiga, DS 2011) to 20.69% (Malang, DS 2011). It means that grain yield data collected were valid for variance analy-sis. Different genotypes showed inconsistent per-formance across all environments.The genotypic mean of grain yield ranged from 4.95 to 8.11 t ha-1. The hybrid IR79156A/PK88 yielded over the check variety Ciherang at three locations i.e. Salatiga and Malang at DS and Salatiga at WS, whereas IR58025A/B1800-1F-19 at two locations, i.e. Malang DS and Salatiga WS. Most hybrid rice
yielded grain were not significant than Ciherang. The average yields of eighteen hybrid combi-nations ranged from 4.95 to 8.11 t ha-1, while that of Ciherang was 7.05 t ha-1. All hybrids gave yield potential lower than Ciherang, except IR79156A/ PK88, IR58025A/B1800-1F-19, and IR68897A/ BIO12-2-1.
produc-tivity; locations with higher environmental index are more suitable for plant growth than other locations with lower Ij value (Karimzadeh et al., 2012). Tiawari et al. (2011) also stated that land is more productive when its Ij value is higher. Environment index values showed the importance of variability as well as the difference with other induced factors in detecting the performance of genotypes under different environments. The environmental mean from 5.52 to 9.29 t ha-1 and averaged grain yield over environments and genotypes is 6.53 t ha-1. Environmental index (Ij) of six environments ranged from -1.02 to 2.76 (Table 2). On the basis of the environmental index value in terms of negative and positive, Salatiga DS, Sukamandi DS, Sukamandi WS, and Salatiga DS are poor, and Malang are rich environment. Within the genotypes, six hybrids rice have higher average yields and these geno-types adapted to favorable environments, while genotypes IR79156A/PK88 and IR58025A/ B1800-1F-19 adapted to poor envi-ronments (Table 2).
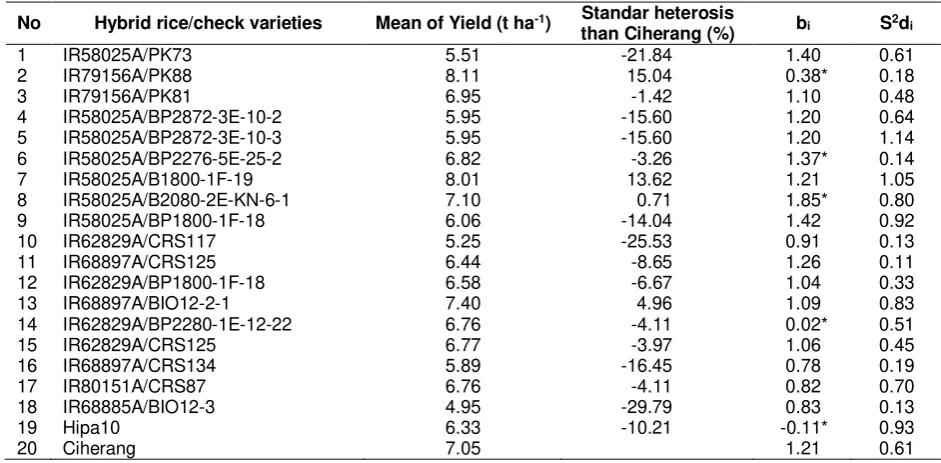
The mean of grain yield, standard heterosis than Ciherang and stability parameters
of the eighteen tested hybrid combinations and two check varieties are presented in Table 3. Standard heterosis most of all hybrid rice was negative except IR68897A/BIO12-2-1, IR58025A /B1800-1F-19, and IR79156A/PK88 i.e 4.96%, 13.62% and 15.04% respectively. Coefficient of regression (bi) varied from -0.11 to 1.85. Coef-ficient of regressions of all hybrid combinations except IR79156A/PK88, IR58025A/ BP2276-5E-25-2, IR58025A/B2080-2E-KN-6-1, IR62829A/B P2280-1E-12-22, and Hipa10 were significantly different from one, means that these hybrids were
not stable. In 2011, by Eberhart and Russell’s
method, there were two genotypes with grain yield higher than grand mean showed specific adaptability to favorable environments (b>1 i.e IR79156A/PK81, and IR58025A/B1800-1F-19), two hybrid had wide adaptability (b = 1, i.e. IR68897A/BIO12-2-1 and IR62829A/CR S125) and only one hybrid showed and unfavorable environments (b<1 IR80151A/CRS87). The envi-ronments classified as favorable was Malang and as unfavorable were Sukamandi and Salatiga.
Table 3. Mean of yield, standard heterosis, coefficient regression, and deviation of regression for 18 hybrid rice and 2 check varieties tested in 6 environments in Indonesia, 2011
No Hybrid rice/check varieties Mean of Yield (t ha-1) Standar heterosis
than Ciherang (%) bi S2di 1 IR58025A/PK73 5.51 -21.84 1.40 0.61 2 IR79156A/PK88 8.11 15.04 0.38* 0.18 3 IR79156A/PK81 6.95 -1.42 1.10 0.48 4 IR58025A/BP2872-3E-10-2 5.95 -15.60 1.20 0.64 5 IR58025A/BP2872-3E-10-3 5.95 -15.60 1.20 1.14 6 IR58025A/BP2276-5E-25-2 6.82 -3.26 1.37* 0.14 7 IR58025A/B1800-1F-19 8.01 13.62 1.21 1.05 8 IR58025A/B2080-2E-KN-6-1 7.10 0.71 1.85* 0.80 9 IR58025A/BP1800-1F-18 6.06 -14.04 1.42 0.92 10 IR62829A/CRS117 5.25 -25.53 0.91 0.13 11 IR68897A/CRS125 6.44 -8.65 1.26 0.11 12 IR62829A/BP1800-1F-18 6.58 -6.67 1.04 0.33 13 IR68897A/BIO12-2-1 7.40 4.96 1.09 0.83 14 IR62829A/BP2280-1E-12-22 6.76 -4.11 0.02* 0.51 15 IR62829A/CRS125 6.77 -3.97 1.06 0.45 16 IR68897A/CRS134 5.89 -16.45 0.78 0.19 17 IR80151A/CRS87 6.76 -4.11 0.82 0.70 18 IR68885A/BIO12-3 4.95 -29.79 0.83 0.13 19 Hipa10 6.33 -10.21 -0.11* 0.93 20 Ciherang 7.05 1.21 0.61
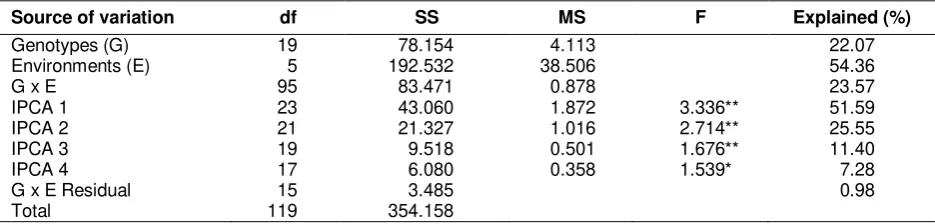
Table 4. AMMI analysis of variance for grain yield (t ha-1) of the genotypes across environments
Source of variation df SS MS F Explained (%)
Genotypes (G) 19 78.154 4.113 22.07 Environments (E) 5 192.532 38.506 54.36 G x E 95 83.471 0.878 23.57 IPCA 1 23 43.060 1.872 3.336** 51.59 IPCA 2 21 21.327 1.016 2.714** 25.55 IPCA 3 19 9.518 0.501 1.676** 11.40 IPCA 4 17 6.080 0.358 1.539* 7.28 G x E Residual 15 3.485 0.98
Total 119 354.158
Remarks: ** significant at 5 and 1% probability by the F test
The AMMI analysis variance for grain yield (t ha-1) of 20 genotypes tested in 6 environments showed that 54.36% of the total sum of square was attributable to environment effects, only 22.07% to genotypic effect and 23.57% of the total variation for grain yield (Table 4). The large sum of square of environments denotes that the environ-ments were diverse and causing the variation in grain yield. The magnitude of the GEI sum of squares was 1.07 times larger than that for genotypes, which suggests that there were major differences in genotypic response across environ-ments. This report is in harmony with the findings of Blanche et al. (2009), Hasan et al. (2011) and Tariku et al. (2013).
Results from AMMI analysis (Table 4) also showed that the first interaction principal compo-nent axis (IPCA 1) of the interaction captured 51.59% of the interaction sum of squares in 23.57% of the interaction degrees of freedom. Similarly, the second principal component axis (PCA 2) explained a further 25.55% of the GEI sum of squares. For further, PCA 1 and PCA 2 had larger sums of squares than that of genotypes. Cumulatively the mean squares for the PCA 1 and PCA 2 were able to explain 77.14% from the total GxE variation. This indicated that the interaction of the 18 rice genotypes with 6 environments was predicted by the first two components of genotypes and environments. This result was in conformity with the findings of Gauch and Zobel (1996) that the most accurate model for AMMI can be predicted using the first two IPCAs.
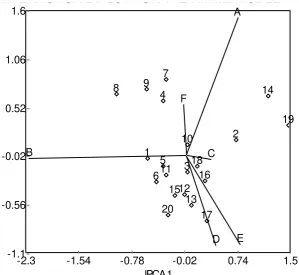
Biplot analysis is the interpretive tool for AMMI models. Hernandez and Crossa (2000) stated that a biplot resulted from genotypic and environmental scores of IPCA 1 and IPCA 2 of AMMI components. A biplot has four sections,
depending on signs of the genotypic and environmental scores. In AMMI 2 biplot (Figure 1), the IPCA scores for both the genotypes (numbers) and environments (alphabet) were plotted over the mean grain yield for the genotypes and the envi-ronments respectively. Sites with short spokes do not exert strong interactive forces, while those with long spokes exert strong interaction. The IPCA scores of a genotype in the AMMI analysis indicated the adaptability over environments. An example, the environments C and F had short spokes and it did not exert strong interactive forces. The genotypes that occur adjacent on the plot will tend to have similar yields in all envi-ronments while genotypes apart may be different in the average yield or show a different pattern of response over the environments. Therefore, the genotypes close to the origin were not sensitive to the interaction of the environment and the geno-types that far from the origins were sensitive and had large interaction.
INTERACTION BIPLOT FOR THE AMMI2 MODEL
IPCA1
1.5 0.74
-0.02 -0.78
-1.54 -2.3
1.6
1.06
0.52
-0.02
-0.56
-1.1
1
2
3 4
5 6
7
8 9
10
11
12 13
14
15 16
17 18
19
20
A
B C
D E
F
Remarks: A: Malang DS, B: Malang WS, C: Sukamandi DS, D: Sukamandi WS, E: Salatiga DS, F: Salatiga WS Figure 1. Interaction Biplot for AMMI2 Model Fit 77.1% of GxE
CONCLUSIONS AND SUGGESTIONS
The mean grain yield value of genotypes averaged over environments indicated that IR79156A/PK88 was the highest (8.11 t ha-1) and IR68885A/BIO12-3 was the lowest yield (4.95 t ha-1), respectively. The hybrid rice IR79156A/PK88 was adaptable to favorable environments with highest grain yield but unstable. IR79156A/PK81, IR68897A/BIO12-2-1, and IR62829A/CRS125 hy-brid combinations had a regression coefficient nearest to one. It means that they were stable and adaptable to both favorable and unfavorable environments. IR80151A/CRS87 hybrid combina-tions was more adaptable to sub optimal environ-ments. As a breeding, it is better to cluster the testing locations into homogenous groups used for breeding for specific adaptation and/or for broad adaptation.
ACKNOWLEDGEMENTS
The authors would like to express their profound gratitude to the Indonesian Center for Rice Research under IAARD Ministry of
Agricul-ture, the Republic of Indonesia, for funding and use of its facilities.
REFERENCES
Akter, A., M.J. Hassan, M.U. Kulsum, M.R. Islam, K. Hossain and M.M. Rahman. 2014. AMMI biplot analysis for stability of grain yield in hybrid rice (Oryza sativa L.). Journal of Rice Research. 2(2): 126-129. doi: 10.4172/jrr.1000126
Blanche, S.B., H.S. Utomo, I. Wenefrida and G.O. Myers. 2009. Genotype × environ-ment interactions of hybrid and varietal rice cultivars for grain yield and milling quality. Crop Science. 49(6): 2011-2018. doi: 10.2135/cropsci2009.04.0175 Crossa, J. 1990. Statistical analyses of
multi-location trials. In N.C. Brady (Ed.), Advances in Agronomy. 44: 55-86. Cali-fornia: Academic Press.
perfor-mance trials. Crop Science. 42(2): 497-506. doi: 10.2135/cropsci2002.4970 Eberhart, S.A. and W.A. Russell. 1965. Stability
parameters for comparing varieties. Crop Science. 6(1): 36-40. doi:10.2135/ cropsci1966.0011183X000600010011x Finlay, K.W. and G.N. Wilkinson. 1963. The
analysis of adaptation in a plant-breeding programme. Australian Journal of Agri-cultural Research. 14(6): 742-754. doi: 10.1071/AR9630742
Gauch, H.G., Jr. and W. Zobel. 1996. AMMI analysis of yield trials. In: M.S. Kang and H.G. Gauch, Jr. (Eds.), Genotype by environment interaction. Boca Raton: CRC Press. p. 85-122. doi: 10.1201/9 781420049374.ch4
Hasan, M.J., M.U. Kulsum, M.S. Hossain, M.M. Billah and A. Ansari. 2011. Genotype-location interaction of indica rice using AMMI model. Bangladesh Journal of Plant Breeding and Genetics. 24(2): 09-18. doi: http://dx.doi.org/10.3329/bjpbg. v24i2.17001
Hernandez, M.V. and J. Crossa. 2000. The AMMI analysis and graphing the biplot. International Maize and Wheat Improvement Center. Mexico: CIMMYT Institutional Multimedia Publications Repository. pp. 39
Karimzadeh, R., M. Mohammadi, N. Sabaghnia, M.K. Shefazadeh and J. Pouralhossini. 2012. Univariate stability analysis methods for determining genotype × environment interaction of durum wheat grain yield. African Journal of Biotech-nology. 11(10): 2563-2573. doi: 10.5897/ AJB11.309
Kulsum, M.U., M.J. Hasan, Md.I. Hossain and N.Md.F. Rahman. 2014. Stability for BRRI developed promising hybrid rice
for yield and it’s related traits. Journal of Applied Science and Agriculture. 9(1): 56-62. Retrieved from: http://www.aen siweb.com/old/jasa/rjfh/2014/56-62.pdf Lin, C.S., M.R. Binns and L.P. Lefkovitch. 1986.
Stability analysis: Where do we stand?. Crop Science. 26(5): 894-900. doi: 10.
2135/cropsci1986.0011183X002600050 012x
Satoto, M.J. Mejaya, Y. Widyastuti and I.A. Rumanti. 2013. Yield Stability of New Hybrid Rice Varieties (in Indonesian). Jurnal Penelitian Pertanian Tanaman Pangan. 32(2): 67-73.
Satoto, Y. Widyastuti, I.A. Rumanti and T.W.U. Sudibyo. 2010. Yield stability and resistance to bacterial leaf blight and tungro of hybrid rice varieties Hipa 7 and Hipa 8 (in Indonesian). Jurnal Penelitian Pertanian Tanaman Pangan. 29(3): 129-135.
Sitaresmi, T., Nafisah, C. Gunarsih and A.A. Daradjat. 2012. Grain yield stability analysis of rice lines using parametric and non-parametric approach (in Indonesian). Jurnal Penelitian Pertanian Tanaman Pangan. 31(2): 79-86.
Sreedhar, S., T.D. Reddy and M.S. Ramesha. 2011. Genotype x environment inter-action and stability for yield and its components in hybrid rice cultivars (Oryza sativa L.). International Journal of Plant Breeding and Genetics. 5(3): 194-208. doi: 10.3923/ijpbg.2011.194.208 Tariku, S., T. Lakew, M. Bitew and M. Asfaw.
2013. Genotype by environment inter-action and grain yield stability analysis of rice (Oryza sativa L.) genotypes evaluated in north western Ethiopia. Net Journal of Agricultural Science. 1(1):10-16. Retrieved from: http://www.netjour nals.org/pdf/NJAS/2013/1/13-015.pdf Tiawari, D.K., P. Pandey, R.K. Singh, S.P. Singh
and S.B. Singh. 2011. Genotype x environment interaction and stability analysis in elite clones of sugarcane (Saccharum officinarum L.). International Journal of Plant Breeding and Genetics. 5(1): 93-98. doi: 10.3923/ijpbg .2011.93.98