R E S E A R C H
Open Access
Lifetime health effects and medical costs of
integrated stroke services - a non-randomized
controlled cluster-trial based life table approach
Stefan A Baeten
1,2,3, N Job A van Exel
2,3, Maaike Dirks
4, Marc A Koopmanschap
2,3, Diederik WJ Dippel
4,
Louis W Niessen
2,5,6*Abstract
Background:Economic evaluation of stroke services indicates that such services may lead to improved quality of life at affordable cost. The present study assesses lifetime health impact and cost consequences of stroke in an integrated service setting.
Methods:The EDISSE study is a prospective non-randomized controlled cluster trial that compared stroke services (n = 151 patients) to usual care (n = 187 patients). Health status and cost trial-data were entered in multi-dimensional stroke life-tables. The tables distinguish four levels of disability which are defined by the modified Rankin scale. Quality-of-life scores (EuroQoL-5D), transition and survival probabilities are based on concurrent Dutch follow-up studies. Outcomes are quality-adjusted life years lived and lifetime medical cost by disability category. An economic analysis compares outcomes from a successful stroke service to usual care, by bootstrapping individual costs and effects data from patients in each arm.
Results:Lifetime costs and QALYs after stroke depend on age-of-onset of first-ever stroke. Lifetime QALYs after stroke are 2.42 (90% CI - 0.49 - 2.75) for male patients in usual care and 2.75 (-0.61; 6.26) for females. Lifetime costs for men in the usual care setting are€39,335 (15,951; 79,837) and€42,944 (14,081; 95,944) for women. A
comparison with the stroke service results in an ICER of€11,685 saved per QALY gained (€14,211 and€7,745 for
men and women respectively). This stroke service is with 90% certainty cost-effective.
Conclusions:Our analysis shows the potential of large health benefits and cost savings of stroke services, taking a lifetime perspective, also in other European settings.
Background
In The Netherlands, as in most Western countries, stroke is a major contributor to the total burden of dis-ease, in terms of morbidity, mortality and concomitant costs. In 2007, incidence of primary stroke was 2.12 per 1,000 men and 2.23 per 1,000 women, prevalence of stroke was 11.89 per 1,000 men and 11.48 per 1,000 women, and mortality from stroke was 46.50 per 100,000 men and 69.84 per 100,000 women [1]. The incidence rates in the Netherlands have only fluctuated
around the same level since the early 1990 s. Yet, mor-tality has been steadily declining [1].
The burden of stroke in the Netherlands is compar-able to that in other Western countries [2]. As a result, in 2005 stroke was a top-5 disease in terms of costs, with a total of 1.5 billion Euros. This accounts for 2.2% of total health care costs in the Netherlands [3].
The total burden of disease from stroke is expected to increase. In 20 years, the prevalence of stroke in the Netherlands will be more than 40% higher as a result of aging of the population, continuing unhealthy lifestyles among elderly, and improved care for stroke patients leading to lower mortality [1]. Several studies investi-gated future trends in life expectancy and disability after stroke in the Netherlands. Struijs et al. [4], used a
* Correspondence: [email protected] 2
Erasmus University, Department of Health Policy and Management (iBMG), PO Box 1738, 3000 DR Rotterdam, The Netherlands
Full list of author information is available at the end of the article
dynamic single-state life-table combining demographic projections and existing stroke incidence and mortality data, and projected a 30% rise in life years lost between 2000 and 2020. Niessen et al. [5] estimated future stroke morbidity rates using a disability-based two-state transi-tion model combining populatransi-tion projectransi-tions and exist-ing data on stroke epidemiology. Their projections indicated that the aging of the population and the increase in cardiovascular survival would partially miti-gate the effect of the declining incidence on the total burden of stroke, leading to a further increase in major stroke prevalence among the oldest age groups.
An important contribution to increased survival rates after stroke is provided by better coordinated care, including rehabilitation and treatment of complications, through widespread implementation of stroke units, as recommended by the American Heart Association. Inte-grated stroke services are expected to enhance the early state effect of stroke unit treatment. We characterise integrated stroke services as formal arrangements and strict coordination between various providers of stroke care, with the aim to “provide the right care, to the right patient at the right time”. Stroke Services are multi-facetted and need different adaptations in different regional settings. It may be difficult to determine which aspects of stroke services lead to the reported better health outcomes [6-8]. Notable elements of stroke ser-vices are: protocolised care, early rehabilitation, preven-tion of early complicapreven-tions, early supported discharge and secondary prevention. Positive health effects have not only been reported for stroke services as a whole, but also for each of these elements separately [6-9].
Reports on stroke services are more ambiguous on changes in costs [10-14]. The services tend to be cost-effective on the short term compared to traditional care. The short horizon of these findings complicates the for-mulation of clear recommendations on stroke services. The risks of disability associated with stroke can be high and the chances of new cardiovascular events, stroke or other, are high. Longer survival and these negative health effects may be associated with considerable health care costs. It is unclear whether the positive health effects and potential cost savings will persist in the long run. Consequently, additional evidence on the relative cost-effectiveness of stroke services is needed for longer time horizons.
To our knowledge no long-term follow-up study has reported the cost-effectiveness of stroke services. Long-term results do exist for stroke unit care in the United Kingdom. Using a stratified Markov model Saka et al. showed that stroke unit care combined with early sup-ported discharge provided better health at acceptable costs up to ten years after stroke [15]. In addition, the Department of Health reported cost-effective results for
stroke units and early supported discharge, again with a ten year time horizon [16]. However, these results apply to early stage stroke services and do not incorporate continuity of care outside the hospital.
In summary, current evidence shows stroke services to be attractive, yet little is known about the effect of stroke service implementation on long-term mortality, disability and costs. The purpose of the present study is to examine the lifetime cost-effectiveness of stroke ser-vices as compared to conventional stroke care, using a life-table approach, differentiating four post-stroke dis-ability categories, assuming persisting health effects. This has required an increase of the disability categories applied in our earlier multi-dimensional life-table study, also used in the evaluation of stroke guidelines [5,17].
Methods
Selection of patients
The study used a selection of data from a recent empiri-cal cohort in the Netherlands, the EDISSE study (Eva-luation of Dutch Integrated Stroke Service Experiments) [14]. The trial was approved by all participating institu-tions’ethics committees which was documented in the trial registration (ISRCTN67636203). This prospective non-randomized controlled cluster trial assessed the cost-effectiveness of three stroke service experiments between 1999 and 2000 compared to conventional stroke care in the Netherlands. A stroke service was defined as an integration of a hospital stroke unit with nursing homes, rehabilitation centres, GP’s and home care providers to provide adequate services in all stages of the follow-up process [14].
The three trial regions represented the full variety of stroke service care in The Netherlands. Trial and con-trol regions were comparable in terms of case mix; their selection was based on similarity with national stroke statistics in terms of age, length of hospital stay, case-fatality, functional status at discharge, and destination after discharge. The research populations compare well to the demographic profile of the Netherlands. Trained nurses collected data from medical files in hospital and through follow-up patient/proxy interviews two and six months after stroke. Reliability and internal validity were guaranteed by reassessment of files by colleagues or neurologists.
Intervention contrast
organizations made formal mutual agreements about patient flows and continuity of care. Furthermore, home care nurses received additional training and a trans-mural stroke nurse was in charge of patient transfers. This was the only fully integrated stroke service as defined ex ante, and was the only one cost-effective in the first six months after stroke in the EDISSE trial, while the other did not comply to these criteria and showed indifferent results [14].
The control settings reflected the usual stroke care in The Netherlands at the time (e.g. concerning case load, length of stay and extent of illness). In some settings stroke units were already (being) developed at different care locations in the region, both in hospitals and in rehabilitation centres but not in nursing homes. How-ever, there were no implemented formal agreements between care providers or regular consultations between stroke care providers.
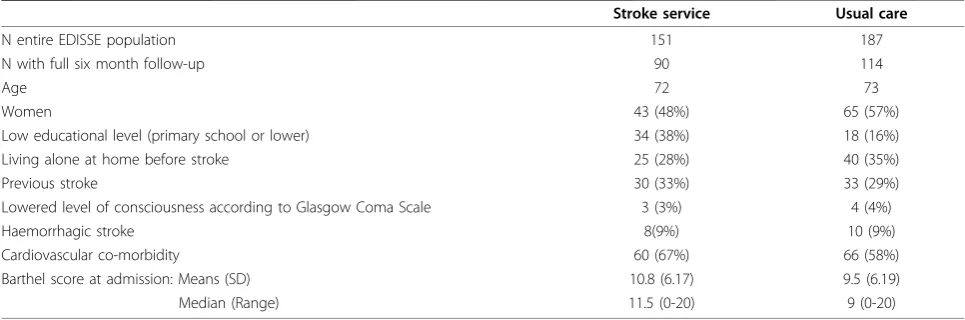
The care process in stroke services differs in many aspects from usual care. This makes the introduction of stroke service a complex intervention. The effects take place within a‘black box’and it will be difficult to iden-tify the effects of single aspect of the stroke service. Table 1 presents the characteristics of the EDISSE study population.
Disability-stratified stroke life-table
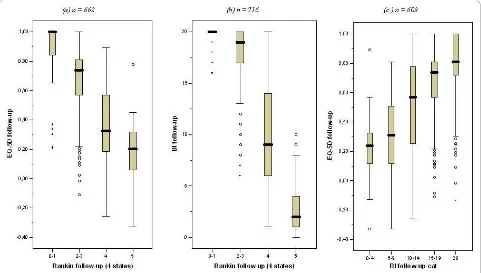
A life-table approach was applied to extrapolate the trial findings and to arrive at estimates of lifetime health bene-fits and costs per patient. A multidimensional Markov structure with four disability categories was adopted, based on the modified Rankin scale (mRS) [17]: category 1 (mRS 0-1); 2 (mRS 2-3); 3 (mRS 4) and 4 (mRS 5). Between these categories significant differences in quality of life exist (see figure 1a). These EQ-5 D ranges are mutually exclusive and show that the two additional dis-ability categories allow for better measurement of health
effects than in the original model. Like with EuroQoL-5 D scores, the mRS was not administered at baseline, and Barthel scores were used to classify patients into the four stroke disability categories at baseline (see Figure 1b): Barthel scores 20; 14-19; 5-13 and 0-4 were assigned to category 1, 2, 3 and 4 respectively. This mapping scheme resulted in the least misclassified patients after two and six months of follow-up.
In the multidimensional life-table, patients can move between disability categories depending on the outcomes of stroke recurrence and recovery (see Additional file 1). Patient flows between the four disability categories were based on various epidemiological estimates (see Table 2). Patients exit the life-table only when they die or reach the age of 100. We divided deaths into four categories, each with its own age-specific rates. Clearly, deaths occur because of the stroke itself either (i) immediately after stroke or (ii) from its complications in a later stage. Since stroke patients face higher probabilities of cardiovascular events other than stroke, we modelled (iii) deaths result-ing from other cardiovascular events separately. Finally, patients can leave the model because of any other, (iv) non-related cause of death. All death, incidence and recurrences rates are stroke severity specific and based either directly on original epidemiological data or are adjusted through a hazard ratio (see table 2). All transi-tions are assumed to take place at the end of each cycle of six months. In our life time perspective a half cycle correction is unnecessary as the effects hardly influence the life-time results. All parameters - i.e., the risk of recurrence, case-fatality rate of stroke, probability of disability after stroke, and the four probabilities of death -affect patients’courses in the same way as they did in the original life-table model [5]. The annual probability of a vascular event was assumed constant over time [18]. The life-table was written in Microsoft Excel, and had the following sequence of calculations: (i) transition
Table 1 Characteristics of the study population
Stroke service Usual care
N entire EDISSE population 151 187
N with full six month follow-up 90 114
Age 72 73
Women 43 (48%) 65 (57%)
Low educational level (primary school or lower) 34 (38%) 18 (16%)
Living alone at home before stroke 25 (28%) 40 (35%)
Previous stroke 30 (33%) 33 (29%)
Lowered level of consciousness according to Glasgow Coma Scale 3 (3%) 4 (4%)
Haemorrhagic stroke 8(9%) 10 (9%)
Cardiovascular co-morbidity 60 (67%) 66 (58%)
Barthel score at admission: Means (SD) 10.8 (6.17) 9.5 (6.19)
Figure 1Relation between EuroQol-5 D, Barthel Index, and modified Rankin Scale (mRS) (4 categories) classification during follow-up.
Table 2 Estimates for the disability-stratified stroke-simulation model
Parameter Unit Data source Value*
Epidemiological measure:
Age distribution incident strokes Rate Jager [34] 8.46
All cause mortality Rate Statistics Netherlands [35] 33.0
Stroke mortality Rate 1.9
Cardiovascular mortality Rate 8.4
Death from stroke Ratio Herman [36]/Bamford [37] 0.21
Recurrent after mRS 0-3 Relative risk Hoogen [38]/Dennis [39]/Dutch TIA Trial [40]
first year <75 years 0.09
>75 years
subsequent years 0.05
Late death from mRS 4-5 Ratio Howard [41,42] 0.15
Death from cardiac disease after mRS 0-3 stroke Relative risk Dutch TIA Trial[40]/Howard [41,42] 0.038
after mRS 4-5 stroke Relative risk Howard [41,42] 0.06
Utility weights for stroke disability categories - EDISSE data [14] 0-1
Disability after stroke (first-ever and recurrent) mRS 1-5
Hazard ratios:
Excess cardiovascular death mRS 0-1:mRS 2-3 Hazard ratio LiLAC study Group [18] 1.25†
mRS 4:mRS 5 Hazard ratio 1.25
Recurrent stroke mRS 0-1:mRS 2-3 Hazard ratio 1.34
mRS 4:mRS 5 Hazard ratio 1.34
Note: * number per 1,000 or probability for men aged 70-75.†
probabilities; (ii) number of patients in each disability category and all events (i.e., transitions); (iii) average survival time/life expectancy; (iv) quality-adjusted life expectancy after stroke, defined as the number of survi-val years multiplied with individual utility survi-values from the EDISSE trial.
Selection of outcome measures
The economic evaluation compares lifetime health effects and costs of the stroke service as compared to usual stroke care.
Health effects
Lifetime health effects were assessed as quality-adjusted life years (QALYs) after stroke, measured with the Euro-QoL-5 D [19]. Cost-effectiveness evaluations that take a societal perspective make use of general public valua-tions of these health states, available from Dutch research [20]. EuroQol-5 D scores were rescaled, using tariff scores, so that the maximum value of 1 represents perfect health and the value 0 represents death; some health states receive a value lower than 0, and are thus considered worse than death by the general public. The EuroQoL-5 D is short and simple enough so that most stroke survivors, despite disabilities, can complete it without help [19]. However, most are physically or men-tally not able to (self-) report quality of life in the acute phase after stroke. Therefore, no EuroQoL-5 D scores were available from the EDISSE study at baseline. As in a former study [14,21], scores on the Barthel Index (BI) [22] were used to estimate EuroQoL-5 D scores at base-line to ascertain that quality of life was measured at the acute phase, i.e. the first six months (see Figure 1c). Based on linear regression analysis, health-related qual-ity of life was -0.25 for patients with BI score 0, and increased by 0.05 with each additional BI point. Inde-pendent patients (BI score 20) get a health-related qual-ity of life equal to 0.75 [21].
Costs
Lifetime costs after stroke were restricted to direct med-ical costs (i.e., a health care perspective), and computed separately for the four disability categories (see below). This excludes productivity costs as the strokes occurred in elderly patients. We considered the impact on infor-mal care in this study elsewhere [14]. Costs of care for the first six months after stroke were based on patient level resource use from the EDISSE study [13], and resource costs/prices of 2003 [23]. Because length of stay at different locations was the most important cost driver during this period [13], first, inpatient costs were calculated using original length of stay data and 2003 nursing day prices. Subsequently, total individual costs of care during the first six months were computed by holding the original ratio between inpatient and total costs constant, for each patient and each place of
residence (hospital, nursing home, revalidation centre and home) at which the patient stayed during this per-iod, weighted by the length of stay. Costs of care for the second half year after stroke were based on place of residence data six months after stroke from the EDISSE study and 2003 resource costs/prices. Costs in subse-quent years were based on available data on the distri-bution of patients by residence location [24]. Therefore, after the first half year, costs are assumed not to differ between stroke service and usual care. In accordance with guidelines, differential discounting was applied with an annual rate of 1.5% for health effects an 4.0% for costs of care. This accounts for the increasing value of health over time. Equal discount rates for costs and health effects lead to sub-optimal societal results [25].
Cost-effectiveness analysis
The stroke service was compared to usual care by doing the same lifetime extrapolation for both groups, simulta-neously. Patient level data (i.e., level of initial stroke dis-ability, costs, and health effects) were entered in a probabilistic analysis, using a Microsoft Excel add-in: Palisade’s @Risk. The runs were executed by a bootstrap
from the stroke service data. In each iteration, a patient from the usual care data set was matched with the one selected from the intervention region, according to age and level of initial stroke disability. Stroke patient entered the life-table at age 60, 70 or 80, based on the known age distribution of first-ever stroke occurrence. The runs resulted in estimates of lifetime health out-comes (QALYs) and lifetime costs (Euros) in both arms.
Lifetime differences in costs and health effects were compared by means of an incremental cost-effectiveness ratio (ICER) of stroke service care as compared to usual care, i.e., the difference in costs between the two settings divided by the difference in effect. Incremental costs and health effects were plotted in a cost-effectiveness plane, and confidence intervals (5%, 50%, 90%) were computed around the central point using the life table in 10.000 iterations. Sensitivity analysis was conducted using 3% and 0% discounting rates for both costs and health effects.
Results
Lifetime costs and health effects
average. This confirms earlier findings on the reduced length of stay [13].
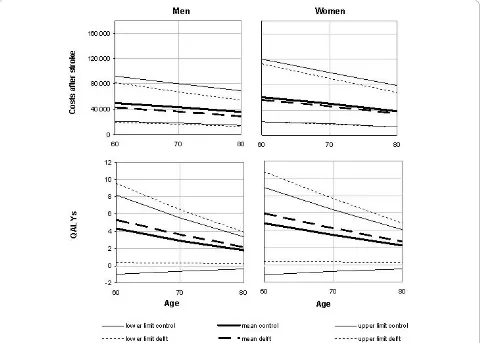
Life expectancy after stroke of patients in mRS cate-gories 0-1, 2-3, 4 and 5 was 5.94, 5.16, 3.87 and 3.64 for men, and 6.91, 5.94, 4.92, and 4.51 for women. Corre-sponding lifetime QALYs were estimated at 4.12, 3.00, 1.39, -.02 for men, and 4.80, 3.28, 1.69, -0.01 for women, respectively. Figure 2 shows that lifetime costs and quality-adjusted life expectancy decrease with age, both among men and women. Furthermore, the figure shows that stroke services likely are cost saving, while generating more QALYs. The lower costs in stroke ser-vices resulted from shorter mean length of stay in hospi-tal in the acute phase after stroke (13 vs. 29 days [13]), and the lower proportion of patients who were institu-tionalized one year after stroke (14% vs. 23%).
The overall life time costs for men were € 32,284 in the stroke service setting and € 39,335 in the control setting while the life time QALYs were 2.92 and 2.42 respectively. For women both costs (€ 38,443 in the stroke service and€ 42,944 in the usual care) while the life time QALYs were higher (3.33 and 2.75 years). Stan-dardized for gender the results for the stroke service were average costs of €35.361 and 3.12 QALYs and for the usual care setting €41,352 and 2.61 QALYs. So, in all three cases stroke services are associated with lower
costs and higher life time QALYs, i.e. stroke services dominate usual care.
Cost-effectiveness results
Figure 3 presents the reliability intervals for the lifetime cost-effectiveness of the stroke service as compared to usual care, with a central point representing a cost sav-ing of€ 5,990 and a QALY gain of 0.51. The point esti-mate for the ICER is €11,685 saved per QALY gained; €14,211 and €7,745 saved per QALY gained for men
and women respectively. The probability that the stroke service intervention is both effective and cost saving is over 90%. The ICER declines with age. In addition, Fig-ure 3 shows a negative correlation between health effects and costs as lower health care consumption and better health are associated.
Discounting both costs and health effects at a 3% rate lead to slightly lower ICERs of € 15,510 and € 8,423 saved per QALY gained for men and women, respec-tively. Discounting both at 0% lead to ICER estimates of € 14,144 and € 7,401 saved per QALY gained for men
and women, respectively. The results therefore showed robustness and consistency in all age specific outcomes: mean health effects were larger and mean costs were lower in the stroke service in all age groups, both gen-ders, and with all three ways of discounting.
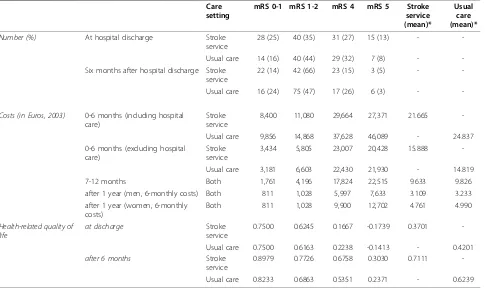
Table 3 Average costs and EuroQoL-5 D score by follow-up period, stroke disability, care setting and gender Care
setting
mRS 0-1 mRS 1-2 mRS 4 mRS 5 Stroke
service (mean)*
Usual care (mean)*
Number (%) At hospital discharge Stroke
service
28 (25) 40 (35) 31 (27) 15 (13) -
-Usual care 14 (16) 40 (44) 29 (32) 7 (8) -
-Six months after hospital discharge Stroke service
22 (14) 42 (66) 23 (15) 3 (5) -
-Usual care 16 (24) 75 (47) 17 (26) 6 (3) -
-Costs (in Euros, 2003) 0-6 months (including hospital care)
Stroke service
8,400 11,080 29,664 27,371 21.665
-Usual care 9,856 14,868 37,628 46,089 - 24.837
0-6 months (excluding hospital care)
Stroke service
3,434 5,805 23,007 20,428 15.888
-Usual care 3,181 6,603 22,430 21,930 - 14.819
7-12 months Both 1,761 4,196 17,824 22,515 9.633 9.826
after 1 year (men, 6-monthly costs) Both 811 1,028 5,997 7,633 3.109 3.233
after 1 year (women, 6-monthly costs)
Both 811 1,028 9,900 12,702 4.761 4.990
Health-related quality of life
at discharge Stroke
service
0.7500 0.6245 0.1667 -0.1739 0.3701
-Usual care 0.7500 0.6163 0.2238 -0.1413 - 0.4201
after 6 months Stroke
service
0.8979 0.7726 0.6758 0.3030 0.7111
-Usual care 0.8233 0.6863 0.5351 0.2371 - 0.6239
Discussion
Our analysis presented mRS-stratified lifetime costs and health effects after stroke and showed that stroke service interventions most likely will lead to health benefits and cost savings when considering lifetime outcomes. Our results imply that the beneficial short term effect of
stroke services is not offset by a long term costs of treatment and care because of longer survival.
The estimated health gain from stroke service imple-mentation is substantial (about half a QALY), especially as compared to the total number of QALYs usually lived after a stroke (on average 2.42 for men and 3.33 for women in usual care). The estimated lifetime cost savings of €5,776 (14%) from stroke service
implemen-tation are also substantial. Although we did not incorpo-rate start up and nationwide implementation costs, the figures compare very well to recent figures by Struijs et al. [4], who estimated that a nationwide implementa-tion of stroke services in the Netherlands would result in a 13% reduction of the costs of stroke as compared with a regular care scenario.
The lifetime cost-effectiveness of stroke service imple-mentation is comparable to the short-term (first 6 months after stroke) results presented by us in an earlier study using the same trial data [14]. While the“lifetime
ICER”was€11,685 saved per QALY gained, with a 90%
likelihood of the stroke service being cost saving. The
“short-term”ICER was€19,350 saved per QALY gained, Figure 2Lifetime costs (in Euros) and health-related quality of life after stroke; mean values (90% CI) by age and gender.
with an 80% likelihood of the stroke service being lower than€.35,000 per QALY gained. Our lifetime outcomes after stroke show less cost savings but do therefore pro-vide further support that stroke services are the organisa-tion of choice as compared to usual fragmented care.
Stroke unit reviews use other outcome measures than ICERs. The Cochrane library nor the HEED data base report reviews of stroke unit cost-effectiveness evalua-tions, but the reviews on their effectiveness is strong [26]. The results of other studies ranged from a reduc-tion of a relative risk of dependency for stroke patients of 9% [27], to a 28 week cost reduction of € 567 [11]. Two cost-effectiveness studies showed results ranging from 16,790€/QALY gained [28] in the Netherlands to 90,699€/QALY gained (64,097 £/QALY gained) [12] in the UK. The latter study [12] compared three alternative strategies but lacked a comparison with usual care.
We have made some critical choices in our evaluation. The EDISSE study included three experimental and three usual care settings. We analyzed data on all three usual care settings, but limited ourselves to the only real-life experiment that implemented a stroke service completely according to national guidelines [14]. So, our results are only valid for similar settings (a single hospi-tal with supporting follow-up services). Our results may therefore be optimistic and limit the options for wide implementation as there are many settings with more hospitals and a diversity of stroke rehabilitation services. We would have included the (negative) results from the other two settings only if the service model would have turned out similar.
Next, we have not included indirect cost. Earlier [13] we showed that there was an increase in home-based and ambulatory health care cost (through professional support and increased revalidation efforts). It might be that the service set-up leads to additional cost of infor-mal care and patients are discharged earlier. We cannot confirm that this is not happening. In other studies [29] it is explained that these cost are relatively low, also after valuation. It is our expectation that these would not alter the conclusion of our cost-effectiveness analy-sis, also when taking this societal perspective.
Some comments are to be made on the stroke model life tables. First, our model synthesizes data from differ-ent studies and settings (see Table 2), giving a popula-tion level estimates of the stroke burden. This approach is similar to two recent UK studies [15,16] with all three studies arriving at comparable conclusions (although the latter applies only a ten year time horizon). Data on mortality, hospitalization, and nursing home admission rates were available from existing studies. The hazard ratios for recurrent stroke and excess cardiovascular death, however, were only available for patients with a score on the mRS of 3 or lower. In the model, the same
hazard ratios were used to differentiate between mRS 4 and mRS 5 patients as between mRS 0-1 and mRS 2-3 patients. These assumptions do not influence the cost-effectiveness results.
Second, the classification of patients at baseline was based on the mapping of Barthel Index scores on Ran-kin scale categories, because the mRS is less reliable in the acute clinical phase after stroke. Although the corre-lation between the measures was large, the chosen pro-cedure may have led to some misclassification of patients, resulting in higher uncertainty in survival outcomes.
Third, the bootstrap conducted for each age group and gender was based on the same patients. Patients were not entered by age and gender due to sample size limitations, which means that it was assumed that the effect of stroke and stroke treatment is independent of age and gender [30]. While it is still unclear how the impact of a stroke on an individual’s quality of life varies by age [31,32], this does not mean that quality of survi-val is equal for different ages and gender, as assumed in the model. This is expected to have more effect on the lifetime outcomes differentiated per age and gender, than on total outcomes.
Finally, the results presented here were based on a life-table extrapolation of data originating from studies with sometimes short follow-up periods. For a more accurate estimate of the lifetime cost-effectiveness of stroke services, it would be necessary to conduct similar studies with a much longer follow-up. These do not exist (yet). Nonetheless, the disability stratified model presented here is the most comprehensive and detailed analysis currently available for estimating the lifetime health and costs after stroke for The Netherlands.
Summarizing, this study confirms previous findings that, from a health care perspective, effective coordina-tion between health care providers involved in the reha-bilitation of stroke patients, through integrated stroke services, may result in positive lifetime health effects at lower costs. Previous studies described the effects of interventions limited to early stage stroke units. Our study included the additional long-term health effect and organization effects associated with extra coordina-tion between different health care organizacoordina-tions opposed to coordination within a single organization.
in specialized hospital units is common in the Nether-lands. The intervention effect measured in this study, taking the Delft example, is very likely an underestima-tion of the potential much larger impact of stroke ser-vice introduction in countries without specialized hospital stroke care. In sum, although transferability of stroke services set-ups to different setting needs to be accounted for, both in health and economic terms, we do recommend implementation of stroke services in a wider array of country settings.
Additional material
Additional file 1: Life-table equations. Additional file 1 describes the generic equations used in the disease model for the calculation of the transition probabilities between disease states. It also describes the equation used to estimate the life-tables outcomes, i.e. average quality of life and average health care costs.
Acknowledgements
The Dutch Organization for Health Research and Development, The Hague (ZonMW) funded the EDISSE trial.
Author details
1Netherlands Institute for Health Sciences, PO Box 2040, 3000 CA Rotterdam,
The Netherlands.2Erasmus University, Department of Health Policy and
Management (iBMG), PO Box 1738, 3000 DR Rotterdam, The Netherlands.
3Erasmus University, Institute for Medical Technology Assessment (iMTA), PO
Box 1738, 3000 DR Rotterdam, The Netherlands.4Erasmus Medical Centre,
Department of Neurology, PO Box 2040, 3000 CA Rotterdam, The Netherlands.5School of Medicine, Health Policy and Practice, University of East Anglia, Norwich, UK.6Department of International Health, Johns Hopkins
School of Public Health, Baltimore, USA.
Authors’contributions
SB: Developed the model, performed the analysis and drafted the manuscript. JvE provided data and details on the EDISSE study and edited the draft manuscript. MD helped with the clinical aspects of the model and effectiveness results. MK assisted in the calculation of health care costs and provided details on the EDISSE study. DD participated in the study design and helped with the clinical interpretation of the model and its results. LN was responsible for the study design, coordination, model development and edited the drafted manuscript. All authors read and approved the final manuscript.
Competing interests
The authors declare that they have no competing interests.
Received: 11 September 2009 Accepted: 17 November 2010 Published: 17 November 2010
References
1. Bots ML, Poos MJC:Is the number of stroke patients increasing or decreasing.Volksgezondheid Toekomst Verkenning, Nationaal Kompas VolksgezondheidBilthoven: RIVM; 2006.
2. Thorvaldsen P, Asplund K, Kuulasmaa K, Rajakangas A-M, Schroll M:Stroke Incidence, Case Fatality, and Mortality in the WHO MONICA Project. Stroke1995,26:361-367.
3. Poos MJJC, Smit JM, Groen J, Kommer GJ, Slobbe LCJ:Kosten van ziekten in Nederland 2005: zorg voor euro’s.Bilthoven: RIVM;, 8 2008. 4. Struijs JN, van Genugten MLL, Evers SMAA, Ament AJH, Baan CA, van den
Bos GAM:Future costs of stroke in the Netherlands: The impact of stroke services.International Journal of Technology Assessment in Health Care2006, 22:518-524.
5. Niessen LW, Barendregt JJ, Bonneux L, Koudstaal PJ:Stroke trends in an aging population. The Technology Assessment Methods Project Team. Stroke1993,24:931-939.
6. Kalra L, Ratan R:Recent Advances in Stroke Rehabilitation 2006.Stroke 2007,38:235-237.
7. Langhorne P, Taylor G, Murray G, Dennis M, Anderson C, Bautz-Holter E, Dey P, Indredavik B, Mayo N, Power M,et al:Early supported discharge services for stroke patients: a meta-analysis of individual patients’data. The Lancet2005,365:501-506.
8. Norrving B, Adams RJ:Organized Stroke Care.Stroke2006,37:326-328. 9. Ovbiagele B, Saver JL, Fredieu A, Suzuki S, Selco S, Rajajee V, McNair N,
Razinia T, Kidwell CS:In-Hospital Initiation of Secondary Stroke Prevention Therapies Yields High Rates of Adherence at Follow-up. Stroke2004,35:2879-2883.
10. Kalra L, Evans A, Perez I, Knapp M, Donaldson N, Swift CG:Alternative strategies for stroke care: a prospective randomised controlled trial.The Lancet2000,356:894-899.
11. Moodie M, Cadilhac D, Pearce D, Mihalopoulos C, Carter R, Davis S, Donnan G, for the SSG:Economic Evaluation of Australian Stroke Services: A Prospective, Multicenter Study Comparing Dedicated Stroke Units With Other Care Modalities.Stroke2006,37:2790-2795.
12. Patel A, Knapp M, Perez I, Evans A, Kalra L:Alternative Strategies for Stroke Care: Cost-Effectiveness and Cost-Utility Analyses From a Prospective Randomized Controlled Trial.Stroke2004,35:196-203. 13. van Exel J, Koopmanschap M, van Wijngaarden J, Scholte op Reimer W:
Costs of stroke and stroke services: Determinants of patient costs and a comparison of costs of regular care and care organised in stroke services.Cost Effectiveness and Resource Allocation2003,1:2. 14. van Exel NJA, Koopmanschap MA, Scholte op Reimer W, Niessen LW,
Huijsman R:Cost-effectiveness of integrated stroke services.QJM2005, 98:415-425.
15. Saka O, Serra V, Samyshkin Y, McGuire A, Wolfe CCDA:Cost-Effectiveness of Stroke Unit Care Followed by Early Supported Discharge.Stroke2009, 40:24-29.
16. National Audit Office:Progress in improving stroke care.Edited by: Health DO. London: The Stationery Office; 2010.
17. van Swieten JC, Koudstaal PJ, Visser MC, Schouten HJ, van Gijn J: Interobserver agreement for the assessment of handicap in stroke patients.Stroke1988,19:604-607.
18. van Wijk I, Kappelle LJ, van Gijn J, Koudstaal PJ, Franke CL, Vermeulen M, Gorter JW, Algra A:Long-term survival and vascular event risk after transient ischaemic attack or minor ischaemic stroke: a cohort study.The Lancet2005,365:2098-2104.
19. Dorman PJ, Waddell F, Slattery J, Dennis M, Sandercock P:Is the EuroQol a Valid Measure of Health-Related Quality of Life After Stroke?Stroke1997, 28:1876-1882.
20. Lamers LM, Stalmeier PFM, McDonnell J, Krabbe PFM, Van
Busschbach JJG:Kwaliteit van leven meten in economische evaluaties: het Nederlands EQ-5D-tarief.Nederlands tijdschrift voor geneeskunde 2005,149:5.
21. van Exel NJA, Scholte op Reimer WJM, Koopmanschap MA:Assessment of post-stroke quality of life in cost-effectiveness studies: The usefulness of the Barthel Index and the EuroQoL-5D.Quality of Life Research2004, 13:427-433.
22. Mahoney FI, Barthel DW:Functional Evaluation: The Barthel Index.Md State Med J1965,14:61-65.
23. Oostenbrink JB, Koopmanschap MA, Rutten FFH:Standardisation of Costs: The Dutch Manual for Costing in Economic Evaluations.
PharmacoEconomics2002,20:443-454.
24. Scholte op Reimer W:Long-term care after stroke. Studies on care utilisation, quality of care and burden of care-giving.Universtity of Amsterdam, Faculty of Medicine; 1999.
25. Gravelle H, Brouwer W, Niessen L, Postma M, Rutten F:Discounting in economic evaluations: stepping forward towards optimal decision rules. Health Economics2007,16:307-317.
26. Stroke Unit Trialists Collaboration:Organised inpatient (stroke unit) care for stroke.Cochrane Database of Systematic ReviewsChichester, UK: John Wiley & Sons, Ltd; 2007.
28. Niessen LW, Dippel DW, Limburg M:[Calculation of costs of stroke, cost effectiveness of stroke units and secondary prevention in patients after
a stroke, as recommended by revised CBO practice guideline‘Stroke’].
Ned Tijdschr Geneeskd2000,144:1959-1964.
29. van den Berg B, Brouwer W, van Exel J, Koopmanschap M, van den
Bos GAM, Rutten F:Economic valuation of informal care: Lessons from
the application of the opportunity costs and proxy good methods.Social
Science & Medicine2006,62:835-845.
30. Kwa VIH, Limburg M, Haan RJ:The role of cognitive impairment in the
quality of life after ischaemic stroke.Journal of Neurology1996,
243:599-604.
31. Falconer JA, Naughton BJ, Strasser DC, Sinacore JM:Stroke inpatient
rehabilitation: A comparison across age groups.Journal of the American
Geriatrics Society1994,42:39-44.
32. Kalra L:Does age affect benefits of stroke unit rehabilitation?Stroke1994,
25:346-351.
33. Hack W, Kaste M, Bogousslavsky J, Brainin M, Chamorro A, Lees K, Leys D,
Kwiecinski H, Toni P, Langhorne P:European stroke initiative
recommendations for stroke management-update 2003.Cerebrovasc Dis
2003,16:311-337.
34. Jager-Geurst MH, Peters RJG, van Dis SJ, Bots ML:Hart-en vaatziekten in
Nederland, 2006: Cijfers over leefstijl-en risicofactoren, ziekte en sterfte. The Netherlands Heart Foundation; 2006.
35. Statistics Netherlands (CBS):Statline database.2010.
36. Herman B, Leyten AC, van Luijk JH, Frenken CW, Op de Coul AA,
Schulte BP:Epidemiology of stroke in Tilburg, the Netherlands. The
population-based stroke incidence register: 2. Incidence, initial clinical
picture and medical care, and three-week case fatality.Stroke1982,
13:629-634.
37. Bamford J, Sandercock P, Dennis M, Warlow C, Jones L, McPherson K,
Vessey M, Fowler G, Molyneux A, Hughes T:A prospective study of acute
cerebrovascular disease in the community: the Oxfordshire Community Stroke Project 1981-86. 1. Methodology, demography and incident cases
of first-ever stroke.Journal of Neurology, Neurosurgery & Psychiatry1988,
51:1373-1380.
38. Van den Hoogen HJM, Huygen FJA, Schellekens JWG, Straat JM, Van der
Velden HGM:Morbidity Figures from General Practices (1978-1982).
Nijmegen, University Department of General Practice1985.
39. Dennis MS, Bamford JM, Sandercock PA, Warlow CP:Incidence of transient
ischemic attacks in Oxfordshire, England.Stroke1989,20:333-339.
40. Dutch TIA Trial Study Group:A comparison of two doses of aspirin (30
mg vs. 283 mg a day) in patients after a transient ischemic attack or
minor ischemic stroke.N Engl J Med1991,325:1261-1266.
41. Howard G, Evans GW, Murros KE, Toole JF, Lefkowitz D, Truscott BL:Cause
specific mortality following cerebral infarction.Journal of Clinical
Epidemiology1989,42:45-51.
42. Howard G, Walker MD, Becker C, Coull B, Feibel J, McLeroy K, Toole JF,
Yatsu F:Community Hospital-based Stroke Programs: North Carolina,
Oregon, and New York. III. Factors influencing survival after stroke:
proportional hazards analysis of 4219 patients.Stroke1986,17:294-299.
doi:10.1186/1478-7547-8-21
Cite this article as:Baetenet al.:Lifetime health effects and medical costs of integrated stroke services - a non-randomized controlled cluster-trial based life table approach.Cost Effectiveness and Resource Allocation20108:21.
Submit your next manuscript to BioMed Central and take full advantage of:
• Convenient online submission
• Thorough peer review
• No space constraints or color figure charges
• Immediate publication on acceptance
• Inclusion in PubMed, CAS, Scopus and Google Scholar
• Research which is freely available for redistribution