i
USR INTERNATIONAL SEMINAR
ON FOOD SECURITY
"
Improving Food Security : The Challenges for Enhancing Resilience to
Climate Change
Emersia Hotel and Resort, Bandar Lampung,
Lampung, Indonesia
23 – 24 August 2016
Volume 1
Organized by
Research and Community Service Institution
University of Lampung – Republic of Indonesia,
Indonesian SEARCA Fellow Association,
SEARCA
ii
EDITORS
Christine Wulandari, Ph.D
Dr. Maria Viva Rini
Hari Kaskoyo, Ph.D
Hidayat Saputra, S.P.,M.Si
Windi Mardiqa Riani, S.Hut., M.Si
Aristoteles, S.Si., M.Si
Ade Pamungkas
REVIEWERS
Prof. Dr. Neti Yuliana
Prof. Dr. Bustanul Arifin
Prof. Dr. Kukuh Setiawan
Prof. Dr. Udin Hasanudin
Prof. Dr. Yusnita Said
Dr. Dwi Hapsoro
Endang Linirin Widiastuti, Ph.D
Dr. Siti Nurjanah
iii
Preface
COMMITTEE CHAIR
Recently, there are many discussions about food security as a complex issue of sustainable development. One of important topics is will the food needs in the future be met by the current production levels? In addition, the future production faces another sustainable development issues, one of which climate change that affects all four food security dimensions: food availability, food accessibility, food utilization and food systems stability. Improving food security, therefore whilst reconciling demands on the environment conditions which becoming the greatest challenges.
To response that challenges, The University of Lampung collaborated with ISFA (Indonesia SEARCA Fellow Association) and SEAMEO-SEARCA conduct an International Seminar on “Improving Food Security: The Challenges for Enhancing Resilience to Climate Change” in Bandar Lampung, Indonesia on August 23-24, 2016. There are 4 topics are offered as follows: (1.) Food Security and Food Production System, (2.) Food Security, Post Harvest Science and Technology, (3.) Food Security and Socio-Economic Environment Aspect and (4.) Ecological Perspectives on Food Security.
At this seminar, 111 research articles were submitted from 6 countries i.e. Indonesia, Lao, Malaysia, Myamar, Thailand, and Vietnam. The authors are researchers, practitioners included NGO, policy makers, academics as well as industrial professionals. The ultimate aim of this seminar is to deliver state-of-the-art analysis, inspiring visions and innovative methods arising from research in a wide range of disciplines. Through this activity, it is expected that research articles in all aspects related to food security can be documented, rapidly spread, communicated and discussed throughout the countries.
Thank you for your participation and looking forward to having productive discussion among participants.
Sincerely yours,
iv
Preface
The University of Lampung Rector
Many Asian countries face serious challenges on their food security due to changing consumption patterns including the demographics, declining of agriculture productivity, degradation of natural resources, rising input costs as well as cost for transportation of supply chains. All of these, need various trends anticipation of short to medium term, and this is clearly becomes efforts focused on mitigating towards the challenges. Together with SEAMEO-SEARCA and Indonesian Searca Fellows Association (ISFA), the University of Lampung (Unila) collaborated to conduct an international seminar with theme in “Improving Food Security: The Challenges for Enhancing Resilience to Climate Change” on 23-24 August 2016 in Emersia Hotel, Bandarlampung. From this international seminar, 111 research articles from six countries in Southeast Asia were compiled and expected to be used as a stepping stone for preparation of development strategies in Indonesia country or other Asian countries resolving the issues of Food Security.
This cooperation among Unila with ISFA and SEARCA in accordance with the Unila statement mission for Unila goals of 2005-2025, one of which Unila is able to build joint effort in many development aspects within various parties, including governments, publics, businesses, non-governmental organizations either national and overseas, with mutual benefit basis in sustainable frame for natural resources conservation in supporting Food Security. The other Unila goals related to the Food Security is the community welfare, in which Unila become the agent of changes and maintain the certainty and justice for the community benefits.
My very sincere appreciation to invited speakers and participants for their great contributions, to all advisory boards SEAMEO-SEARCA and Indonesian Searca Fellows Association (ISFA), reviewers, colleagues and staffs for putting remarkable efforts and their contribution to the organization of this seminar. Finally, I just hope that this seminar is able to inspire and deliver benefits to all participants, in which together we are able contribute to development of Food Security in our countries as well as to global.
We look forward to working with you and getting to know you in years ahead. Thank You.
Your sincerely,
v
Preface
vi
KEYNOTES SPEECH
Dr. Siti Nurbaya Bakar
(Minister of Environment and Forestry, Republic Indonesia)
KEYNOTES SPEAKERS
Dr. Ageng S. Herianto
, FAO Representative
Prof. Dr. Wickneswari Ratnam FASc,
Universiti Kebangsaan
Malaysia
Prof. Dr. Neti Yuliana
, the University of Lampung
Prof. Dr. Meine van Noordwijk
, Chief Scientist of World
Agroforestry Research Center (ICRAF)
Dr. Perci E. Sajise
(Former Director of SEAMEO-SEARCA)
Dr. Irdika Mansur,
Director of SEAMEO-BIOTROP
LIST OF CONTENTS
No Title and Author Page
1 EFFECT OF COMBINATIONS OF UREA, ZA, AND TSP ON THE GROWTH RATE AND EXTRACELLULAR POLYSACCHARIDE CONTENT OF Porphyridium sp.
1 - 8
Lutfi Kurniati Barokah, Sri Murwani and Rochmah Agustrina
2 LIQUID BIO-AMELIORANT AND REDUCTION OF INORGANIC
FERTILIZER TO IMPROVE SOIL QUALITY AND MAIZE YIELD
9 – 18
Burhanuddin Rasyid, Masyhur Syafiuddin and Muh. Ansar.
3 SOIL RESOURCE INFORMATION SYSTEM OF CAGAYAN VALLEY A
GUIDE FOR A SUSTAINABLE AGRICULTURAL PRODUCTION
SYSTEM
19 – 32
Artemio A. Martin Jr
4 VARIABILITY AND AGRONOMIC CHARACTERS OF ELITE LINES OF
SOYBEAN (Glycine max [L.]Merril) from a Cross of ‘Wilis’ x B3570
33 – 40
Nyimas Sa’diyah, Maimun Barmawi, Yepi Yusnia and Susan Desi Liana Sari
5 COMPARISON OF DIFFERENT MODELS IN ESTIMATING
STANDARD EVAPOTRANSPIRATION IN LAMPUNG PROVINCE, INDONESIA
41 – 55
Purba Sanjaya, Tumiar K Manik and Bustomi Rosadi
6 ENHANCED RESISTANCE OF TOMATO PLANTS TO Fusarium sp. BY
TREATING SEEDS WITH A 0.2 mT MAGNETIC FIELD
56 - 67
Rochmah Agustrina, Endang Nurcahyani, Eko Pramono, Ika Listiani and Eko Nastiti
7 MACROALGAE (Sargassum sp., Gracillaria sp.) AND TAURINE ON
DECREASE THE TOTAL CHOLESTEROL LEVEL OF
HYPERCHOLESTEROLEMIA MALE MICE(Mus musculus L.)
68 - 76
Icsni Poppy Resta, Sabrina Prihantika, Endang Linirin Widiastuti and Sri Murwani
8 THE EFFECT OF METAL IONS Fe AND Zn EXPOSED TO MAGNETIC
FIELD 0.2 mT ON THE PRODUCTION OF PROTEASE INBacillus sp.
77 - 83
Indah Selfiana, Sumardi and Rochmah Agustrina
9 GENETIC VARIABILITY AND HERITABILITY OF VEGETATIVE AND
GENERATIVE TRAITS OF DIFFERENT SORGHUM GENOTYPES
84 - 91
Kukuh Setiawan, Muhammad Kamal and Muhammad Syamsoel Hadi
10 RESILIENCE IN THE FACE OF CHANGING CLIMATE: THECASE OF
INDIGENOUS BAGOBO COMMUNITIES, DAVAO, MINDANAO, PHILIPPINES
92 - 106
11 MOSAIC DISEASE AND CHILLI PRODUCTION ON DIFFERENT ALTITUDES IN SOUTH SUMATRA, INDONESIA
107 - 116
Nurhayati Damiri, Mulawarman, Harman Hamidson and Supli E. Rahim
12 FARMERS’ LEVEL OF AWARENESS ABOUT POLICIES AFFECTING THE HIGHLANDS IN NORTHERN THAILAND
117 - 129
Alisa Sahahirun and Rowena Dt. Baconguis
13 CULTIVAR DEVELOPMENT OF CASSAVA AT THE UNIVERSITY OF
LAMPUNG INDONESIA
130 - 142
Setyo Dwi Utomo, Erwin Yuliadi, Sunyoto, Akari Edy, Yafizham, Daniel Simatupang, Ratna Suminar and Apri Hutapea
14 EVALUATION OF VEGETATIVE AND REPRODUCTIVE
CHARACTERS OF F2 GENERATION OF YARD LONG BEANS (Vigna
sinensis L.) FROM A CROSS BETWEEN A GREEN-SWEET POD AND
RED POD PARENTS
143 - 148
Rahmadyah Hamiranti, Puji Ayu Riani, Ardian, Nyimas Sa’diyah, Erwin Yuliadi and Setyo Dwi Utomo
15 FLOWER INDUCTION OF CASSAVA (Manihot esculenta Crantz)
THROUGH THE APPLICATION OF PACLOBUTRAZOL AND KNO3
149 - 158
Erwin Yuliadi and Ardian
16 AGRONOMIC CHARACTERISTICS OF SOME SORGHUM [Sorghum
bicolor (L.) MOENCH] GENOTYPES UNDER INTERCROPPING WITH
CASSAVA
159 - 171
Muhammad Syamsoel Hadi, Muhammad Kamal, F. X. Susilo and Erwin Yuliadi
17 ISOLATION AND CHARACTERIZATION OF INDIGENOUS
RHIZOSFER BACTERIA PRODUCING GIBBERELLIN ACID AND INDOLE ACETIC ACID FROM LOCAL SOYBEANS IN SOUTH SULAWESI
173 - 179
Asmiaty Sahur, Ambo Ala, Baharuddin Patanjengi and Elkawakib Syam'un
18 ESTIMATION OF METHANE (CH4) EMISSION BASED ON PADDY HARVEST AREA IN LAMPUNG PROVINCE, INDONESIA
180 - 192
Onnychrisna P. Pradana,Tumiar K. Manik and Warsono
19 FARM PERFORMANCE AND PROBLEM AREA OF COCOA
PLANTATION IN LAMPUNG PROVINCE, INDONESIA
193 - 205
Rusdi Evizal, Sumaryo, Nyimas Sa’diyah, Joko Prasetyo, Fembriarti Erry Prasmatiwi and Indah Nurmayasari
20 NATURAL RESOURCES AND ENVIRONMENTAL MANAGEMENT BY
PARTICIPATORY MODEL IN SUPPORTING FOOD SECURITY AND FAMILY INCOME AT DRY LAND FARMING SYSTEM IN SEMAU ISLAND
P. Soetedjo
21 THE VARIABILITY OF DUKU ACCESSIONS BASED ON THE
CHARACTERS OF MORPHOLOGY, PHYSIOLOGY AND ANATOMY IN MUSI RAWAS REGENCY
219 -229
Susilawati, Dwi Putro Priadi and Diah Nurul Utami
22 SUITABILITY OF LAND AREA FUNCTION TO THE EXISTING LAND
USE OF BLONGKENG SUB WATERSHED, JAVA, INDONESIA
230 - 235
Ambar Kusumandari
23 TOTAL PHENOLIC, ANTIOXIDANT ACTIVITY AND
PHYSICO-CHEMICAL PROPERTIES OF WAXY PIGMENTED AND NON-PIGMENTED RICE
236 - 244
Chay C., W.A. Hurtada E.I. Dizon, F.B. Elegado, C. Norng and L.C. Raymundo
24 THE POTENTIAL USE OF ULTRAVIOLET-VISIBLE SPECTROSCOPY
AND SOFT INDEPENDENT MODELLING OF CLASS ANALOGIES (SIMCA) FOR CLASSIFICATION OF INDONESIAN PALM CIVET COFFEE (KOPI LUWAK)
245 - 253
Diding Suhandy, Meinilwita Yulia, Sri Waluyo, Cicih Sugianti, Riri Iriani, Fipit Novi Handayani and Novi Apratiwi
25 DETECTION AND QUANTIFICATION OF ADULTERATION IN
LUWAK COFFEE THROUGH ULTRAVIOLET-VISIBLE
SPECTROSCOPY COMBINED WITH CHEMOMETRICS METHOD
254 - 261
Meinilwita Yulia, Diding Suhandy, Sri Waluyo and Cicih Sugianti
26 BIODIVERSITY OF BIRD SPECIES (CASE STUDY: IN KPHP GEDONG WANI DESA KARANG REJO KECAMATAN JATI AGUNG LAMPUNG SELATAN)
262 - 272
Bainah Sari Dewi, Sugeng P. Harianto, A.Basyir Firdaus, M.Saipurozi, Badia Roy Nababan, Dian Novayanti, Lina Nur Aminah, Anggun Gayanti Pratiwi and Fredy Rahmandani
27 FATTENING OF BEEF CATTLE WITH NO GRASS: “EFFECT OF DIETARY ENERGY TO PROTEIN RATIO ON BEEF CATTLE FATTENING”
273 - 277
Sunarso, Agus Setiadi, Marry Christiyanto and Limbang Kustiawan Nuswantoro
28 EFFECTS OF THIDIAZURON AND BENZYLADENINE ON
FORMATION OF SHOOTS AND EMBRYOGENIC NODULESIN BANANA (Musaspp.) TISSUE CULTURE
278 - 287
40
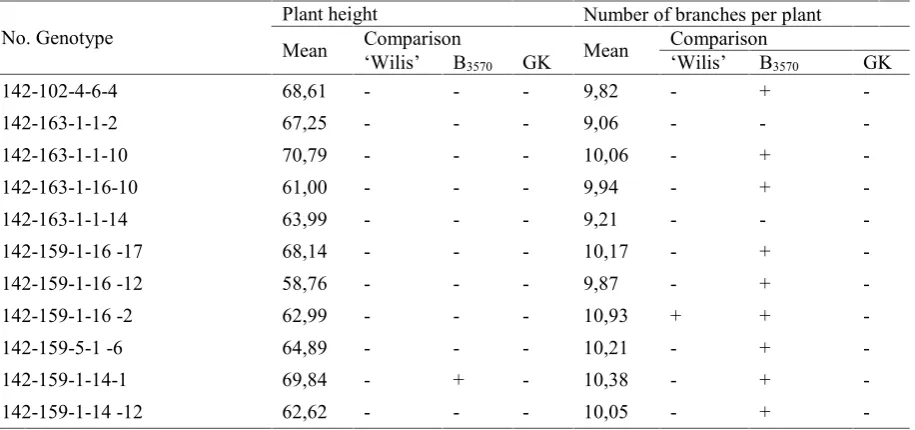
3. Mean values of variables plant height and number of branches per Plantwith comparative parents ‘Wilis’, B3570, and Gepak Kuning.
No. Genotype
Plant height Number of branches per plant Mean Comparison Mean Comparison
‘Wilis’ B3570 GK ‘Wilis’ B3570 GK
142-102-4-6-4 68,61 - - - 9,82 - +
-Tabel 4. Mean values of variables number ofpithy pods, the weight of seeds per plant, and 100 seeds weightwith comparative parents ‘Wilis’, B3570, and Gepak Kuning.
No. Genotype Number of pods pithy
The weight of seeds per
plant(g) 100 seeds weight(g)
Mean Comparison Mean Comparison Mean Comparison ‘Wilis’ B3570 GK ‘Wilis’ B3570 GK ‘Wilis’ B3570 GK
41 COMPARISON OF DIFFERENT MODELS IN ESTIMATING STANDARD
EVAPOTRANSPIRATION IN LAMPUNG PROVINCE, INDONESIA
PURBA SANJAYA, TUMIAR K MANIK AND BUSTOMI ROSADI
ABSTRACT
Evapotranspiration (ET) is the loss of water to the atmosphere by the combined
processes of evaporation from soil surfaces and transpiration from plants.Since various
factors affect ET, including weather parameters; numerousequations have been developed to
quantify standard ET. The equations vary in data requirements from very simple, empirically
based or simplified equations to complex, more physically based equations. This study used
six methods in estimating standard evapotranspiration using data from September
2011‒Agustus 2012from Climate Station at Masgar (05o10’20” S, 105o10’ 49”E, 50 m.a.s.l.)
Lampung, Indonesia. The six models are: Hargreaves-Samani 1985 (H/S), FAO 24Radiation
(24RD), FAO 24 Blaney-Criddle (24BC), FAO 24 Pan Evaporation (24PAN), Linacre
(Lina), andMakkink (Makk). The results were analyzed using statistics methods in error
indicators, which are: Root Mean Square Error(RMSE), Mean Absolute Error (MAE), and
LogaritmicRoot Mean Square Error(LOG RMSE), while the closeness among the models
was analyzed using Index Agreement (I.A.). Direct measurement had also been done with
measuring the water content inside lysimeters.The study concluded that Makkink model is
the suitable simple model that should be chosen in Lampung lowland area to calculate
ETowhen climate data is limited, besides the recommended FAO 56 Penman Monteith.
Keyword:Evapotranspiration, Standard Evapotranspiration, FAO 56 PM, Makkink Model
INTRODUCTION
Agriculture production in dry area is often limited by water availability. Two strategies
to solvethe limited water availability areadjustingcrops planting dateto rainfall distribution
and toirrigation schedule. Both strategies were based on crops water requirementestimated by
evapotranspiration.
Evapotranspiration (ET) is the loss of water to the atmosphere by the combined
processes of evaporation from soil and plant surfaces and transpiration from plants. Many
42
humidity,and wind speed; crop factors such as crop type, variety, density, and the stage of
growth; and management and environmentalconditions such as soil conditions, salinity,
fertility, crop disease, and pests (Allenet al. 1998). Therefore, an idea of reference (standar)
evapotranspiration was developed.
Estimation of the evapotranspiration has been done since Penman (1948) derived the
evapotranspiration formula based on the Dalton mass transfer equation and the energy
balance equation. The effort started with estimating the reference evapotranspiration (ET0)
Reference ET is defined as ‘‘the rate of evapotranspiration from an extensive area of 0.08–
0.15 m high, uniform, actively growing, green grass that completely shades the soil and is
provided with unlimited water and nutrients’’ (Allen,et al., 1994 in Bakhtiari et al., 2011).
More recently, Allen,et al. (1998) elaborated on the concept of ET0, referring to an ideal 0.12
m high crop with a fixed surface resistance of 70 s m-1 and an albedo of 0.23.The surface
condition should be met so that reference evapotranspiration only considered weather factors
that influenced evapotranspiration rate.
Numerousequations have been developed to quantify potential
evapotranspiration(PET). The equations vary in data requirements from very
simple,empirically based or simplified equations requiring only monthly average air
temperatures e.g., Thornthwaite (1948) and Blaney and Criddle (1950)andto complex, more
physically based equationsrequiring, daily data for air temperatures, solar radiation, wind
speed, and relative humidity e.g., FAO56-PM (Allenet al.,1998), as well as characteristics of
the canopy surface e.g., Penman-Monteith (Monteith, 1965).
Actual ET for a specificcrop is called crop evapotraspiration (ETc). Since water
availability is essential in agriculture production especially in dry areas, accurate and
consistent estimates of crop evapotranspiration(ETc) in agriculture activities are important.
The most common procedure for estimating ETc is to adjustthe reference evapotranspiration
(ET0) values with the crop coefficient (Kc); whichETc=ET0*Kc. The Kc represents the
integrated effectof changes in leaf area, plant height, irrigation method, rateof
cropdevelopment, crop planting date, leaf area, canopy resistance,albedo, soil,
climateconditions, and managementpractices (Doorenbos and Pruitt, 1977 in Irmak,et al.,
43
The first step to calculate crops coeficient is by estimating the reference
evapotranspiration. Reference evapotranspirationcan be measured directly by lysimeters;
however, establishing and maintaining lysimeters for a long time period is costly, make it
physically and economically impossible to measure evapotranspiration in every area of
interest. Also, for a given vegetation type, potential evapotranspiration is a climatic
parameter; so it can becomputed from weather data. Therefore, potential evapotranspiration
could be estimated by theoretical orempirical equations, or derived simply by multiplying
standardpan evaporation data by a coefficient.Equationsthat developed by Penman Monteith
is the one recommended by FAO. However, since this equation needs various climate data, it
is necessary to evaluate other available equations in case that the data is not available.
Lampung Province (103° 40’ – 105° 50’ E; and between: 6° 45’ – 3° 45’ S;35.288,35
km2) is located at Southeast tip of Sumatra. Lampung climate is characterized by monsoonal
rain distribution and local characteristics. Rain season in general is from October to March
with the peak on January/February and dry season is from April to September. Monthly
rainfall ranges from 50 – 200 mm and annual rainfall ranges from 1200 mm(lowland area) to
2500 mm (highland area). Lampung economic is dominated by agriculture products mainly
coffee, chocolate, rubber and sugarcane. Lampung is also considered as main area for cash
crops such as paddy, soybean and maize. Therefore, finding good and reliable method in
estimating crops water requirement is necessary for better agriculture management.
The objective of this research were to compare different methods in estimating standard
evapotranspiration for calculating crops evapotranspiration in Lampung area, Indonesia.
METHODS
This study used six methods in evaluating potentialevapotranspirationusing data from
September 2011 to Agustus 2012from Climate Station at Masgar (05°10’20” S, 105°10’
49”E, 50 m.a.s.l.) Lampung, Indonesia.The six models are: Hargreaves-Samani 1985 (H/S),
FAO 24 Radiation (24RD), FAO 24 Blaney-Criddle (24BC), FAO 24 Pan Evaporation
(24PAN), Linacre (Lina), andMakkink (Makk). The results from those models were
compared to FAO Penman-Monteith (56PM) as the standard model.To evaluate the relation
betweenmodels, the results were analyzed using statistics methods in error indicators, which
are: RootMean Square Error(RMSE), Mean Absolute Error(MAE), andLogaritmicRoot
44
Index Agreement(I.A.).Potential evapotranspiration was also observed in this study; using a
lysimeter (3x2x1 m),a certain grass (Sporabulusdiander) which is the same type as timothy
grass was planted on the common lysimeter. Since the lysimeter was maintained to have
adequate soil water content, the evapotranspiration was evaluated by measuring the
difference of soil water content every day. The measurements were done for 30 days using
sensors called Kett gypsum block.
DESCRIPTION OF MODELS
1. Hargreaves-Samani 1985 (H/S) (Hargreaves and Samani, 1985)
The equation of this model is:
(1)
WithETois standard evapotranspiration (mm/day), is daily mean temperature
(ᵒC), is maximum temperature(ᵒC), is minimum temperature, and
Dailyextraterrestrial radiationof the atmosfer (MJ/m2/day).
2. FAO 24Radiation(24RD) (Doorenbos and Pruitt, 1977)
The equation of this model is:
WithEToisstandard evapotranspiration (mm/day), ispan evaporation coefficient,
isClass A pan evaporation (mm/day), ismeanwind speed at 2m high (m/s), is
45
3. FAO 24 Blaney-Criddle (24BC) (Jensen,et al., 1990)
The equation for this model is:
...(5)
WithETo is standard evapotranspiration (mm/day), P is percentage of day length, T is daily
average temperature (˚C), RH is minimum relative humidity (%), n/N is ratio of possible
actual day, andUdis wind speed at 2 m (m/s)
4. FAO 24Pan Evaporation(24PAN)(Doorenbos and Pruitt, 1977)
The equation of this model is
ETois standard evapotranspiration (mm/day), is pan coefficient, is class A Pan
evaporation (mm/day), is average wind speedat 2m high (m/s), relative humidity
(%), and is distance between pan and green crops (m).
5. Linacre (LINA)(Linacre, 1977)
46
is standard evapotranspiration (mm/day) is mean temperature (ᵒC), is latitude of the
climate station (ᵒ), is elevation of climate station (m), and is average dew point
temperature (°C). equation is:
Tdis average dew point temperature (°C), is mean temperature (ᵒC), and is average daily
relative humidity (%).
6. Makkink (Makk) (Makkink, 1957).
The equation of this model is:
WhichRsis solar radiation (MJ/m2/day), ∆is vapor pressure curve (kPa/oC),andγis
psychrometricconstant (kPa/oC).
7. FAO 56 PM (56PM) (Allen,et al., 1998)
The equation of this model is
ET0 is standard evapotranspiration (mm/day), Rnis net radiation on crops surface
(MJ/m2/day),Giscontinuous heat flux to soil depth (MJ/m2/day),Tis dailytemperature(oC),U2is
wind speed at 2 m (m/s),esis vapor pressure (kPa),eais actual vapor pressure (kPa),∆ is vapor
pressure curve (kPa/oC),andγis psychrometric constant (kPa/oC).
In this study the ET0estimation fromFAO 56 Penman-Monteith model as the standard model
47
FAObased onFAO 56 Penman-Monteithmodel (Allen,et al., 1998). Climate Parameters are
needed by each model is presented in Table 1.
Indicators
The error indicators equation used to evaluate the model is:
With is Penman-Monteith standard evapotranspirationas the standard model, and is
others evapotranspirationmodels.
Table1. Climate parameters needed by each estimation model
No Model
Climate data needed by each model
Epan T Rs Rn RH P U2 Ra
1 56PM
2 24BC
48
4 Makk
5 24RD
6 24PAN
RESULTS AND DISCUSSIONS
The first error indicator (RMSE) is presented in Table2. Based on the comparison
among the six models, the error indicator RMSE ranged from 0.32-1.99 which means that
ET0difference among the models was 0.32 mm to 1.99 mm/day. This is not a small number
since 1 mm/day ET in 1 ha area is equivalent with water loss of 10,000 liter/day or 3.6
million liter/year.
Tabel.2. RMSE value among the estimating models of ET0
RMSE
56PM Makk 24BC 24PAN 24RD H/S LINA
56PM 0 0,34 1,30 0,75 0,69 1,35 0,88
Makk 0,34 0 1,61 0,48 0,49 1,52 1,12
24BC 1,30 1,61 0 1,99 1,92 1,12 0,79
24PAN 0,75 0,48 1,99 0 0,33 1,93 1,54
24RD 0,69 0,49 1,92 0,33 0 1,98 1,54
H/S 1,35 1,52 1,12 1,93 1,98 0 0,59
LINA 0,88 1,12 0,79 1,54 1,54 0,59 0
Using Lampung climate data, the lowest RMSE was found betweenFAO 24
RadiationandFAO 24 Pan Evaporationwhile the highest RMSE was found between model
FAO 24 Pan EvaporationandFAO 24 Blaney-Criddle. For Lampung, estimation ET model
with the closest estimation to FAO 56 Penman-Monteith is Makkink model with RMSE value
0.34.
The second error indicator (MAE) is presented in Table 3. Similar results with RMSE
were found in error indicators bothMAE and log RMSE (Table 4). Makkinkmodel was the
49
Table.3. MAEvalue among the estimating models of ET0
MAE
56PM Makk 24BC 24PAN 24RD H/S LINA
56PM 0 0,28 1,06 0,62 0,67 1,28 0,86
Makk 0,28 0 1,28 0,40 0,45 1,50 1,08
24BC 1,06 1,28 0 1,69 1,74 0,95 0,68
24PAN 0,62 0,40 1,69 0 0,25 1,90 1,48
24RD 0,67 0,45 1,74 0,25 0 1,95 1,53
H/S 1,28 1,50 0,95 1,90 1,95 0 0,47
LINA 0,86 1,08 0,68 1,48 1,53 0,47 0
Tabel.4.LOG RMSE among the estimating models of ET0
LOG RMSE
56PM Makk 24BC 24PAN 24RD H/S LINA
56PM 0 0,04 0,13 0,11 0,10 0,14 0,10
Makk 0,04 0 0,17 0,08 0,07 0,16 0,13
24BC 0,13 0,17 0 0,23 0,22 0,11 0,08
24PAN 0,11 0,08 0,23 0 0,06 0,23 0,20
24RD 0,10 0,07 0,22 0,06 0 0,23 0,19
H/S 0,14 0,16 0,11 0,23 0,23 0 0,06
LINA 0,10 0,13 0,08 0,20 0,19 0,06 0
MAE between FAO 56 Penman-Monteith and other modelsranges from 0.28 mm/day
(Makkink) to 1.28 mm/day (Hargreaves-Samani 1985) and LOG RMSE ranges from 0.04
50
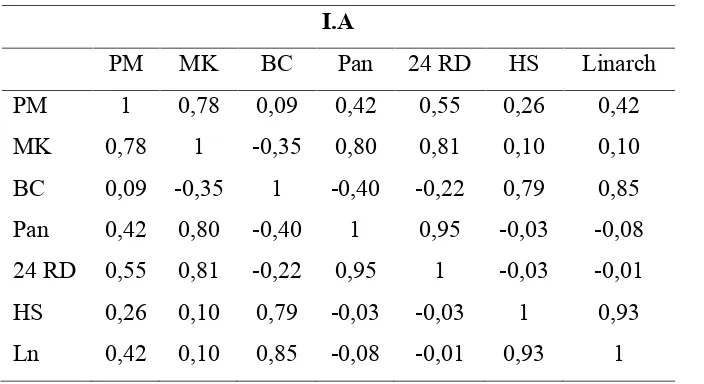
Table 5 shows the results of Index of Agreement (I.A.). Consistently, Makkink model
gave the best results with I.A. 0.77 followed by Linarch (0.42) and FAO Pan evaporation
(0.42)
Tabel.5.Index of Agreement among the models
I.A
PM MK BC Pan 24 RD HS Linarch
PM 1 0,78 0,09 0,42 0,55 0,26 0,42
MK 0,78 1 -0,35 0,80 0,81 0,10 0,10
BC 0,09 -0,35 1 -0,40 -0,22 0,79 0,85
Pan 0,42 0,80 -0,40 1 0,95 -0,03 -0,08
24 RD 0,55 0,81 -0,22 0,95 1 -0,03 -0,01
HS 0,26 0,10 0,79 -0,03 -0,03 1 0,93
Ln 0,42 0,10 0,85 -0,08 -0,01 0,93 1
From those results, it can be concluded that Makkink model is the suitable simple
model that should be chosen in Lampung to calculate ETo besides the recommended one
FAO 56 Penman Monteith, especially when the climate data is limited.
So far the estimating model that broadly used is FAO 24 PAN which is based on
observation on class A evaporation pan. This model did not give a good estimation compared
to the FAO 56 PM model (RMSE 0.75; MAE 0.62; Log RMSE 0.11 and I.A. 0.42). In
comparing 24 PAN model to 56PM, using 3 years data in 2 stations in Lampung,
Maniket.al.(2012) found that the coefficient correlation between those two models are low
(r=0.3 for Branti Station and 0.5 for Masgar station).
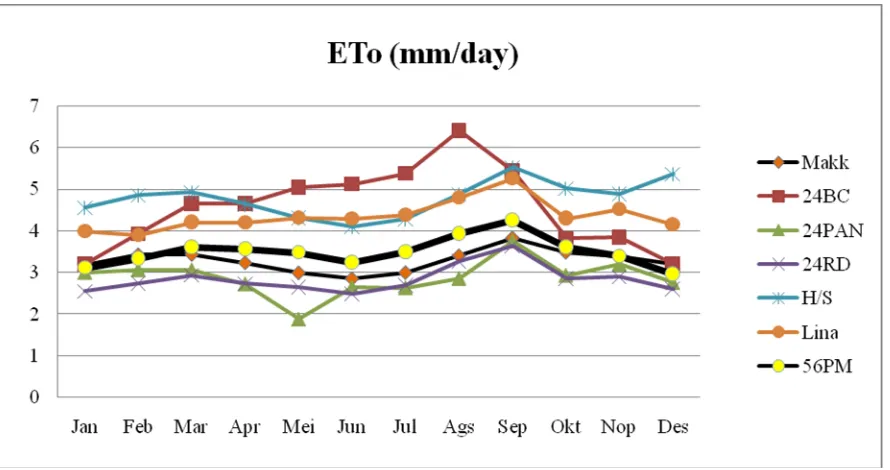
Monthly average ET0 results from each model in 1 year is presented in Figure 1. Most
of the models had the similar trends with FAO 56 PM but with different closeness. Some
models underestimated FAO 56 PM (Makk, FAO 24 RD and FAO 24 PAN) while some
51
56 PM in month of January-March, October -December) and a little underestimated in
March – October (dry season).
Figure 1. Monthly average of EToresults from each model in 1 year
Research about comparing different models has been done in some countries. Chen et
al(2005) used 7 estimating models in four provinces of Taiwan and found that Makkink and
Hargreaves-Samani models were the best models in estimating ETo when compared to FAO
56 PM. Chowhury,et al (2010) also found that in India, Makkinkmodel had the closest
estimation to FAO 56 PM with a little underestimated result.
Makkink model (equation no. 13) is the simplest model among others in this study, the
model is calculated use only two basic data, maximum and minimum temperature data.
52
Which Rs is solar radiation (MJ/m2/day), ∆ is vapor pressure curve (kPa/oC), and Ra is
daily extraterrestrial radiation of the atmosfer (MJ/m2/day) from FAO Irrigation and drainage
paper 56meteorological data table (Allen,et al., 1998).
Xu and Chen (2005) did similar study in Germany with comparing 7 models and found
that Granger-Gray and Makkink models were the best models for the area. In North China
Schneider,et al. (2007) compared 4 models with direct observation and concluded that
Hargreaves-Samani and Makkink models were the best models in estimating EToeven better
than FAO 56 PM.
Jacobs,etal (2004) conducted research on estimating ET0 in Florida, using remote
sensing method with data from GOES. The results showed that FAO 56 PM is the best
model with R2= 0.92 however this result is not much different with estimated results from
Makkink model which gave R2= 0.90.
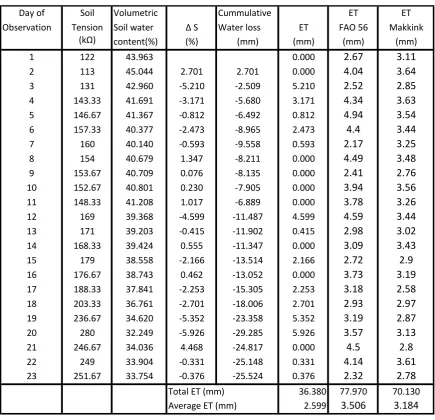
The results for direct measurement inside lysimeters(Table 6.) show that
evapotranspiration rate predicted by models were higher than measured by gypsum block.
Potential evapotranspiration calculated by models show the atmosphere power in evaporating
water on soil surface; the rate should be higher since in Tropical area because the radiation is
intense and air temperature generally high. Soil moisture reflects the balance of precipitation,
runoff, ET and exhibited various types of pulse events (Wang,et al., 2012). Because of soil
water movement, on soil surface water availability could be limited even when it kept being
watered because the water percolates to the deeper level but it also could be moist even when
no water added to it since water could be moves up to the surface . When atmosphere power
to evaporate water is higher than soil moisture, it could be concluded that during the
53
Table 6. Actual Evapotranspiration observed by soil water content method and compared to
potential evapotranspiration by FAO 56 and Makkink models
Day of Soil Volumetric Cummulative ET ET
Observation Tension Soil water Δ S Water loss ET FAO 56 Makkink
(kΩ) content(%) (%) (mm) (mm) (mm) (mm)
1 122 43.963 0.000 2.67 3.11
2 113 45.044 2.701 2.701 0.000 4.04 3.64
3 131 42.960 -5.210 -2.509 5.210 2.52 2.85
4 143.33 41.691 -3.171 -5.680 3.171 4.34 3.63
5 146.67 41.367 -0.812 -6.492 0.812 4.94 3.54
6 157.33 40.377 -2.473 -8.965 2.473 4.4 3.44
7 160 40.140 -0.593 -9.558 0.593 2.17 3.25
8 154 40.679 1.347 -8.211 0.000 4.49 3.48
9 153.67 40.709 0.076 -8.135 0.000 2.41 2.76
10 152.67 40.801 0.230 -7.905 0.000 3.94 3.56
11 148.33 41.208 1.017 -6.889 0.000 3.78 3.26
12 169 39.368 -4.599 -11.487 4.599 4.59 3.44
13 171 39.203 -0.415 -11.902 0.415 2.98 3.02
14 168.33 39.424 0.555 -11.347 0.000 3.09 3.43
15 179 38.558 -2.166 -13.514 2.166 2.72 2.9
16 176.67 38.743 0.462 -13.052 0.000 3.73 3.19
17 188.33 37.841 -2.253 -15.305 2.253 3.18 2.58
18 203.33 36.761 -2.701 -18.006 2.701 2.93 2.97
19 236.67 34.620 -5.352 -23.358 5.352 3.19 2.87
20 280 32.249 -5.926 -29.285 5.926 3.57 3.13
21 246.67 34.036 4.468 -24.817 0.000 4.5 2.8
22 249 33.904 -0.331 -25.148 0.331 4.14 3.61
23 251.67 33.754 -0.376 -25.524 0.376 2.32 2.78
36.380 77.970 70.130
Average ET (mm) 2.599 3.506 3.184
Total ET (mm)
This study concluded that Makkink model is a simple model that can be chosen in
Lampung as an alternative to calculate standard evapotranspiration in an area with limited
climate data needed to apply FAO 56 PM. During the study, water availability on soil surface
54
REFERENCES
Allen, R. G., Pereira, L. S., Raes, D., and Smith, M. 1998. “Crop Evapotranspiration:
Guidelines For Computing Crop Requirements.” Irrigation and Drainage Paper No. 56, FAO, Rome, Italy.
Bakhtiari, B., Ghahreman, N., Liaghat, A. M. and Hoogenboom G. 2011. Evaluation of Reference Evapotranspiration Models for a Semiarid Environment Using Lysimeter Measurements. J. Agr. Sci. Tech. 13: 223-237.
Blaney, H.F., and W.D. Criddle. 1950. Determining water requirements in irrigated areas from climatological and irrigation data. Soil Conservation Service Technical Paper 96. Soil Conservation Service, U.S. Dept. of Agriculture: Washington, D.C.
Chen, J.F., H.F. Yeh, C.H. Lee and W.C. Lee and W.C. Lo. 2005. Optimal Comparison of Empirical Equations for Estimating Potential Evapotranspiration in Taiwan. XXXI IAHR Congress. 3867-3697 p.
Chowhury, S., M.K. Nanda, S. Madan and G. Saha. 2010. Studies on Yield Limiting
Meteorological factors for Production of Rabi Pigeon Pea in West Bengal. Journal of Agrometeorology 12 (1):64-68.
Doorenbos, J., and Pruitt, W. O. (1977). "Guidelines for predicting crop water requirements."
Irrig. and Drain. Paper 24,Food and Agriculture Organization of the United Nations
(FAO), Rome, Italy.
Hargreaves, G.H, and Z.A. Samani. 1985. Reference crop evapotranspiration from
temperature. Applied Engineering in Agriculture. 1(2):96–99.
Irmak, S., J.O.Payero, D.L.Martin. 2006. Using modeifiedatmometers for irrigation
management. Irrigation engineering, Irrigation operation, and management. University of Nebrasca-Lincoln and United States Departement of Agriculture. USA.
Jacobs, J.M., M.C. Anderson, L.C. Friess and G.R. Diak. 2004. Solar Radiation Long Wave Radiation and Emergent Wetland Evapotranspiration Estimates from Satellite Data in Florida. Hydrological Sciences 49(3): 461-476.
Jensen, M.E., R.D. Burman, and R.G. Allen. 1990. Evapotranspirationand irrigation water requirements. ASCE manuals and reports onengineering practices No. 70. ASCE. New York.
Linacre, E.T. 1977. A simple formula for estimating evaporation rates in various climates, using temperature data alone. Agricultural Meteorology. 18(6):409–424.
55
Manik, T.K., R.A.B. Rosadi and A. Karyanto. 2012. Evaluasi Metode Penman Monteith Dalam Menduga Laju Evapotranspirasi Standar di Dataran Rendah Propinsi Lampung Indonesia. Jurnal Keteknikan Pertanian 26(2): 121-128.
Monteith, J.L. 1965. Evaporation and Environment. 19th Symposia of the Society for Experimental Biology, 19:205-234. University Press: Cambridge.
Penman, H.L. 1948.Natural evaporation from open water, bare soil, and grass. Proceedings
of the Royal Society of London A193:120-146.
Schneider, K., B. Ketzer, L. Breuer, K.B. Vach’e, C. Bernhofer and H.G. Frede. 2007. Evaluation of Evapotranspiration Methods for Model Evaluation in a Semi-arid Watershed in Northern China. Adv. Geosci (11): 37-42.
Thornthwaite, C.W. 1948. An approach towards a rational classification of climate. Geographical Review 38:55-94.
Wang, S., Fu, B. J., Gao, G. Y., Yao, X. L., and Zhou J. 2012. Soil moisture and evapotranspiration of different land cover types inthe Loess Plateau, China. Hydrol. Earth Syst. Sci., 16: 2883–2892.
Xu, C.-Y. and Chen, D. 2005.Comparison of seven models for estimation of