Vol. 9 No. 1, p 40 - 48 ISSN: 1412-0070
*corresponding author: www.unklab.ac.id
Performance of the Regional Development Banks in Indonesia: An
Application of Camel and Anova Test
Marthen Sengkey* Fakultas Ekonomi Universitas Klabat
The study employs CAMEL model to investigate the performance of 26 state banks in Indonesia from 1994 to 2004. CAMEL results indicate that there are two (2) banks (BPDCJ and BPDWK) that do not have a good financial performance, not even one of the CAMEL ratios. In terms of assets quality ratios, there are 17 banks that have shown a good financial performance, 11 banks in terms of management quality ratio, 13 banks in terms of earning ratios, and nine (9) banks in terms of liquidity ratio. Moreover, the result shows that a bank with the best financial performance in one ratio does not automatically have a good financial performance with other ratios Furthermore, ANOVA test shows that there is no significant difference at acceptance level of 0.01, 0.05 and 0.10 among CAMEL ratios of all sample banks. This further suggests that all banks have shown statistically the same level of financial performance as evident in their CAMEL indicators. The result of the ANOVA – test is consistent with the theory that any single ratio does not provide a sufficient information from which to judge the overall performance of a firm (Gitman, 2000).
Key words: regional development banks, financial performance, camel model
INTRODUCTION
Baruch, 1974, stated that since the late 1800s, ratio analysis has been the major tool used in the interpretation and evaluation of financial statements for breakdown of the examined financial reports into component parts, which are then evaluated in relation to each other and to exogenous standards. Ratio analysis involves methods of calculating and interpreting financial ratios to assess the firm's performance (Gitman, 2000). The basic inputs to ratio analysis are the firm's income statement and the balance sheet. Ratio analysis of the firm's financial statement is of interest to shareholders, creditors and the firm's own management. Both present and prospective stakeholders are interested in the bank's current and future level of risk and return, which directly affect the rating of the bank. Capital, assets quality, management, earnings, and liquidity (CAMEL) was used to measure the bank's financial performance. CAMEL has been used by the Federal Deposit Insurance Corporation (FDIC) and regulators of financial institutions worldwide. This is a traditional performance measure but still very useful for the purposes of this present study. Capital to assets ratio, equity to total loans are the ratios to represent the C. Total loans to total assets, non performing loan to total loans represent the A. Operating expenses to total assets represent M. Return on asset (ROA) and return on equity (ROE) represent E. Cash placement with central bank and other banks to total deposits and borrowing ratio represent L. All these variables are defined the CAMEL model in this study.
Overview of the Banking System in Indonesia. Indonesia's financial system stability
relies heavily on the banking industry, covering of about 90 percent of total asset of the country's financial system. Indonesia's banking system is dominated by 13 large banks, including ten (10) recapitalization banks, which represent 74.8 percent of the total assets of banking industry. Therefore, ensuring the soundness of these large banks is the key in maintaining stability of banking system and financial system (BI 2002). Before the 1997 crisis, Indonesia evolved into five stages: (1) the rehabilitation period (1967-1973) to restore the economy from high inflation; (2) the ceiling period (1974-1983) where interest rates ceiling were applied; (3) the growth period (1983-1988) following banking deregulation of June 1983 removed the interest rate ceiling; (4) the acceleration period (1988-1991) following the impact of extensive bank reforms in October 1988; and (5) the consolidation (1991-1997) in which prudential banking principles were introduced including capital adequacy and bank ratings (Batunanggar, 2002).
After the 1997 crisis, on November 16, 1997, the bank authority of Indonesia liquidated 16 private banks as the 1st round closures. In April 1998, ten (10) private banks were frozen (BBO) for the 2nd round closures. For the 3rd round closures on March 13, 1999, 38 private banks were frozen. Other strategies made by the bank authority are bank take over and recapitalization. On April 4, 1998, seven (7) private banks had taken over (BTO) and on May 29, 1998, one (1) private bank had taken over for the 1st round of take over. For the 2nd and 3rd rounds of take over on March 13 and April 4, 1998, respectively, seven (7) private banks and two (2) private banks had been taken over.
April 21, 1999 and March 2000 for the 1st and the 4th rounds, where seven (7) and three (3) banks had been recapitalized, respectively. There were 12 regional development banks and four (4) state banks that had been recapitalized (BI, 2000). During the resolution of banking crisis, there are 12 out of 26 regional development banks that received injection of capital from the bank's authority. Fourteen (14) banks grouped in A category with CAR greater than 4 percent, eight (8) banks grouped in B category with CAR greater than negative twenty five percent but less then four percent (-25% <CAR< 4%), and the rest four (4) banks be categorized in level C with CAR less than -25 percent (BI, 2002).Regional Development Bank (BPD) was established based on the Law No. 13, 1962, which stipulated the establishment of regional development bank in each province in Indonesia, serving as an intermediator to the investors in that area.
METHODOLOGY
CAMEL Model. To evaluate the bank's industry performance, traditional approach was often used. The financial ratios were taken from the balance sheet and income statements. The financial ratios are useful to test and measure the profitability and operational efficiency of the bank. In this study, CAMEL was used to evaluate the liquidity, profitability, and efficiency of Indonesia's regional development banks over the period 1994 to 2004. The detailed criteria of financial variables or CAMEL are described below: Capital Adequacy. This criterion is measured by the ratio of equity capital to total loans (CAPITAL). Barr and Siems (1994) also used total loans instead of total assets to measure the capital adequacy ratio. This is because loans of finance companies are assets with the highest potential of unanticipated losses, and an adequate level of capital must be maintained to absorb these unanticipated losses.
Asset Quality. Loan to total assets was used by Hooks (1995); and Hwang and Lee (1997). Non-performing loan to total loans was used by Gonzalez-Hermosillo et al (1997). These ratios are used to measure the risk assets of the bank. In this study, higher ratio means higher risk to the bank. Management Quality. This ratio represents the operating efficiency of the management and was also used by Gonzalez-Hermosillo et al (1997). In this study, the ratio is used to measure how competence the management for controlling the operating expenses to the total assets of the bank. If the ratio is higher, the performance of the management is poorer. Earnings Ability. Return on assets and return on equity are widely used as a measure of profitability (Tam and Kiang, 1992; Barr and Siems, 1994; Hwang and Lee, 1997); Gonzalez-development banks. This ratio was used by Tam and Kiang (1992); Gonzalez-Hermosillo et al, (1997) to predict bank failure, using DEA to quantify management quality. They used the following variables: cash government securities investment, total borrowing and deposits. In this study the ratio used to measure the ability of the bank to cover the bad debt account of the bank if the borrower or debtor failed to repay their obligation to the bank. The higher the ratio is good for the bank. ANOVA- Test. ANOVA test was addressed to compare the financial performance of Indonesia's regional development banks whether there are significant differences in their financial performance. Jaccard (1998) stated that, factorial analysis of variance (ANOVA) is widely used in the social science. It is commonly recognized that one of the advantages of a factorial design is that it permits the researcher to analyze interaction effects between independent variables relative to the dependent variable (s). Like regression, ANOVA is a parametric procedure
which assumes multivariate normality (the
dependent has a normal distribution for each value category of the independent(s).
The model of ANOVA test is as follows:
(1)
where: F = test statistic; MSB = mean square error between the alternatives or groups; MSW = mean square error among the model results for the same alternative or within the group.
∑ ( ̅)
(2)
where: ni = number of model runs with different random number seeds for alternative i; xi = mean value for alternative i; ̅= mean value averaged across all alternatives and runs; g = number of alternatives or groups and
∑ ( ) alternatives; g = number of alternatives.
all the regional development banks, owned by 26 provinces in Indonesia. The time period from 1994 to 2004 was selected based on the availability and completeness of the data for the audited financial reports. Regional development banks are chosen because during the resolution of banking crisis, there are 12 regional development banks, which are recapitalized by bank authority. None of these banks is liquidated or taken over, though, some of these
banks have CAR less than CAR of bank, which are liquidated and taken over. For example, a Regional Development Bank has CAR of -23.1 percent has not liquidated or taken over, compared with to the liquidated and taken over banks, which have CAR of A 0.9 percent and -15.6 percent, respectively. The number of Indonesia's regional development banks is shown in Table 1. below:
Table 1. Regional Development Banks
Name of Bank Classification ABC Code
BPD, Aceh(NAD) C BPDNAD
BPD, North Sumatera A BPDNS
BPD, Bengkulu C BPDBE
BPD, Lampung B BPDL
BPD, DKI Jakarta A BPDDKI
BPD, Central Java B BPDCJ
BPD, East Java C BPDEJ
BPD, West Kalimantan A BPDWK
l3PD, North Sulawesi A BPDNSU
BPD, Maluku A
BPD, West Nusa Tenggara B BPDWNT
BPD, West Surnatera C BPDWS
BPD, South Surnatera A BPDSS
BPD, Jambi A BPDJ
BPD, Pekanbaru-Riau A BPDR
BPD, West Java B BPDWJ
BPD, DIY A BPDDIY
BPD, Bali B BPDBa
BPD, South Kalimantan A BPDSK
BPD, Central Kalimantan B BPDSK
BPD, East Kalimantan A BPDSK
BPD, South Sulawesi A BPDSSU
BPD, Central Sulawesi A BPDCSU
BPD, South Sulawesi A BPDSESU
BPD, Papua A BPDP
A has a CAR more than 4% at time of disclosure;
B has a CAR less than 4% but greater than -25% at the time of disclosure C has a CAR less than-25% at the time of disclosure
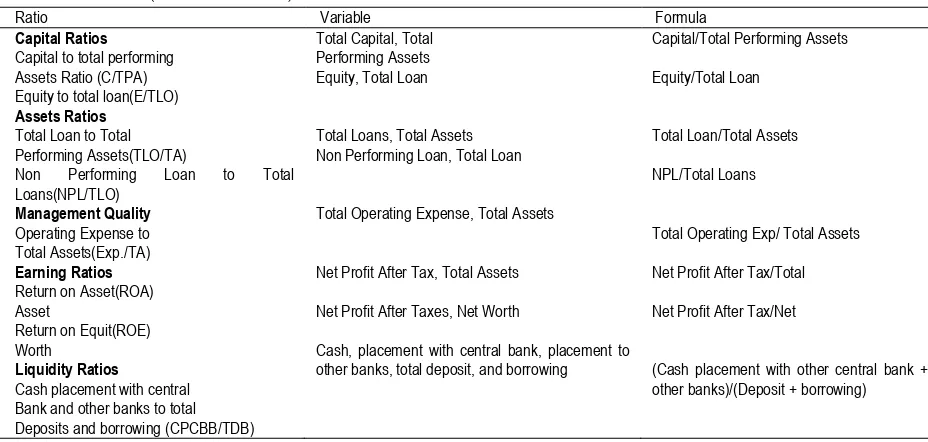
Table 2. CAMEL (Financial Ratios)
Ratio Variable Formula
Capital Ratios
Capital to total performing Assets Ratio (C/TPA) Equity to total loan(E/TLO)
Assets Ratios
Total Loan to Total Performing Assets(TLO/TA)
Non Performing Loan to Total Loans(NPL/TLO)
Management Quality
Operating Expense to Total Assets(Exp./TA)
Earning Ratios
Return on Asset(ROA) Asset
Return on Equit(ROE) Worth
Liquidity Ratios
Cash placement with central Bank and other banks to total Deposits and borrowing (CPCBB/TDB)
Total Capital, Total Performing Assets Equity, Total Loan
Total Loans, Total Assets
Non Performing Loan, Total Loan
Total Operating Expense, Total Assets
Net Profit After Tax, Total Assets
Net Profit After Taxes, Net Worth
Cash, placement with central bank, placement to other banks, total deposit, and borrowing
Capital/Total Performing Assets
Equity/Total Loan
Total Loan/Total Assets
NPL/Total Loans
Total Operating Exp/ Total Assets
Net Profit After Tax/Total
Net Profit After Tax/Net
(Cash placement with other central bank + other banks)/(Deposit + borrowing)
equity to total loan); asset quality (total loan/total assets, NPL to total loan), management quality (operating expenses to total assets), earnings (return on assets, return on equity), liquidity (cash and placement with central bank and other banks to total deposits and borrowing). These variables were used for CAMEL analysis for evaluating the financial performance of the banks and also testing whether there is a significant difference in banks' financial performance. The financial ratios used in the CAMEL model are shown in Table 2.
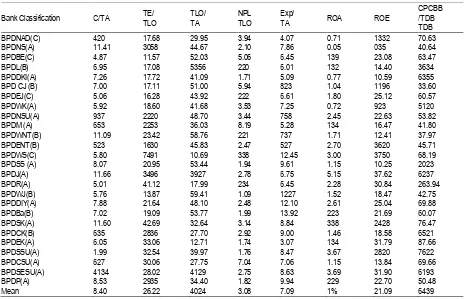
Empirical Result. CAMEL. Barr and Siems (1994) used total loans instead of total assets to measure the capital adequacy ratio. The reason was, loans of finance companies were assets with the highest potential of unanticipated losses, and an adequate level of capital must be maintained to absorb these unanticipated losses. This ratio was also used in accordance with the Central Bank of Indonesia's guidelines. The higher the ratio reflects, the higher the capital adequacy and the lower the probability of failure. Total loans to total assets was used by Hooks (1995), and Hwang and Lee (1997). Non-performing loan was used by Gonzalez-Hermosillo et al. (1997). The total loans-to-total assets ratio alleviates the problem that finance companies may have underestimated their non-performing loans. The higher the ratios imply a respectively. Table 4.1 shows the aggregate mean of capital to total performing assets from period 1994 to 2004, which is 8.40 percent. Only seven (7) banks or 26.92 percent of the total banks have a ratio above the aggregate mean. Six (6) of these banks were categorized at level A, and only one (1) bank was categorized at level B as prescribed by the Bank of Indonesia. The results imply that the minority of the regional development banks' management has managed their capital more efficiently, and the majority of these banks are not efficient in managing their capital (proportion of capital structure). The best performance led by BPDSESU has the capital to total performing assets ratio of 41.34 percent. Banks that have a ratio above the aggregate mean are categorized at level A, and two (2) banks from either level B or C. Those banks that have the ratio above BPDWS (74.91 percent) and BPDCK (28.36 percent).
Table 3 and Table 4, show that all banks that and BPDSK has a greater TPA annual growth. These results are consistent with the theory of Barr and Siems (1994) that loans of finance companies are assets with the highest potential of unanticipated losses, and an adequate level of capital must be maintained to absorb these unanticipated losses. Moreover, Coyle (1996) stated that the capital structure of bank must be sufficiently safe to stand the risk of any losses on its assets, such as bad debts or falling investment values.
Assets Quality. The top 11 banks that have a mean below aggregate mean in terms of total loan to total assets ratio are the following: BPDWS (10.69 lower ratio perform better than the banks that have a higher ratio. Those banks that have a good performance in this ratio are seven (7) banks, which belong to level A and four (4) banks from either level B or C (see Tables 3, 4, and 5).
Table 3. Comparative Financial Performance of CAMEL Ratios (%) of Regional Development Banks in Indonesia (1994-2004)
Bank Classification C/TA TE/
TLO
TLO/ TA
NPL TLO
Exp/
TA ROA ROE
CPCBB /TDB TDB
BPDNAD(C) 420 17.68 29.95 3.94 4.07 0.71 1332 70.63
BPDNS(A) 11.41 3058 44.67 2.10 7.86 0.05 035 40.64
BPDBE(C) 4.87 11.57 52.03 5.06 6.45 139 23.08 63.47
BPDL(B) 6.95 17.08 5356 220 6.01 132 14.40 3634
BPDDKI(A) 7.26 17.72 41.09 1.71 5.09 0.77 10.59 6355
BPD CJ (B) 7.00 17.11 51.00 5.94 823 1.04 1196 33.60
BPDEJ(C) 5.06 16.28 43.92 222 6.61 1.80 25.12 60.57
BPDWK(A) 5.92 18.60 41.68 3.53 7.25 0.72 923 5120
BPDNSU(A) 937 2220 48.70 3.44 758 2.45 22.63 53.82
BPDM (A) 653 2253 36.03 8.19 5.28 134 16.47 41.80
BPDWNT(B) 11.09 23.42 58.76 221 737 1.71 12.41 37.97
BPDENT(B) 523 1630 45.83 2.47 527 2.70 3620 45.71
BPDWS(C) 5.80 7491 10.69 338 12.45 3.00 3750 68.19
BPDSS (A) 8.07 20.95 53.44 1.94 9.61 1.15 10.25 2023
BPDJ(A) 11.66 3496 3927 2.78 6.75 5.15 37.62 6237
BPDR(A) 5.01 41.12 17.99 234 6.45 2.28 30.84 263.94
BPDWJ(B) 5.76 13.87 59.41 1.09 1227 1.52 18.47 42.75
BPDDIY(A) 7.88 21.64 48.10 2.48 12.10 2.61 25.04 69.88
BPDBa(B) 7.02 19.09 53.77 1.99 13.92 223 21.69 60.07
BPDSK(A) 11.60 42.69 32.64 3.14 8.84 338 2428 76.47
BPDCK(B) 635 2836 27.70 2.92 9.00 1.46 18.58 6521
BPDEK(A) 6.05 33.06 12.71 1.74 3.07 134 31.79 87.66
BPDSSU(A) 1.99 32.54 39.97 1.76 8.47 3.67 2820 7622
BPDCSU(A) 627 30.06 27.75 7.04 7.06 1.15 13.84 69.66
BPDSESU(A) 4134 28.02 4129 2.75 8.63 3.69 31.90 6193
BPDP(A) 8.53 2935 34.40 1.82 9.94 229 22.70 50.48
Mean 8.40 26.22 4024 3.08 7.09 1% 21.09 6439
Table 4 shows that all of the banks that have a lower non-performing loan to total loan ratio have an annual growth of NPL less than the annual growth of total loan, except BPDWNT, with an annual growth of NPL (25.60 percent) greater than the annual growth of total loans (19.29 percent). The result shows that BPDWJ, with the lowest ratio of 1.09 percent, has the lowest risk compared to other banks. Banks that have a lower NPL to total loan ratio were more efficient to control their uncollectible accounts and more effective to allocate the loan to credible borrowers to reduce risk. Most banks failed because of the problem in their loan portfolio. Non-performing loans grow to such an extent that revenues fall off and loan loss expenses, as well as operating costs, absorb all the earnings that remain.
Management Quality. Tam and Kiang (1992) stated that the management quality would eventually be reflected by the ratios, which proxy for the other four (4) CAMEL criteria. In an attempt to better capture the management quality, the ratio of operating expenses to total assets (Op.Exp/TA) was used in this study. This ratio repre efficiency of the management and was also used by Gonzalez-Hermosillo at al (1997). A higher ratio reflects a lower management quality and a higher probability of failure. It is difficult to measure the quality of management, because it involves qualitative issues such as the aptitude for risk-taking, the compliance
to regulatory procedures, and the development of sound internal control. The criteria to measure the management quality are the same with the criteria to measure the assets quality. If the ratio is high, it means the management quality is low and the probability to bankruptcy is high.
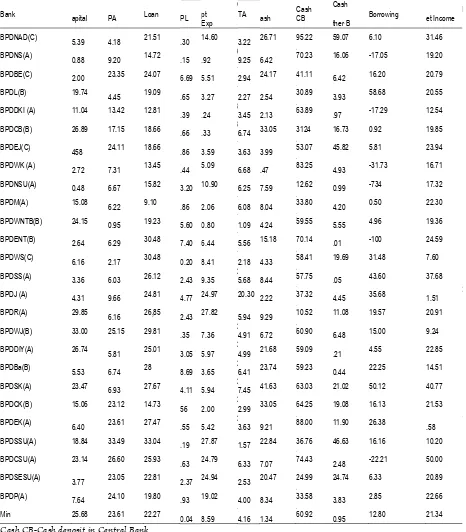
Table 4. Comparative Financial Performance of Annual Growth (%) of CAMEL Ratios of Regional Development Banks in Indonesia (1994-2004)
Bank C
Cash CB-Cash deposit in Central Bank Cash other B=Cash deposit in other banks
NPL = Nonperforming loan (loan under less current, doubtful account and bad debt account) TA = Total assets(total current and non-current assets)
TPA = total performing assets (current earning assets, earning asset under intensive, supervision, earning assets less current, earning asset under doubt account and bad debts account)
Oprt Exp=Operating expense
Earning Ability. Return on assets is widely used as a measure of profitability (Tam and Kiang [1992]; Barr and Siems [1994]; Cole and Gunther [1995]; Hwang and Lee [1997]; Gonzalez-Hermosillo
ability of banks' management of Regional Development Banks in Indonesia on how they manage their assets and equity to produce high returns. The aggregate mean of ROA and ROE from period 1994 to 2004 are 1.96 percent and 21.09 percent, respectively. Based on these criteria, the result shows that 11 and 14 banks have shown a good performance for ROA and ROE, respectively (see Table 3). The highest ratio is produced by BPDJ, with 5.15 percent for ROA and 37.62 percent for ROE. Moreover based on ROA, there are eight (8) banks that have a good performance that belong to level A and three (3) banks either from level B or C. On the other hand, bank which has the lowest ratio of ROA is occupied by BPDCJ (0.04 percent). In terms of ROE, there were nine (9) banks that have
shown a good performance that belong to level A and five (5) banks either from level B or C. Meanwhile, the bank with the lowest of ROE is occupied by BPDNS. These new results are consistent with the theory stated, that ROA is primarily an indicator of managerial efficiency; it indicates how capably the management of bank has been converting the institution's assets into net earnings. ROE, on the other hand, is a measure of the rate of return flowing to the bank's shareholders. The management of banks where ROE and ROA showed a decline must generally work harder to sustain the current level of earnings to improve the performance of the bank.
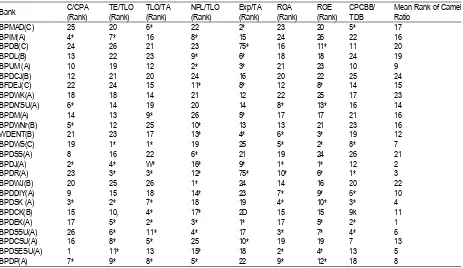
Table 5. Comparative Financial Performance of Rank Based on CAMEL Ratios of Regional Development Banks (1994-2004)
Bank C/CPA
(Rank)
TE/TLO (Rank)
TLO/TA (Rank)
NPL/TLO (Rank)
Exp/TA (Rank)
ROA (Rank)
ROE (Rank)
CPCBB/ TDB
Mean Rank of Camel Ratio
BPMAD(C) 25 20 6* 22 2* 23 20 5* 17
BPIM(A) 4* 7* 16 8* 15 24 26 22 16
BPDB(C) 24 26 21 23 75* 16 11* 11 20
BPDL(B) 13 22 23 9* 6* 18 18 24 19
BPUM (A) 10 19 12 2* 3* 21 23 10 9
BPDCJ(B) 12 21 20 24 16 20 22 25 24
BFDEJ(C) 22 24 15 11* 8* 12 8* 14 15
BPDWK(A) 18 18 14 21 12 22 25 17 23
BPDN'SU(A) 6* 14 19 20 14 8* 13* 16 14
BPDM(A) 14 13 9* 26 5* 17 17 21 16
BPDWNr(B) 5* 12 25 10* 13 13 21 23 16
WDENT(B) 21 23 17 13* 4* 6* 3* 19 12
BPDWS(C) 19 1* 1* 19 25 5* 2* 8* 7
BPDSS(A) 8 16 22 6* 21 19 24 26 21
BPDJ(A) 2* 4* W* 16* 9* 1* 1* 12 2
BPDR(A) 23 3* 3* 12* 75* 10* 6* 1* 3
BPDWJ(B) 20 25 26 1* 24 14 16 20 22
BPDDIY(A) 9 15 18 14* 23 7* 9* 6* 10
BPDSK (A) 3* 2* 7* 18 19 4* 10* 3* 4
BPDCK(B) 15 10, 4* 17* 2D 15 15 9k 11
BPDEK(A) 17 5* 2* 3* 1* 17 5* 2* 1
BPDSSU(A) 26 6* 11* 4* 17 3* 7* 4* 6
BPDCSU(A) 16 8* 5* 25 10* 19 19 7 13
BPDSESU(A) 1 11* 13 15* 18 2* 4* 13 5
BPDP(A) 7* 9* 8* 5* 22 9* 12* 18 8
* has a good financial performance on that ratio
Liquidity. Liquidity ratio was used to measure the risk of bank when depositors will withdraw their deposits in large amounts. If a bank does not have enough liquid assets to cover these withdrawals, then the bank will face a liquid risk. This study used cash place with central bank and other banks to total deposit and borrowing as a ratio to measure the liquidity of the bank to meet unexpected demand from creditors. Tam and Kiang (1992) and Gonzalez-Hermosillo, et al, (1997) also used a similar measure of liquidity. Bank with a higher ratio indicates that the bank is more liquid and has a lower probability of failure.
The aggregate mean of liquidity ratio for the period 1994 to 2004 was 64.3 percent. In this ratio, there were nine (9) banks that are more liquid compared with other banks that have ratios bellow the aggregate mean. The highest ratio owned by BPDR was 263.94 percent with an annual growth of cash place with the Central Bank of 105.18 percent and an annual growth of cash of 39.29 percent. On the other hand, the annual growth of deposit and borrowing was only 20.91 percent and 19.57 percent. The reason for this higher ratio, perhaps over the period 1994 to 2000, BPDR obtained the maximum of Rp 484.2 million IRP of total cash, cash place with Central Bank and other banks. Furthermore, from 2001 to 2004, the amount increased from Rp 3.4 billion to Rp 3.7 billion, while the total deposits and borrowing started from Rp 37.9 million in 1994 to Rp 852.8 million in 2001. Subsequently from year 2002, the amount increased from Rp 1. 1 billion to Rp 1.9 billion in 2004.
Table 5 shows the summary of the overall performance of 26 regional development banks in Indonesia from period 1994 to 2004. Based on CAMEL analysis, there are two (2) banks (BPDCJ and BPDWK) that do not have a good financial performance, not even one of the CAMEL ratios. In
terms of assets quality ratios, there are 17 banks that have shown a good financial performance, 11 banks in terms of management quality ratio, 13 banks in terms of earning ratios, and nine (9) banks in terms of liquidity ratio. Moreover, the table shows that a bank with the best financial performance in one ratio does not automatically have a good financial performance with other ratios The result of this study shows an example BPD of West Sumatera that has shown the best performance in terms of total equity to total loans ratio and total loans to total assets ratio but not for non-performing loan to total loans ratio and total operating expenses to total assets ratio. This is consistent with the theory that was stated that a single ratio does not generally provide a sufficient information from which to judge the overall performance of the firm. Furthermore, when the ratios of the firm are compared with those of another or with those of the firm itself over time, the results can be distorted due to inflation.
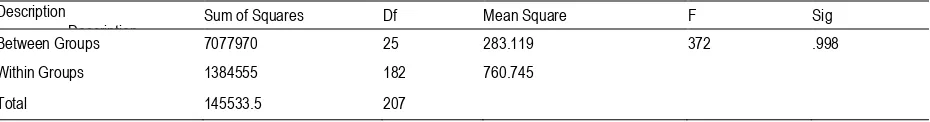
Anova Results. In this study, ANOVA-test was used to evaluate if there are significant differences in financial performance among the regional development banks in Indonesia. The study tested whether the eight (8) ratios of CAMEL have significant differences in financial performance among the regional development banks. Table 6 shows that the F statistic is 0.372 at the significance value of 0.998, which implies that there is no significant difference at acceptance level of 0.0 1, 0.05 and 0.10 among CAMEL ratios of all sample banks. Thus, the null hypothesis is accepted. This further suggests that all banks have shown statistically the same level of financial performance as evident in their CAMEL indicators. The result of the ANOVA — test is consistent with the theory that any single ratio does not provide a sufficient information from which to judge the overall performance of a firm.
Table 6. ANOVA-Test Result CAMEL Description
Description Sum of Squares Df Mean Square F Sig
Between Groups 7077970 25 283.119 372 .998
Within Groups 1384555 182 760.745
Total 145533.5 207
Note: The Value of F is the ANOVA value. Sig is the significance level
Significant level of 0.01, 0.05, and 0.1
CONCLUSIONS AND FUTURE RESEARCH
Bank performance is modeled using a conventional CAMEL model. Results reveal that 26.92 percent of the banks have a good performance according to the capital to total performing assets, 42.3 1 percent based on total
equity ratio, total loan to total assets ratio, total
BPDWS with the highest ratio (74.91 percent) and lowest ratio (10.69 percent) of total equity to total loan, and total loan to total assets respectively, BPDWJ with the lowest ratio (1.09 percent) of NPL to total loan, BPDEK with the lowest ratio (3.07 percent) of total expenses to total assets, BPDJ with the highest ratio (5.15 percent, and 37.62 percent) of ROA and ROE respectively, and BPDR with the highest ratio (263.94 percent) of cash and placement with central bank and other banks to total deposit and total borrowing. Furthermore, CAMEL model has demonstrated that not all of the banks that have a good performance come out from the banks with CAR above the minimum requirement of bank authority and a bank that has the best performance in one ratio does not automatically have a good performance with other ratios. CAMEL model also proves that each of the 26 banks has its own management's strengths and weaknesses to operate the bank during 1994 to 2004. ANOVA test statistically proves that among all sample banks, there are no significant differences in their financial performance. The result of this study has affirmed robustly the theory that any single ratio does not provide sufficient information from which to judge the overall performance of a firm.
The new evidence found in the Indonesian regional banks is another new empirical contribution to the banking performance literature. New original findings of this study can also provide a starting point for further investigation on performance, efficiency and productivity for other banks by using different variables and model of CAMEL and results will be further validated by the aid of other statistical tools aside from tests used in this study. Significantly, results of this study contribute significantly to theoretical
modeling of performance (efficiency and
productivity) extensively in the banking sector as evident in the Indonesian state banks.
REFERENCES
Bank Indonesia. (2002). Bank Indonesia. Annual Report.
Batunanggar, Sukarela. (2002). Indonesia's Banking Crisis Resolution. BI (2000). Monthly reports. www.bi. go. id
Cole, R. A. and Gunther, J. W. (1995). Separating the likelihood and timing of bank failure. Journal of Banking & Finance 19 (9),
1073-1089 Gitman, Lawrence J. (2000).
Principles of Managerial Finance, 9th Edition, New York: Addison Wesley.pp. 124-145.
Gonzalez-Hermosillo, B., Pazarbasioglu, C., and Billings, R. (1997). Determinants of banking system fragility: A case study of Mexico. International Monetary Fund Staff 44 (8), 295-314.
Hooks, L. M. (1995). Bank asset risk: Evidence from
early-warning models. Contemporary
Economic Policy 13 (10), 36-50.
Hwang, D. Y. and Lee, C. F. (1997). Forecasting bank failure and deposit insurance
premium. International Review of
Economic & Finance 6, 317-334.
Jaccard, James. (1998). Interaction effects in factorial analysis of variance Probability and Statistic Multivariate Analysis 118, 25-53.