IMPACTS SEED TECHNOLOGY IMPROVEMENT ON
ECONOMIC ASPECTS OF CHILLI PRODUCTION
IN CENTRAL JAVA–INDONESIA
Joko Mariyono
Department of Economics, Universitas Pancasakti Tegal Jl. Halmahera Km-1, Tegal, Indonesia. Telp: +62-0283-351082;
Correspondence E-mail: [email protected]
Recieved: January 2016; Accepted: June 2016
Abstract
Vegetable production, including that of chillies, plays an important role in agricultural sector and rural economic development worldwide. This is because of greater farm productivity with regard to vegetables than cereal and staple crops. This paper analyses the impact of seed technology development on the economic aspects of chilli production in Central Java. Particular attention is paid to improved varieties of chilli. Potential consequences of seed technology development are discussed. Data of this study are compiled from surveys conducted in three selected chilli producing regions in 2010-2012. The results show that the major varieties of chilli grown by surveyed farmers are grouped into three broad types: hybrids, local and improved open pollinated varieties. The chilli varieties farmers selected varied according to location and cropping season. In the dry season, farmers grew similar proportions of hybrid, local, and open pollinated types. Nevertheless, there were differences among the survey sites. Farmers grew different varieties to exploit seasonal microclimates and market preferences. Mostly, farmers selected varieties for economic motives. The consequence of growing hybrids was less use of agrochemicals, particularly pesticides, than for other varieties. Overall, they show the best economic performance in the study site. Development of seed technology should consider agro-ecological and economic aspects to obtain better outcomes. Private sector and national research institutions need to collaborate more to utilise available genetic resources to produce better varieties of chilli.
Keywords: seed technology, chilli production, hybrids and open-pollinated varieties, economic aspects. JEL Classification: E23, Q12, Q14
1. Introduction
Vegetable production, including that of chilli, plays an important role in the global agribusiness. This is because of higher farm productivity in case of vegetable than that of cereal and staple crop sectors (Weinberger and Lumpkin, 2007; Ali, 2008; Johnson et al., 2008). Vegetables are needed for daily dietary as well as for raw material of food and pharmaceutical industries. Because of the high profitability of commercial vegetable production than that of paddy and other cereal crops, the potential exists for much higher
impacts on household income, if land devoted to production and other inputs increase.
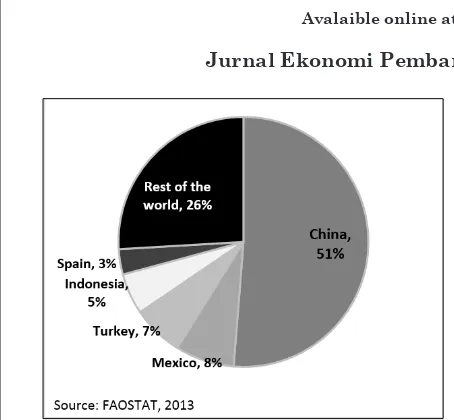
Figure 1. Global share of top-five chilli-producing countries
In Indonesia, chilli is an important part of life and, for most people, mealtime will not be perfect without a serving of fiery dishes. A large part of national level production of chilli is daily consumed in a fresh form. Chilli has become a special commodity because of its capability to trigger high inflation. Indonesian Statistical Agency (BPS, 2011) reported that in 2010, chilli commodity contributed 0.32% to total national inflation of 6.96%. At the time, chilli prices in Indonesia soared to record highs, provoking outrage in a nation that eats the tongue burning spice for breakfast, lunch and dinner. At about $11/kg, almost ten times the usual price and more expensive than beef and chicken meat, it has truly become a hot commodity on dining tables and in kitchens throughout Indonesia (O’Loughlin, 2011). This particular spice, considered as a staple by most people, has increasingly become a luxury item (Global Indonesian Voices, 2014). To control the inflation rates, government assistance to help farmers deal with unpredictable microclimate is crucial in addition to (temporary) trade policy such as imports (Wicaksena and Permani, 2011). Chilli production gets a special attention from the Central Bank of the country. Even, the Indonesian President said that “people should be creative in planting chillies - an essential ingredient in Indonesian cuisine”. Indonesian people have been urged to grow their own chillies, in an attempt
to deal with an extraordinary increase in chilli prices (BBC News, 2011). Chilli is still one of sources of inflation in the foodstuffs component in January 2013. The price increased due mainly to lower domestic supply (Juniman, 2013). Recently, Indonesian Finance Minister reported that the country’s inflation in 2013 exceeded the target set in the state budget on food price hikes. Importantly rice supply should be sufficient in addition to supplies of other food products such as shallot and chilli. Gasoline is no longer the major contributor to inflation (Antara News, 2014).
Chilli is an important cash crop, which provides a significant contribution to the local and national economy through its multiplier effects. A study by Mariyono and Bhattarai (2011) shows that moving from rice farming to chilli-based agribusiness is able to make rural economy more vibrant through labour and material intensive farming. The income of farmers doubled that before, and the agricultural inputs and product in the market increase substantially. The intensification triggered local market, particularly through value chains of agricultural inputs and products. Because of high value cash crop and need of high inputs, particularly labour as well as material inputs than cereal and staple crops (Ali, 2006; Mariyono and Bhattarai, 2009), multiplier effects of chilli cultivation, such as employment creation, agribusiness development and local transportation accrue to the wider sectors rural community. At national level, it provides income, employment, and nutritional benefits to millions of smallholder farmers, rural labourers, and consumers.
Figure 2. Area and Production of top-five vegetables in Indonesia, 2013
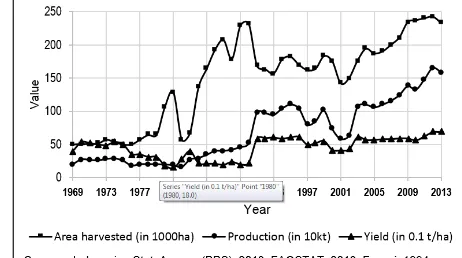
Figure 3. The dynamics of chilli acreage, yield and production in Indonesia
Chilli is produced year around, but there are two main production seasons: one starting from mid-February with a harvest running from late April to early June, and then starting in late July with a harvest running from September to as late as early November. Consequently, Indonesian chilli production does not exhibit a very strong seasonal pattern. Monthly production of chilli nation-wide, averaged by month over the period from 2000 to 2013, ranges from 60,000 to 150,000 t per month with a peak in April and a lower peak in September. It means that variations in weather, planting and other factors can overwhelm seasonal output effects (Webb et al., 2012). Year around pattern of the productivity of chilli in Java reveals a sigmoid shape, meaning that supply of chilli fluctuates (Wijayanto et al., 2014).
Annual chilli-sown area has highly fluctuated over the last 25 years (see Figure 3). In 2013, it was cultivated on about 240,000 ha, with annual production of close to 1,600,000 t, which was about 5% of the global production, and this puts Indonesia in the fourth largest chilli producer in the world (Indonesian Commercial Newsletter 2013). The expansion of chilli acreage is mainly because of improvement in market infrastructure and market information (Mariyono and Sumarno, 2015).
Chilli acreage started increasing in the early 1980s from around 50,000 ha. Production of chilli increased dramatically during the 1980s when there was a substantial improvement in irrigation infrastructure and intensification of paddy. Chilli-cultivated area reached a peak of around 230,000 ha in 1990. After that, the crop acreage dropped to about 150,000 ha in 2001, and increase again to about 240,000 ha in 2012. There was a dramatic decline in chilli production from 1,100,000 t in 1999 to only about 600,000 t in 2001 due largely to a long drought and a substantial decline in chilli-cultivated areas.
The dynamics of chilli-sown areas determines the chilli production level in Indonesia since average yields have been steady over the period at around 4-6 t/ha. Compared to regional and international standards, the average yield is considered very low (Ali, 2006), which is still far below the potential of 15-20 t/ha (Indonesian Commercial Newsletter, 2013). The low yield is due to many factors such as pest and disease outbreaks and variation on extreme weather conditions, which suggests a huge scope for high yielding cultivars and better management practices to increase national level production through enhancing productivity without jeopardising grain production areas (Johnson et al., 2008).
Newsletter 2013), and this leads to fluctuation of chilli production causing unstable market price of chilli. Chilli is unquestionably a condiment in Indonesian cooking, such that the demand for chilli is very inelastic according to a study by Ali (2006). A 14% price increase for every 1% decline in supply which is in the range of the price changes reported at the beginning of 2011. Although the price surge during late 2010 to early 2011 was extraordinary, this was not an isolated event for the preceding 10 years. Chilli prices have shown a high degree of volatility over the past decade since the 1997 Asian financial crisis led to a relaxing government control of commodity markets (Webb et al., 2012).
Since the last decade, chilli price has undergone high month-to-month variability. For the Java Island, where more than 60% of chilli is produced, monthly retail price data suggests that the chilli market is highly integrated. Prices in one region or city are closely linked to prices in other regions (Webb et al., 2012). The spread between the minimum and the maximum price indicate that there have been periods of distress selling when prices were extremely low and periods of severe shortages when prices were 3-4 times the average. The extreme volatility of chilli prices are a focus of government and public concern. More price volatility would mean higher risk premiums for traders and other middlemen and consequently broader farm-retail price spreads and a less efficient market for a key Indonesian food product (Webb and Kosasih, 2011).
The process starts with a broad-based agricultural growth, causing a build-up of purchasing power by millions of small farmers. Subsequently, these millions of farmers expend and re-cycle more cash through the economy, stimulating demand and employment growth in non-farm sectors, which in turn increases the demand for food and other farm products in a virtuous cycle where rural and urban labour forces provide a market for each other (Jayne et al., 2011).
Despite the rapid growth of chilli production, Indonesian chilli production is still low in terms of global share. There is still enough room for improving chilli production in Indonesia, by promoting developing good cultivars of chilli. This paper analyses chilli seed technology development in Indonesian production areas. Particular attention is paid to improved varieties of chilli. Potential consequences of seed technology development are discussed.
2. Research Method
This section provides research approach and assessment framework, research methodology, analytical tools used for data analysis, data collection procedures, and a brief description of the study locations. Data of this study were compiled from surveys conducted in 2010-2012 in selected chilli producing regions of Central Java. The primary survey had three main parts: a household survey, community/group surveys, and focus group discussions with selected key informants. The survey integrated qualitative and quantitative survey methods to meet the study objectives. As a part of the quantitative approach, a rigorous household survey was carried out through face-to-face interviews with 160 farmers to collect information on the socioeconomics of chili farming, level of pesticides and other inputs used, and other details. A qualitative approach was used to collect information on social and institutional issues involved in chili farming at the community or farmers’ group level at each study site. Descriptive and simple econometric methods were employed to analyse the consequences of seeds technology. We follow Kikuchi (1991) to analysis economic consequence of different varieties. Consider a production function of producing Q using material inputs
X, labour input L, and land A, formulated as:
(
X
L
A
)
f
Q
=
,
,
, then, the factor shares ofbe respectively formulated as:
=
∗
100
Return to the management (S
M) is calculated using(
X L A)
M
S
S
S
S
=
100
−
+
+
(1)
Return to the management could be positive or negative. The higher value of this value represents better farm management.
Since farmers are aware to the health and environmental impacts of pesticides, econometric analysis uses Tobit regression that may give more accurate results (see Johnston and DiNardo, 1997; Maddala, 1983). Tobit regression used is expressed as:
where Yis the observed dependent variable for the household; and Y~ is a latent variable observed as the value of Y in the event that
Y~> 0 and unobserved otherwise. Z is a set of explanatory variables, including hybrid seeds. A set of hypotheses are built and tested at t-critical 1%, 5% and 10% levels.
3. Results and discussion
3.1. Description of Survey sites
Central Java is one of the largest chili-producing areas in Indonesia. In 2007, chili was cultivated on about 18,225 ha in Central Java, with production of 91,150 t (BPS 2013). However, compared to other largest chili-producing provinces, the average productivity of chili is low in Central Java, at around 5 t/ha.1 Within
Central Java, the three largest regions producing chili are Brebes, Magelang, and Rembang. Those three districts were selected for on-farm trials and project intervention. Each site has distinctive variations in agro-ecology and chili production characteristics.
Brebes Regency is situated in the north-western coastal area of Central Java. The regency borders West Java Province and it is also linked closely with the Bandung and Jakarta vegetable markets. Brebes is the largest chili-producing region in Central Java. Magelang Regency is in the southern region of Central Java, bordering Yogyakarta Province; it is the second largest chili-producing region in Central Java. Rembang Regency is in the northern coastal area of Central Java, which borders with East Java Province. These three districts are representative of chili-producing areas in Central Java.
Figure 4. Study sites
3.2. Chili varieties cultivated
The major varieties of chili grown by surveyed farmers were grouped into three broad types: hybrid varieties consisting of BALADO, INCO99, TARO, TM999, and TM88; local varieties, consisting of Semarangan, Jatilaba, Keriting; and open pollinated variety, consisting of TIT-∆ and Tampar. Hybrid varieties were purchased from agricultural shops in the villages and at sub-district markets. Farmers produced their own seed from local and open pollinated varieties.
Selection of chili varieties varied by location and cropping season. During dry season, farmers grew similar proportions of hybrid, local, and open pollinated types (Appendix 1). Nevertheless, there were differences among the survey sites. In Magelang, more than two-thirds of farmers planted hybrids. In Rembang, hybrids were planted by about one-third of chili farmers; the remaining farmers grew local varieties. No farmers grew
hybrid chili in Brebes. In wet season chili farming in Magelang, nearly all farmers grew hybrids. Farmers grew different varieties to exploit seasonal microclimates and market preferences. In Brebes, chili traders prefer local and open pollinated varieties for the local chili processing industry. Traders in Magelang preferred hybrid chili (TM999) because of its suitability for long-distance travel and local consumer preferences. Prices for preferred varieties commanded a 10 percent premium in each market. Various reasons that motivated farmers to select a particular chili variety are summarized in Appendix 2. Mostly farmers selecting varieties of chilli is because of economic motives.
3.3.
development is the use of pesticides. Within the three survey sites, farmers reported using more than 80 brand names of insecticides, fungicides,
The consequence of different varieties
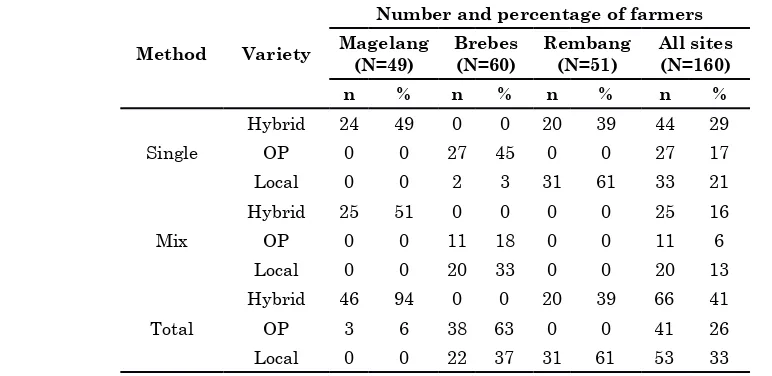
and other pesticides on chili. Figure 5 shows the breakdown of pesticides by type. Farmers applied pesticides in single and mixed sprays. “Single spray” means that for every application, farmers used a specific pesticide based on the pest targeted or observed. This does not mean that only one pesticide is used in a spray; more than one could have been used. When preparing “mixed sprays,” farmers put several pesticides into a bigger container, and then use the mixture from that container for several days. Application of mixed pesticides was more common in Magelang; single spray was more common in Rembang. The spraying methods selected also varied, based on the types of variety cultivated (Table 1).
Figure 5. Breakdown by type of pesticides used in Central Java, 2008
Table 1. Method of pesticide spray for different types of chili grown in survey communities
Method Variety
Number and percentage of farmers
Magelang (N=49)
Brebes (N=60)
Rembang (N=51)
All sites (N=160)
n % n % n % n %
Single
Hybrid 24 49 0 0 20 39 44 29
OP 0 0 27 45 0 0 27 17
Local 0 0 2 3 31 61 33 21
Mix
Hybrid 25 51 0 0 0 0 25 16
OP 0 0 11 18 0 0 11 6
Local 0 0 20 33 0 0 20 13
Total
Hybrid 46 94 0 0 20 39 66 41
OP 3 6 38 63 0 0 41 26
Local 0 0 22 37 31 61 53 33
N = total sample in each community; n = number of farmers
Significant difference of mean across sites is indicated by superscript M, B and R. Significant difference of mean between single and mixed spray is indicated by superscript S and C; mean comparison is tested at 95% of confidence interval (Appendix 3).
Significant difference of mean across sites is indicated by superscript M, B and R. Significant difference of mean across varieties is indicated by superscript H, O and L; mean comparison is tested at 95% of confidence interval (Appendix 4).
Total number of sprays per crop season depends on the length of time for each spraying, frequency of sprays in a week, and total duration of crop. In total, 23 sprays were done for a chili crop in a three-month cropping season. Single sprays were more frequent than mixed sprays, but this varied by site. Brebes had the highest number of sprays per planting season, followed by Rembang and Magelang. The frequency of sprays per week in Rembang was greater than in Brebes, but the total number of sprays in Rembang was less than in Brebes an indication that the total period of spraying in Rembang was shorter. A higher number of sprays per week does not directly translate into higher number of sprays per planting season; the spray duration varies by severity of pest attacks, stage of crop growth, and other local agroecological factors.
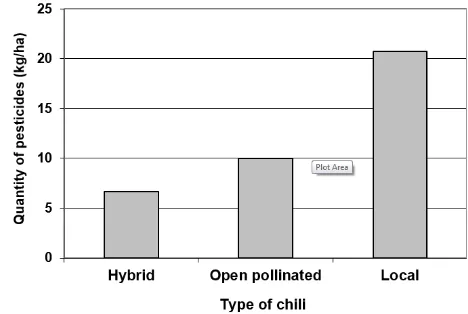
Figure 6. Quantity of pesticide use in chili, by type of chili
The number of sprays also varied by type of chili variety cultivated (Appendix 4 and Fig. 6). Farmers growing local varieties sprayed more often. Brebes, where most farmers grow open pollinated and local varieties, had the highest frequency of sprays per week as well as the highest total number of sprays per growing season. Despite more severe pest and disease problems in Magelang, the number of sprays there was less than Brebes; this is due largely to cultivation of hybrid varieties, which are relatively more resistant to common pests and diseases.
The choice of pesticide depended on the type of chili variety grown. Local varieties received the highest number of sprays and highest quantity of pesticides, especially in Brebes, where no farmers grew hybrids. Clearly, local varieties need more protection from pests and diseases, which prompts farmers to apply more pesticides. The high level of pesticide use in Indonesia started during the Green Revolution that introduced agrochemical-augmenting technological change (Mariyono, 2015). To control pesticide use, public sector agencies should consider developing and providing local or open pollinated varieties resistant to common pests and diseases. Traders also prefer local varieties already linked into the supply chain rather than new resistant varieties without an established consumer base.
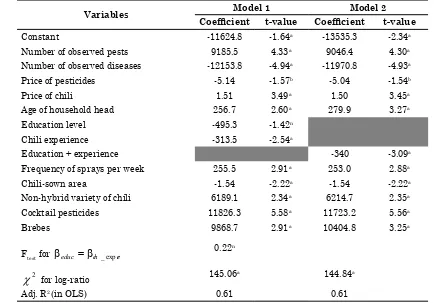
We can see that various factors affected pesticide use, but up to this point we do not know which factor significantly affecting level of pesticide use. Further analysis using Tobit regression methods can provide such information. The results from regression analysis explaining factors impact on level of pesticides use are reported in Table 2. All coefficients from both of the models estimated are significant at 10 % of the significant level. When the models are estimated using OLS, both show that around 60% of variation in pesticide use can be explained. Model 2 is obtained by restricting the assumption that education and experience in chili farming have the same effect in terms of sign and magnitude. Based on Model 2, the result suggests that pesticide use increase when farmers observe more pests. This is reasonable because controlling pest can limit the yield loss by pest, as the plant could still recover when pests are killed. Conversely, farmers reduce pesticides when they observe more number of diseases in the field. Plant infected by diseases less likely to recover, so farmers also behave rationally here. Thus, farmers used pesticides when the level of diseases is low. Thus, curative decision is for pests and preventive is for diseases.
of pesticides leads to reduction in pesticide use. The sign of chili price, as per priori expectation, is positive, meaning that increase in price of chili leads to increase in pesticide use. Both results are
logical and consistent with rational decision of farmers in terms of maximizing profit from crop production.
Table 2. Factors affecting pesticide use
Variables Model 1 Model 2
Coefficient t-value Coefficient t-value
Constant -11624.8 -1.64a -13535.3 -2.34a
Number of observed pests 9185.5 4.33a 9046.4 4.30a
Number of observed diseases -12153.8 -4.94a -11970.8 -4.93a
Price of pesticides -5.14 -1.57b -5.04 -1.54b
Price of chili 1.51 3.49a 1.50 3.45a
Age of household head 256.7 2.60a 279.9 3.27a
Education level -495.3 -1.42n
Chili experience -313.5 -2.54a
Education + experience -340 -3.09a
Frequency of sprays per week 255.5 2.91a 253.0 2.88a
Chili-sown area -1.54 -2.22a -1.54 -2.22a
Non-hybrid variety of chili 6189.1 2.34a 6214.7 2.35a
Cocktail pesticides 11826.3 5.58a 11723.2 5.56a
Brebes 9868.7 2.91a 10404.8 3.25a
Ftest for βeduc =βch _exper 0.22 n
2
χ
for log-ratio 145.06a 144.84a
Adj. R2 (in OLS) 0.61 0.61
Note: dependent variable is pesticide use per hectare; a: significant at 5% level; b: significant at 10%
Age of household has positive effects on pesticide use, meaning that older farmers use more pesticides than younger farmers, ceteris paribus. This implies that older farmers have lower prediction for economic threshold of pests, so they use measure that is more preventive in disease management than that of younger farmers. In contrast, education and experience in chili farming have negative impact on pesticide use. An educated and more experience in chili farming uses less pesticide than those with lower level of education and experience. This indicates that education and experience in chili farming lead to better prediction on economic threshold level, and less dependent upon preventive to
diseases. It could be the case that education and experience could also improve understanding in pests, diseases and pesticides; thus better optimizing the pesticides and inputs use.
Also, small farm operates more intensively than large-size chili farm, and so more quantity of pesticides used on small-farm plot.
The effects of Non-hybrid varieties and cocktail spray have positive effects on pesticide use. Non-hybrid varieties and cocktail spray are also strongly related to the chili locations because many farmers in Brebes grow non-hybrid varieties and apply cocktail spray. Farmers who grew non-hybrid chili used more pesticides than those who grew hybrid, which suggests that non-hybrid chili types need more protection from pests and diseases. Likewise, farmers applying cocktail spray use more pesticides that those who apply single spray. When farmers observe more number of insect pests and diseases, they are also likely to use mixture of various insecticides and fungicides to control range of pests and diseases at the same. This is unlikely for farmers who apply single spray, who likely to use appropriate pesticide to control targeted pests, or to control targeted diseases.
Farmers in Brebes used more pesticides than those in other region. Pesticides application practice in Brebes is also deeply rooted in socio-culture and past history, as massive promotion of agrochemicals and pesticides have been done in Brebes by pesticides companies than in Magelang and Rembang. In addition, Brebes is closer to big chili (and vegetable) markets; all these factors lead to more intensive and high inputs based vegetable cultivation in Brebes than that of other two places.
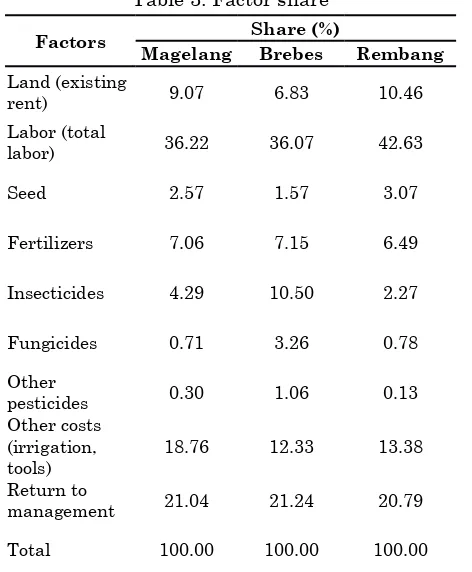
The economic consequence of different seed technology can be seen in the analysis of factor share provided in Table 3. We can see that Brebes, where no farmers grew hybrid variety showed the highest share in pesticide use. However, the return to management in all areas is almost similar; indicating that, with lower pesticide use, the region that grew hybrid varieties could provide better production.
Table 3. Factor share
Factors Share (%)
Magelang Brebes Rembang
Land (existing
rent) 9.07 6.83 10.46
Labor (total
labor) 36.22 36.07 42.63
Seed 2.57 1.57 3.07
Fertilizers 7.06 7.15 6.49
Insecticides 4.29 10.50 2.27
Fungicides 0.71 3.26 0.78
Other
pesticides 0.30 1.06 0.13
Other costs (irrigation, tools)
18.76 12.33 13.38
Return to
management 21.04 21.24 20.79
Total 100.00 100.00 100.00
study site. Development of seed technology should consider agro-ecological and economic aspects to obtain better outcomes. Private sector and national research institutions need to collaborate more to utilise available genetic resources to produce better varieties of chilli.
5. References
Ali M. (2008). Horticulture Revolution for the Poor: Nature, Challenges, and Opportunities. A background paper prepared for IAAST, World Development Report/World Bank 2008.
Ali M. (ed.) 2006. Chili (Capsicum spp) Food Chain Analysis: Setting Research Priorities in Asia. Shanhua, Taiwan: AVRDC – The World Vegetable Center, Technical Bulletin No. 38, AVRDC Publication 06-678.
Antara News (2014), “Indonesia inflation exceeds target on food price hikes”, Finance Minister, http://www.antaranews.com/en/news/92052/ indonesia-inflation-exceeds-target-on-food-price-hikes-finance-minister (accessed 28 March 2014)
BBC-News (2011), “Indonesians urged to grow chillies to combat price rise”, BBC-NEWS, ASIA-PACIFIC, 6 January 2011
BPS (2011), Monthly Data Report of Social and Economic. 9th Ed., Indonesian Statictical Agency, Jakarta, 2011.
BPS (2013), Indonesia Year Book. Indonesian Statistical Agency, Jakarta.
FAOSTAT (2013), FAO-STAT online. Rome: United Nations Food and Agriculture Organization. http://faostat.fao.org/default/ aspx?lang-en (accessed 4 March 2014)
Feder, G., Just, R.E. and Zilberman, D. (1985), “Adoption of agricultural innovations in developing countries: a survey”, Economic Development and Cultural Change, Vol. 33 No. 2, pp. 255-98.
Global Indonesian Voices (2014), “Chili is becoming a luxury in Indonesia”, Global Indonesian Voices, March 28,
Jayne, T.S., Haggblade, S., Minot, N., and Rashid, S. (2011), “Agricultural commercialization, rural transformation and poverty reduction: what have we learned about how to achieve this?” Synthesis report prepared for the African Agricultural Markets Programme Policy Symposium, Alliance for Commodity Trade in Eastern and Southern Africa April 20-22, 2011, Kigali, Rwanda.
Johnson G.I., Weinberger K., Wu M.H. (2008). The Vegetable Industry in Tropical Asia: An overview of production and trade, with a focus on Thailand, Indonesia, the Philippines, Vietnam, and India [CD-ROM]. Shanhua, Taiwan: AVRDC – The World Vegetable Center. 56 pp. (Explorations series; no. 1).
Johnston J., Di’Nardo J. (1997). Econometric Methods. McGraw-Hill Co. Inc. New York.
Juniman (2013), “Yearly inflation increase, but the BI rate remains on hold”, BII Economic Research, February 2013.
Kikuchi, M. (1991). Factor share in agricultural production: definition, estimation and application. In: IRRI, Basic Procedures for Agroeconomic Research, IRRI, Manila, Philippines pp. 83-98.
Maddala, G.S. 1983. Limited Dependent and Qualitative Variables in Econometrics. Cambridge University Press.
Mariyono, J. and Bhattarai, M., (2009), Chili Production Practices in Central Java, Indonesia: A Baseline Report. AVRDC- The World Vegetable Center, Taiwan.
Mariyono, J. (2015). Green revolution- and wetland-linked technological change of rice agriculture in Indonesia. Management of Environmental Quality: an International Journal, 26 (5), 683-700.
Mariyono, J., Sumarno (2015). Chilli production and adoption of chilli-based agribusiness in Indonesia. Journal of Agribusiness in Developing and Emerging Economies, 5 (1), 57-75.
O’Loughlin, T. (2011), “Red hot chilli prices bring a tear to the eye”, Sydney Herald Morning, January 8, 2011.
Webb, A. J. and Kosasih, I. A. (2011), “Analysis of price volatility in the Indonesia fresh chili market.” Paper presented to the Annual Meeting of the International Agricultural Trade Research Consortium, December 11~13, 2011, Tampa, FL, USA.
Webb, A. J., Kartikarsari, F. G. and Kosasih , I. A. (2012), “Do chili traders make price volatility worse? a qualitative analysis of East Java trading practices” (November 15, 2012). Available at SSRN: http://ssrn.com/ abstract=2176153 (accessed 12 March 2014)
Weinberger K, and Lumpkin T.A. (2007), “Diversification into horticulture and poverty reduction: A research agenda”, World Development,Vol.35No. 8, pp. 1464-80.
White, B., Morey, P., Natawidjaja, R. and Morgan, W. (2007), Vegetable value chains in Eastern Indonesia–a focus on chilli. SADI-ACIAR Research Report, Indonesia Australia Partnership.
Wicaksena, B. and Permani, R. (2011), “Indonesian chilli farmers’ participation at the supermarket channel”. GoLive Indonesia, October 2011.
Appendix
Appendix 1. Types of variety of chili grown by farmers
Season Kind of chili varieties
Number and percentage of farmers
Magelang
(N=49)
Brebes
(N=60)
Rembang
(N=51)
Average
(N=160)
n % n % n % n %
Dry Season
Hybrid 41 86 0 0 20 34 66 43
Open pollinated 0 0 38 63 0 0 38 23
Local 0 0 22 37 31 53 49 30
Total 42 86 60 100 51 86 153 96
Wet Season
Hybrid 46 94 0 0 0 0 46 29
Open pollinated 0 0 15 25 0 0 15 9
Local 0 0 0 0 0 0 0 0
Total 46 94 15 25 0 0 61 38
N = total sample in each community; n = number of farmers giving response
Appendix 2. Farmers’ motivation for choosing chili varieties
Hybrid OP Local*
BALADO INCO99 TARO TM 999
TM 88
TIT-∆ and Jatilaba
Sema-rangan Tampar
Keri-ting
High yield 7 3 5 26 9 13 19 3 7
Disease resistant 7 3 2 19 3 17 19 4 1
Higher no. of pods 4 6 2 16 4 12 19 3 4
Insect resistant 3 1 2 9 5 8 19 3 9
High price 4 0 5 7 8 14 19 5 6
Thick flesh 0 8 0 0 2 10 19 0 0
Hot taste 0 0 0 0 0 19 19 0 0
Good fragrance 0 0 0 0 0 17 19 0 0
Large no. of seeds 1 0 0 1 0 13 19 0 0
Good color 0 3 0 2 0 10 19 0 0
Good appearance 0 0 1 1 0 9 19 3 0
Good surface 0 1 1 0 0 8 19 0 0
Soft texture 0 0 0 0 0 10 19 0 0
Long shelf life 0 0 0 0 0 3 0 0 0
Hard texture 0 0 0 0 0 4 0 0 0
Short duration 0 0 0 0 0 0 0 0 0
Total 26 25 18 81 31 167 247 21 27
Appendix 3. Frequency of pesticide application by mixture, Central Java
Method Unit of
spray Frequency of sprays (times)
Magelang
(N=49) Brebes (N=60) Rembang (N=51) All sites (N=160)
N Mean SD N Mean SD N Mean SD N Mean SD
Single Per week 21 0.90 0.30 29 1.00 MR,C 0.71 51 1.94 MB 1.08 101 1.46 1.00 Per season 21 10.52 5.69 29 46.59 29.12 51 22.39 M 8.19 101 26.87 C 21.36
Mixed Per week 28 0.89 0.31 31 1.94 M,S 0.81 0 . . 59 1.44 .82
Per season 28 13.46 5.38 31 20.68 8.52 0 . . 59 17.25 8.01
All methods
Per week 49 0.90 0.31 60 1.48 M 0.89 51 1.94 MB 1.08 160 1.45 .93
Per season 49 12.20 5.65 60 33.20 R 24.69 51 22.39 M 8.19 160 23.33 18.23
Appendix 4. Frequency of pesticide application by type of chili, Central Java
Variety Unit of spray
Frequency of sprays (times)
Magelang (N=49) Brebes (N=60) Rembang
(N=51) All sites (N=160)
N Mean SD N Mean SD N Mean SD N Mean SD
Hybrid
Per
week 49 0.90 0.31 0 . . 20 1.65
M 0.81 69 1.12 0.61
Per
season 49 12.20 5.65 0 . . 20 24.95
M 8.65 69 15.90 8.80
Open Pollinated
Per
week 0 . . 38 1.05 .80 0 . 38 1.05 0.80
Per
season 0 . . 38 40.21
L 28.45 0 . 38 40.21HL 28.45
Local
Per
week 0 . . 22 2.23
O .43 31 2.13 1.20 2.17 2.17HO 0.96
Per
season 0 . . 22 21.09 6.65 31 20.74 7.56 20.89 20.89 7.14
Total
Per
week 49 0.90 0.31 60 1.48
M .89 51 1.94MB 1.08 1.45 1.45 0.93
Per
season 49 12.20 5.65 60 33.20