Mediating effect of trust and coMMitMent
on student LoyaLty
Herry Mulyono
Lecturer of STIKOM Dinamika Bangsa, Jambi Email : [email protected]
aBstract
In facing the competitive market structure, Private University is forced to compete in order to attract students and to preserve them until graduation, continue their study to the higher level and to distribute positive information by word of mouth amongst the community as a form of persuasion to others. The purpose of this research is to analyze : The effect of image, perceived quality, and perceived value on student satisfaction, The effect of Student Satisfaction on Student loyalty mediated by trust and commitment. The source of the data is secondary data taken from The Ministry of National Education (Kemdiknas), Kopertis region III and the primary data is taken from a survey of Private University students in Jakarta, with the number of samples being = 500, analyzed by using Structural Equation Modeling (SEM) Lisrel 8.80.The findings of this
research are: six hypothesis take positive effect and significant. Student loyalty is not influenced by student satisfaction mediated by trust (No mediating), Student loyalty is influenced by student
satisfaction mediated by commitment (full mediating).
introduction
In Portugal, the United States and various other European countries, there has been a substantial
change in the Higher Education sector in the last two decades, which threatens the survival of some
existing institutions. They face a competitive market structure, resulting in a very tight competition
with limited resources to obtain a larger number of students (Alves and Raposo, 2010).
The same situational so occurred in Indonesia, the development of the number of private
universities that increases from year to year is not proportional to the number of students accepted
and the percentage of the sign up/being a student numbers are also too few. It can be seen in Table1
and Table 2, during the last 6 years (2004-2010) there was an increasing number of nearly 500
private universities in Indonesia, while on the other hand, the state universities remained stable
or aren’t increasing. Then again, the number of registrants were volatile, there was no significant
improvement. It is not appropriate to the comparation ratio of the increasing number of private
universities to prospective students accepted.
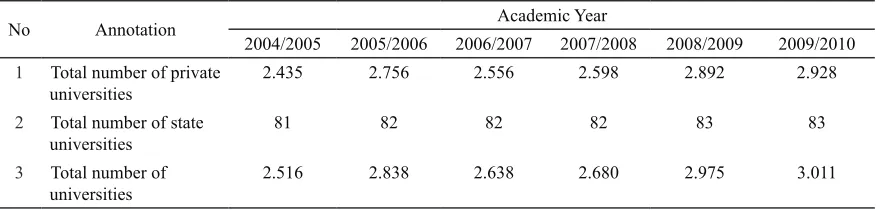
Table1: Total Number of State Universities to Private Higher Education.
No Annotation Academic Year
2004/2005 2005/2006 2006/2007 2007/2008 2008/2009 2009/2010 1 Total number of private
universities
2.435 2.756 2.556 2.598 2.892 2.928
2 Total number of state universities
81 82 82 82 83 83
3 Total number of universities
2.516 2.838 2.638 2.680 2.975 3.011
source: www.psp.kemdiknas
There were also problems on the Evaluation of The Self-evaluation based study program
(EPSBED), in the period of time 2005-2010 the number of drop out students, the number of students
who leave, and the number of non-active students, can be more than12%, which is an indication a
student loyalty issue on Private Higher Education (PTS).
Table 2: The Number of Private Higher Education on the Number of Registrants in the Private Higher Education
No. Annotation Academic Year
2004/2005 2005/2006 2006/2007 2007/2008 2008/2009 2009/2010 1 Total number of
private universities 2.435 2.756 2.556 2.598 2.892 2.928
2 Total number of private universities registrants
562.677 613.318 567.557 773.133 1.204.620 1.203.792
Chart 1 : The Number of Drop Out, Leave, Active and Non-active Students
Source: Information and Reporting Section, Secretariat of Directorate General of Higher Education
Thus, resulting in the institution of private universities to face a competitive market structure,
to force the Private Universities (PTS) to compete in getting the number of students and to preserve
them until the graduation, and proceed to the higher levels (chart 1). Those are the problems which
inspired the researcher i.e. in choosing private universities as the object of the study. Based on this
description, it is very important and interesting to conduct a research entitled “Mediating Effect of
Trust and Commitment on Student Loyalty ”.
the Problems of the study
Based on the description on the background of the study previously, the research questions can
be formulated as follows:
1. How is the effect of the Image on Student Satisfaction?
2. How is the effect of Perceived Quality on Student Satisfaction?
3. How is the effect of Perceived Value on Student Satisfaction?
4 a. How is the effect of Student Satisfaction on Student Loyalty?
4.b. How is the effect of Student Satisfaction on Student Loyalty mediated by Trust?
4.c. How is the effect of Student Satisfaction on Student Loyalty mediated by Commitment?
5. How is the effect of Student Satisfaction on Commitment?
6. How is the effect of Student Satisfaction on Trust?
7. How is the effect of Trust on Student Loyalty?
8. How is the effect of Trust on Commitment?
9. How is the effect of Commitment on Student Loyalty?
the objectives of the study
Based on the background of the study and the problem of the study, this research is aimed to
analyze:
1. The effect of Image on Student Satisfaction.
2. The effect of Perceived Quality on Student Satisfaction.
3. The effect of Perceived Value on Student Satisfaction.
4.a. The effect of Student Satisfaction on Student Loyalty. DO Leave Active
Non Active
The Number of
4.b. The effect of Student Satisfaction on Student Loyalty mediated by Trust.
4.c. The effect of Student Satisfaction on student Loyalty mediated by Commitment.
5. The effect of Student Satisfaction on Commitment.
6. The effect of Student Satisfaction on Trust.
7. The effect of Trust on Student Loyalty.
8. The effect of Trust on Commitment.
9. The effect of Commitment on Student Loyalty.
tHeoreticaL fraMeWorK and HyPotHesis deVeLoPMent
image
The image has been described as subjective knowledge, such an attitude, and a combination of
the different product characteristics with the physical product but still identified with the product
itself (Nguyen & LeBlanc, 1998). LeBlanc and Nguyen (1996) stated that the company’s image is
the result of the aggregation process in which customers compare and contrast the various attributes
of the company. Landrum et al. (1998) stated that the image as the sum of all the beliefs an individual
has towards the university. Kazoleas et al. (2001) stated that individual images can be interpreted as
positive, neutral or negative towards the organization. Kotler and Fox (1995:231) defined that the
image is a set of beliefs, ideas, and impressions of a person to an object. Corporate image is formed
by a diverse group of external stakeholders and can be defined as the summary of the impression or perception of a company (Chun, 2005: 95). Minkiewicz et al. (2011) defined corporate image
as a stakeholder beliefs, perceptions, feelings and attitudes toward the organization. So it can be
concluded that the image is a representation of a person’s mental or overall impression / stakeholders
of the object or attribute.
student satisfaction
Halstead at al. (1994) stated that Satisfaction is an affective response, centered on comparing
the result of the product with some standard set prior to the purchase and measured during or after
consumption. Fornell (1992), satisfaction as a general evaluation based on the result of the product
perceived after the purchase and compared with expectations prior to the purchase.
Elliott and Shin (2002:198), once described student satisfaction as “the favourability of a student’s
subjective evaluation of the various outcomes and experiences associated with education. Higher
Education are increasingly recognizing the service industry and placing greater emphasis on meeting
of the students expectations and their needs (Elliott & Shin, 2002:197). In addition, Kotler (2012)
stated that satisfaction as a person’s feeling of pleasure or disappointment resulting from comparing
a product’s perceived performance (or outcome) to expectations. If the performance perception is
Customers satisfaction can be regarded as the psychological summary evaluation or subjective
summary based on customer experience compared to the expectations (Helgesen &Nesset, 2007).
Definition of satisfaction according to Oliver (2010:8):
Satisfaction is the consumer’s fullfilment response. It is a judgment for a product / service feature, or the product or service itself, provided ( or is providing ) a pleasureable level of consumption- related fullfilment including level of under or over fullfilment.
Perceived Quality
The service quality is known to have contributed to market share and customer satisfaction
(Zeithaml, & Berry, 1985). Thus, knowledge of the service quality has become an important factor
for all organizations controlled. The needs to remain competitive and survive. The service quality is
often conceptualized as the comparison between the service expectation with the actual performance
perceptions (Zeithaml et al., 1990). Parasuraman et al. (1985) stated that: Perceived service quality
as a form of attitude, related to but not equivalent to satisfaction, resulting from a comparison of
expectations with perceptions of performance. There are Five dimensions of service quality suggested
Parasuraman et al. (1988) as follows:
1. Tangibles (physical products), availability of physical facilities, equipment and means of
communication, and the others.
2. Assurance, covers the knowledge, skills, friendly, politeness, and trustworthy nature of the
contact personnel to eliminate the customer’s feeling of doubt and the feeling of being free from
danger.
3. Reliability, the ability to provide the promised services properly and the ability to be trusted.
4. Responsiveness, willingness or desire of the employees to assist and provide services needed by
customers.
5. Empathy, which includes contact personnel and corporate attitudes to understand consumer
needs and difficulties, good communication, personal attention, the ease in communicating or
relationships.
6. Different views on the service quality sometimes led to differences of opinion among different
functional departments. Intangible, the nature of service diversity, making it more difficult
to evaluate the service quality compared to the evaluation of goods, because the customer is
always involved in service production, the needs that differentiate the process of service delivery
(functional quality) and the service outcome (Groonros, 2007). Furthermore, Groonros (2007),
stated that the total level of perceived quality is not only determined by the level of technical
and functional dimensions, but also by the gap between expected and experinced quality.
Therefore Lovelock and Wirtz (2011:406) defines the service quality from the user perspective
Perceived Value
Perceived value has proven to be a difficult concept to be define and measured (Woodruff, 1997).
According to Woodruff (1997:142) “Customer value is a customer’s perceived preference for and
evaluation of those product attributes, attributing performances, and consequences arising from use
that facilitate (or block) achieving the customer’s goals and purposes in usage situations”.
Sanchez-Fernandez and Iniesta-Bonillo (2006:53) stated:
“consumer value is a cognitive-affective evaluation of an exchange relationship carried out by
a person at any stage of the process of purchase decision, characterized by a string of tangible and/or intangible elements which determine, and are also capable of, a comparative judgment conditioned by the time, place and circumstances of the evaluation”.
Kotler (2012:147) also stated that Customer-perceived value (CPV) is the difference the
prospective customer’s evaluation of all the benefits and all the costs of an offering and the perceived alternatives. In a broaden sense, it can be defined that the perceived value is the result or customer benefits that is received related to the total cost (including the price paid plus other costs related to the purchase). Generally, value is the deviation between the perceived benefits and costs (McDougall
and Levesque, 2000). While Liljande and Strandvik (1993:14) stated that the perceived value equals
to the perceived benefits divided by the perceived price. Similarly, the conclusions of Chen and Dubinsky (2003:326), the perceived customer value is “the customers perception of the net benefits obtained in return for the cost incurred in getting the desired benefits. Overall, it can be defined
Zeithamal et al. (2009:528) perceived value is the consumer’s overall assessment of the utility of a
service based on perceptions of what is received and what is given. Therefore, Value is a trade-off
between the most prominent components which is given and the return which is received.
student Loyalty
Building and maintaining the Customer Loyalty is an important part (The heart) of marketing.
Loyalty has been defined by Oliver (2010: 392) as:
. . . a deeply held commitment to rebuy or repatronise a preferred product/service consistently in the future, thereby causing repetitive same-brand or same brand-set purchasing, despite situational influences and marketing efforts having the potential to cause switching behavior.
Customer loyalty is the behavior of customers to maintain a relation with an institute through
purchase of its products and services (Singh & Sirdeshmukh, 2000). Lam et al. (2004: 294) defined
it as ‘a buyer’s overall attachment or deep commitment to a product, service, brand, or organization’.
Customer loyalty can be divided into two categories, one of which is long term, and is an arguably
more valid relationship, the other is a short-term relationship, in which the customer may be switched
if and when the alternatives are relatively better given (Jones & Sasser, 1995 ). Bhote (1996) sees
loyalty as the extent to which customers would recommend the services of one institution to others.
Consumer loyalty can be defined as the repetition purchase behavior that has became a habit, in
object, and are characterized by the absence of external information searching and the alternatives
evaluation (Engel, Blackwell, and Miniard,1995:144).
trust
Trust is one of the variables that has attracted great interest in the academic community. This is
due to the fact that Trust is considered as a strategic variable in marketing (Selnes, 1998). According
to Moorman et al. (1992, 315) trust is defined as a willingness to rely on an exchange partner in Whom one has confidence. In the context of education, and the following definition stated by Morgan
and Hunt (1994), student trust on the institution can be understood as their trust in the integrity
and reliability, and is based on the personal experiences of students with the lecturers
(Hennig-Thurau et al., 2001). Students trust is developed through personal experience with the lecturers and
staff/employees of the institution. If an institution wants to build a long term relationship with a
student, it has to develop trust worthyness as part of the relationship (Mendes et al., 2009). A trust
as the Customer willingness to exchange with others to whom s/he believed (Sirdeshmukh, Singh
and Sabol, 2002). Furthermore, Sirdeshmukh et al. (2002) asserts that trust creates value because it
provides relational benefits derived from the interaction between companies and consumers, and
reduce uncertainty in the consumer (Morgan, Hunt, 1994). According to Kotler and Keller (2012;
225):
Trust is the willingness of a firm to rely on a business partner. It depends on a number of interpersonal and inter organizational factors, such as the firm’s perceived competence, integrity, honesty, and benevolence.
Furthermore, Kotler and Keler (2012:225) concluded that personal interaction with the company
employees, the choice of the overall company and the perception of trust will grow at the same time
with the experience. A company is more likely to be trusted if the following conditions are present:
• Giving total, honest information
• Providing incentives/rewards to the employees for their efforts to meet the customer needs.
• Having a partner relationship with the customers to help them in learning and helping themselves
• Offering a comparison in accordance with the competitive products.
commitment
The development and relationship maintenance among partners in the long term is the main
aim of the relational marketing concept. To create a successful relationship, the commitment among
partner-relationship becomes the determinant. Generally, Marketing literatures see the commitment
as an attachment (adhesion) among the groups that led to the desire for maintaining a relationship.
Commitment is also defined as the exchanging partner which believes that a relationship continuity
with partners is quite important as maximum efforts to preserve them (Morgan and Hunt, 1994) or
the psychological attachment towards one organization (Gruen et al., 2000) in Tjahyadi (2010). In the
organizational behavior literature, commitment itself consists of the aspects of emotional/affective
an attempt to integrate the concept of commitment attitudes in an endeavor to distinguish between
true loyalty, forced or disloyalty (Bloemer and Kasper, 1995; Fullerton, 2005).
There are two types of conceptualization commitment customers, being: affective and calculative
or continuance commitment, having different antecedents, contents and consequences (Zins, 2001)
Calculative commitment is a way that customers are forced against their will to remain loyal (De
Ruyter et al., 1999). In the calculative commitment customers, it can be applied to the organizations
because they feel that ending one relationship involves economic or social sacrifice (Fullerton, 2005). Affective commitment reflects that the customers have taste and engagement with service
providers similarly to the emotional bonding ( Fullerton, 2003). Relationship commitment exists
when the partners believe that the relationship is quite important as the maximum effort to maintain
the long-term relationships. Moorman et al. (1992) defines “relationship commitment as an enduring
desire to maintain a valued relationship. (Porter et al., 1974) also states: “Commitment is of critical
importance in organizational buying behavior and can lead to important outcomes such as customer
Decreased turnover”. According to Tinto (1975), the students commitment is determined by their
integration degree, both academic (participation in society, and universities and committees) and
social (friendships and acquaintances with the fellow students). Thus, commitment refers to the fit
between student abilities, skills, and values and expectations of the university system, demand, and
value.
image and the student satisfaction
Fornell (1992) shows that the image has a strong effect on customer satisfaction. The model
proposed by Clow et al. (1997) suggested that the company image formed by tangibles such as
price, advertisement and word of mouth concludes that the image both directly and indirectly affect
through perceived quality on the satisfaction. Palacio et al. (2002) concluded that the overall image
has an effect on the student satisfaction and affective and cognitive components also have a different
effect on satisfaction. Alves and Raposo (2010) concluded that the university image has a direct and
significant influence in creating the satisfaction process. Minkiewicz et al. (2011) stated that the company image has a significant positive relationship on the customer satisfaction.
The Perceived Quality and the Student Satisfaction
Parasuraman, Zeithmal, and Berry (1994) stated that service quality is part of the basic customer
satisfaction. In handling the relationship between the service quality and satisfaction, they learn the
model developed by Oliver (2010). Oliver’s model combines the two concepts and proposed that
perceived service quality is the antecedent of the satisfaction. The results show that service quality
affects satisfaction. Parasuraman et al. (1988) compare the service quality towards the satisfaction.
They define the quality service as a form of attitude, the overall long-term evaluation, while the satisfaction itself functions as a measure of a specific-transaction. Based on such understanding, it
is considered that the perceived service quality is a global measurement, and so on, the direction of
causality comes from the satisfaction to the service quality (Parasuraman et al., 1988). Athiyaman
(1997) conducted a research of 1432 students from various levels of higher education in Australia.
customer satisfaction. The results of this research showed that there is a high correlation between
students satisfaction and perceived quality measurement. Cronin et al. (2000) considers the quality
as an antecedent to satisfaction. It has been found that positive perceptions of service quality has
a significant influence on the student satisfaction thus, attracting more students through word of mouth (Alves & Raposo, 2010). This study contributes to a conceptual model of service quality as an
antecedent of customer satisfaction (Hu et al., 2009). These five dimensions of service quality (SQ)
that positively correlated with the student satisfaction (Wei, 2011).
the Perceived Value and the student satisfaction
There is a growing recognition that satisfaction positively influenced by the perceived value
(Chen, Dubinsky, 2003). In higher education, the relationship between value and satisfaction have
also been investigated with the findings that the level of student satisfaction is influenced by the
perceived value (Webb & Jagun, 1997; Brown & Mazzarol, 2009).
the relationship of satisfaction and student Loyalty
Bowen and Chen (2001) stated that although their relationship is non-linear, but relationship
between the two constructs is significant. Helgesen and Nesset (2007), stated that the student
satisfaction directly affects the student loyalty. Kandampully and Suhartono (2000) also found
the same conclusion. Satisfaction and loyalty are closely related, and satisfaction is an antecedent
variable of loyalty (Dick, Basu, 1994). Customer satisfaction is positively associated with customer
loyalty (H.H. Chang et al., 2009). Similarly, Rojas-Me’ndez et al. (2009) in his study stated that trust
and commitment is a mediating variable between satisfaction and loyalty.
the relationship of the student satisfaction, commitment, trust and student Loyalty
Customers who had just enjoyed a satisfactory performance will tend to express the
brand-attitudes better and greater loyalty (Grace and O’Cass, 2004; Sivadas and Baker-Prewitt, 2000).
Bansal et al. (2004) said that customer satisfaction is the priority of the affective commitment, and
maintains a better satisfaction, stronger commitment in customer service. Satisfaction has a positive
relationship with the commitment and trust (Tax et al., 1998). Fullerton (2005) develops a similar
argument in maintaining the services quality and also boosting the affective commitment in consumer
settings. It is found that satisfaction has a strong and significant effect on trust, commitment, and
loyalty. According Hennig-Thurau, Langer and Hansen (2001), trust has a positive affect on the
students loyalty, the empirical fact also shows that there is a conceptual connection of trust on the
customers loyalty (Delgado-Ballester and Munuera-Aleman, 2001; Auh, S., 2005; Palmatier et al.,
2006). In Student’s Relationship commitment, the educational institutions have a significant positive
relationship on the students loyalty (Helen and Ho, 2011). With these studies, the hypothesis is:
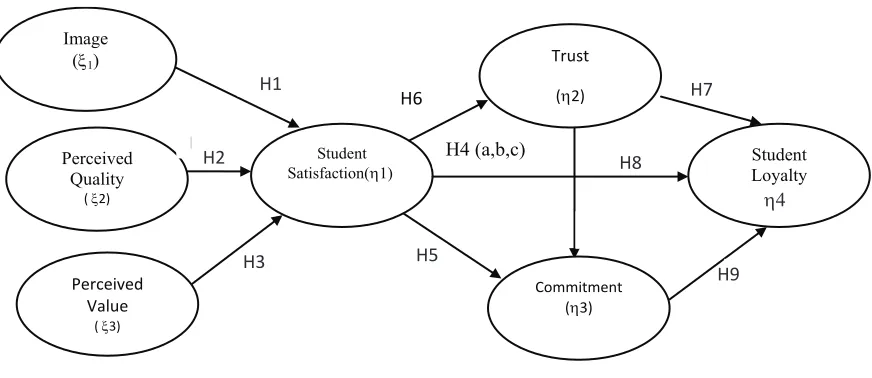
Figure 1. Conceptual model of the Student Loyalty
Based on the previous description, the reseach hypothesis proposed is as follows: H1 : There is a positive and significant effect of image on the student satisfaction
H2 : There is a positive and significant effect of Perceived Quality on the student satisfaction
H3 : There is a positive and significant effect of Perceived Value on the student satisfaction H4a : There is a positive and significant effect of students satisfaction on the student loyalty.
H4b : There is an effect of Student Satisfaction on the students loyalty mediated by Trust
H4c : There is an effect of student satisfaction on the students loyalty mediated by commitment H5 : There is a positive and significant effect of Student Satisfaction on the Commitment
H6 : There is a positive and significant effect of Student Satisfaction on the trust H7 : There is a positive and significant effect of Trust on the students loyalty
H8 : There is a positive and significant effect of Trust on the Commitment
H9 : There is a positive and significant effect of Commitment on the students loyalty
MetHods
This research method is the study of perception/opinion of the research object, in this case, the
object is the private university students, A Likert Scale was used because this scale asks respondents
to show the level of agreement or disagreement on several statements about an object. This scale was
The type of the data in this research is the subjective data (self-report data), thus the research
data was directly taken from its source (primary data) and the secondary data is used as supporting
data. The source of the data being, (1) Secondary data, taken from the Central Statistics Agency
(BPS), Kopertis III and (2) The primary data, the students of the private universities in the Kopertis
III region.
The population used in this research (unit of analysis) are private university students (PTS) in
DKI Jakarta (Kopertis III region) and is conducted by making the level for the population members
into sub-populations.
By dividing the population members into several sub-populations with some existing criteria of
1 to 5, then the research population of Private Higher Education in Table 3 is obtained.
Table 3: Population of Private Higher Education
No. Private Higher Education Population Sample
1 Bina Nusantara University 4390 60
2 Gunadarma University 5544 76
3 Indonusa Esa Unggul University 1097 15
4 Mercu Buana University 4228 58
5 Nasional University 1462 20
6 Persada Indonesia YAI University 3055 42
7 Tarumanagara University 5253 72
8 Trisakti Universiy 5657 78
9 Atmajaya Catholic University 4634 63
10 Pancasila University 1172 16
sum 36492 500
Source : BAN-PT. Kemdiknas.go.id, 2012
resuLt and discussion
Based on the results of data analysis using Structural Equation Model (SEM) and with
applications of software processing tool LISREL8.80 then obtained summary measurement of the fit
Tabel 4 : Model Fit Measurement
GOP Indicaator The Expected Measurement
Estimation
Result Conclusion Absolute Fit Measurement
GFI GFI > 0.90 0.94 Good Fit
RMSEA RMSEA < 0.08 0.074 Good Fit
Incremental Fit Measurement
NNFI NNFI > 0.90 0.89 Marginal Fit
NFI NFI > 0.90 0.98 Good Fit Fit
AGFI AGFI > 0.90 0.84 Marginal Fit
RFI RFI > 0.90 0.85 Marginal FIt
IFI IFI > 0.90 0.91 Good Fit
CFI CFI > 0.90 0.91 Good Fit
Source : Result Lisrel 8.80
Based on table 4 above, only one index fit-model was obtained which is considered in having
a good fit model i.e. GFI, RMSEA, NFI, IFI, dan CFI. The other Index-fit models are under the
congruence measure, but still within the scope of the marginal fit. Marginal fit is the congruence
condition of measurement model under either the criteria of absolute fit measure, or the incremental fit, but it still be continued to the further analysis, because it is close to the criteria of a good fit (Hair et al., 1998 :623). Thus, it can be continued to the further analysis.
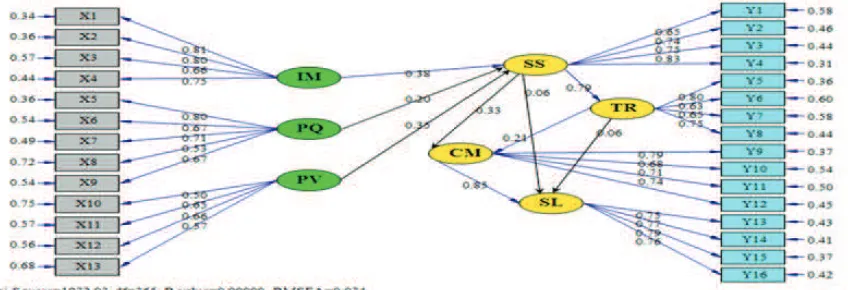
From Structural Equation Model (SEM) by using LISREL 8.80, two models of line diagram
are obtained, they are the standardized and t-values models , each models are shown in the following
figure:
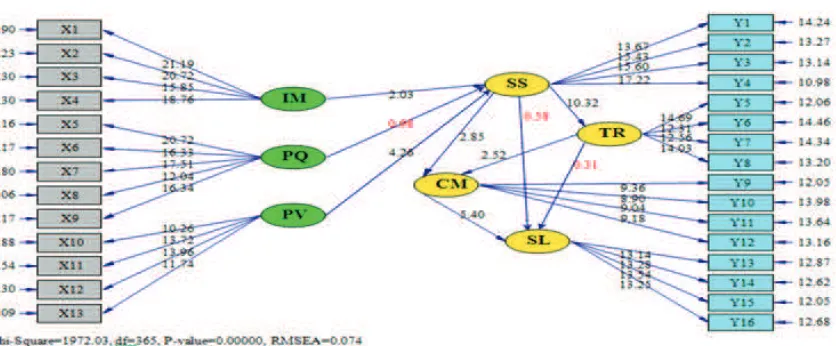
Figure 3 : Result of SEM Calculation (t-value Model)
Based on Figure 3 above, it can be seen that the t values of the indicators forming the latent
variable is greater than 2 (t > 2). According to Hair at al. (1998) if the value of t > 1.98, it can be
categorized that all indicators forming the latent variables (exogenous and endogenous) are significant. While the value of Loading Factor (λ) in Figure 3 above shows that the variable indicators have the
loading factor above 0.50. According to (Hair, 1998), the value of loading factor are categorized
quite significant in forming a latent variable. Thus, refer to the opinion the lambda value (Hair, 1998) and the t-value above, it can be said that the indicators are significant in forming the latent variables.
So that all of the indicators in this research can be further analyzed, since it has been able to form the
latent variables.
There are nine (9) hypothesis tested in this research, based on the testing result from those nine
hypothesis it can be concluded that not all hypotheses (H1 up to H9) are proven / accepted. The
further testing results from each hypothesis can be seen in Table 6 as follows:
Figure above conclude that hypothesis 2 (H2) is not supported by the data (not accepted), it
means that the Perceived Quality is not positively affect and significant on the students satisfaction.
While hypothesis 1 (H1) and hypothesis 3 (H3) are supported by the data (accepted), it means that the
Image and the Perceived Value are proven positive and significantly affect the Students Satisfaction. Based on figures above, it can be concluded that hypothesis 4 (H4a) is not supported by the data (not accepted), it indicates that Students Satisfaction is not positively and significantly affect on the
Student Loyalty. Meanwhile, the hypothesis 5 (H5) and the hypothesis 6 (H6) are supported by the
data (accepted), it means that the Student Satisfaction is proven positively and significantly affect on the Commitment and Trust. Based on figures above, it can be concluded that hypothesis 7 (H7)
is not supported by the data (not accepted), it is indicating that the Student Trust is not positively
and significantly affect on the Student Loyalty. While the hypothesis 8 (H8) is supported by the data (accepted). It means that Trust id proven positively and significantly affect on the Commitment.
Similarly, the hypothesis 9 (H9) is supported by the data (accepted), it means that the Commitment
is proven positively and significantly affect on the Student Loyalty. Based on the results of the
hypothesis testing above, it can be concluded that the Student Satisfaction does not positively and
significantly affect the Commitment directly. as well as the Commitment which is positively and significantly affect the Student Loyalty directly. So, It can be concluded that the Commitment is a
Full Mediating relationship between the Student Satisfaction and the Student Loyalty, or in other
words, it can be concluded that the Commitment is fully mediated (full mediating) the effect of
the Student Satisfaction on Student Loyalty. Thus, the Hypothesis 4b is accepted. Based on the
results of hypothesis testing above, it can be concluded that the Student Satisfaction has positive and
significant affect Trust directly. Nevertheless, Trust is not positively and significantly affect on the Student Loyalty. Similarly, the Student Satisfaction does not positively and significantly affect the
Student Loyalty. So, it can be concluded that the Trust has No Mediating relationship in the Student
Satisfaction on the Student Loyalty, or in other words, Trust does not mediate (no mediating) the
effect of the Student Satisfaction on the Student Loyalty. Thus, the Hypothesis 4c is rejected.
The findings of this research is to increase the Students Loyalty (especially students that would
recommend this institution, as the best educational service provider to their friends/colleagues (Y15)),
then the Student Commitment has to be increased (principally students who have a sense of belonging
to the institutions as knowledge providers (Y9). Meanwhile, to increase the student commitment,
then the Student Satisfaction (mainly those students who are satisfied with the institution as the
best institution to gain knowledge for the future. (Y4)) must be increased. Then, to increase the
Student Satisfaction, next the university image (particularly, because the students always have a good
impression about the existence of universities in producing its graduates (X1) must be increased.
concLusion
1. Image is proven positively and significantly to affect on the Student Satisfaction 2. Perceived Quality is proven not significantly to affect on the Student Satisfaction
3. Perceived Value is proven positively and significantly to affect on the Student Satisfaction 4.a. Students Satisfaction is proven not significantly to affect on the Student Loyalty
4.b. Trust does not mediate (no mediating) the affect of the Student Satisfaction on the Student
Loyalty
4.c. Commitment is fully mediating (full mediating) the affect of the Student Satisfaction on the
Student Loyalty
5. Student Satisfaction is proven positively and significantly to affect on the Commitment 6. Student Satisfaction is proven significantly to affect on Trust
7. Trust is not significantly proven to affect the Student Loyalty
8. Trust is proven positively and significantly to affect on the Commitment
9. Commitment is proven positively and significantly to affect on the Students Loyalty
Managerial implications
Based on the results above, the research findings are obtained i.e. the Students Satisfaction on
1. Students would recommend their institution or university as the best service provider to their
friends /colleagues (Y15).
2. Students have a strong commitment, especially a sense of belonging to their institutions or
university as the knowledge provider (Y9).
3. The student’s Institutions or university really pays attention to their interests in the learning
process (Y5).
4. Students are satisfied with their institutions or university which is the best place to gain knowledge
for their future (Y4).
5. Students always have a good impression about the existence of the university in producing the
graduates (X1).
6. Students consider that the quality of education services they received is comparable to their
investment, if it is compared to the other institutions (X12)
7. To increase the Student Satisfaction, a strong Image that significantly affects the student satisfaction (Priority) is needed, then a strong enough Perceived Value that significantly affect is
required.
Limitation and suggestions for the future research
1. The sample of this Research is taken from some private universities in Kopertis III region
Jakarta, taking into consideration the problem of time and place. The Subsequent researchers
can continue this research by taking the additional samples from other private universities (PTS)
outside the Kopertis Region III in Indonesia, with the availability of time.
2. There are many other factors that affect the Students Loyalty on the private university besides
the variables in this research, such as communication, Student Complaint, Reputation and other
factors which remain to be studied further, Due to there being other factors which have a dominant
effect in increasing the Students Loyalty on the private universities.
3. In this research, the Commitment and Trust variables as mediating variables of Student Satisfaction
on the Students Loyalty, by using Image variable, Perceived Quality and Perceived Value as
the effect variable toward the Student Satisfaction. Then the next researchers can continue this
research on the effect of the Student Satisfaction toward the Students Loyalty mediated with
commitment and trust with different research objects. Thus, the findings of the research will have
a different outcome.
4. The next researcher can conduct research by using the Student Satisfaction as the mediated
variable of the effect of the Image, Perceived Quality, and Perceived Value on the Student
Loyalty. Thus, the possible findings of the research will be different.
5. The Factors of trust and commitment in this research is the intervening factor, so for further
research, the variables can be used as the independent variables on the Student Loyalty variable.
references
Allen, N. J. & Meyer, J. P. 1990. The measurement and antecedents of affective, continuance and nor-mative commitment to the organization, Journal of Occupational Psychology, Vol 63, pp 1-18. Alves, H. 2010. The measurement of perceived value in higher education: a unidimensional
ap-proach.
Alves, H and Raposo, M. 2010. The influence of university image on student behavior, International Journal of Educational Management, Vol 24 No, pp. 73-85.
Athiyaman, A. 1997. Linking student satisfaction and service quality perceptions: the case of the university education, European Journal of Marketing, Vol. 31 No. 7, pp. 528 – 40.
Auh, S. 2005. The Effect of Soft and Hard Service Attributes on Loyalty ; The Mediating Role of Trust, Journal of Service Marketing, Vol. 18 pp. 81-92.
Bansal, H.S., Irving, P.G. & Taylor, S.F. 2004. A Three-Component Model of Customer Commitment to Service Providers, Journal of the Academy of Markerting Science, Vol. 32 pp. 234-250.
Bhote, K.R. 1996. Beyond customer satisfaction to customer loyalty: The key to greater profitability.
Chicago: Amacom.
Bloemer, J. , Ruyter, K.D. and Wetzels,M. 1998. Linking perceived service quality and service loy-alty: a multi-dimensional perspective, European Journal of Marketing, Vol. 33 pp. 1082-1106. Brown,M. and Mazzarol,W. 2009. The importance of institutional image to student satisfaction and
loyalty within higher education, Journal of High Education, vol 58, pp. 81-95.
Chang,H.H, Wang,Y.H. dan Yang, W.Y. 2009. The impact of e-service quality, customer satisfaction and loyalty on e-marketing: Moderating effect of perceived value. Total Quality Management, Vol. 20, pp. 423–443.
Chen, Zhan and Alan, J.D. 2003. A Conceptual Model of Perceived Customer Value in E-Commerce: A Preliminary Investigation, Journal of Psychology & Marketing, Vol 20, pp. 323-347. Chun, R. 2005. Corporate reputation: Meaning and measurement, International Journal of
Manage-ment Reviews, vol. 7 pp. 91-109.
Clow, K., Kurtz, D., Ozment, J. and Ong, B. 1997. The antecedents of consumer expectations of services: an empirical study across four industries, The Journal of Services Marketing, Vol. 11, pp. 230-48.
Cronin, J.J. Jr, Brady, M.K. and Hult, G.T.M. 2000, Assessing the effects of quality, value, and customer satisfaction on consumer behavioral intentions in service environments, Journal of
Retailing, vol. 76 pp. 193-218.
De Ruyter, K., and M. Wetzels. 1999. Commitment in auditor-client rela-tionships: Antecedents and consequences. Accounting, Organizationsand Society, Vol. 24 pp. 57–75.
Delgado-Ballester, E. & Manuera-Aleman, J.L. 2001. Brand Trust in the Context of Consumer Loy-alty, European Journal of Marketing, Vol. 35 pp. 1238-1258.
Dick, A.S and Basu, K. 1994. Customer Loyalty : Toward an Integrated Conceptual Framework, Journal of the Academy of Marketing Science, Vol. 22 pp. 99-113.
Engel, J.F, et al. 1995. Consumer Behavior, 8 th edition, Florida ;The Dryden Press,.
Fornell, C. 1992. A National Customer Satisfaction Barometer: The Swedish Experience, Journal of Marketing, Vol. 56 pp.6-12.
Fullerton, G. 2003. When Does Commitment Lead to Loyalty, Journal of Service Research, Vol 5, pp. 333-344.
________, G. 2005. The Impact of Brand Commitment on Royalty to Retail service Brand, Cana -dian Journal of Administrative Sciences, vol.22 pp.97-110 .
Grace, D.,O’cass, A. 2004. Examining service experiences and post‐consumption evaluations, Jour-nal of Services Marketing, Vol. 18 I pp.450 – 461.
Gronroos, C. 2007. Service Management and Marketing. England: Wiley.
Hair, Jr.J.F., Black, W.C., Babin, B.J., & Anderson, R.E. 1998. Multivariate Data Analysis. New Jersey: Prentice-Hall, Inc.
Halstead, D and Hartman, D. 1994. Multisource Effects on the Satisfaction Formation Process, Jour-nal of the Academy of Marketing Science, vol. 22 pp. 114-129.
Helen, W.S.H. and Ho, W.K. 2011. Building Relationship between Education Institutions and Stu-dents: Student Loyalty in Self-Financed Tertiary Education, IBIMA Business Review, Vol. 2011, pp.1-22.
Helgesen,O. and Nesset, E. 2007. What accounts for students’loyalty? Some field study evidence,
International Journal of Educational Management, vol. 21 pp. 126-143.
Hennig-Thurau,T.,Langer, M.F. and Hansen, U. 2001. Modeling and Managing Student Loyalty, Journal of Service Research, Vol.3, pp.331-344.
Hu,H.H. Kandampully, J. and Juwaheer, T.D. 2009. Relationships and impacts of service quality, perceived value, customer satisfaction, and image: an empirical study. The Service Industries Journal, Vol. 29, pp 111–125.
Jones, T.O., Sasser, W.E. 1995. Why Satisfied Customer Defect, Harvard Business Review, pp. 88-89.
Kamdampully, J and Suhartanto, D. 2000. Customer Loyalty in the hotel Industry. The role of Cus-tomer satisfaction and image, International Journal of Contemporary Hospitality Manage -ment, Vol. 12 pp. 346-351.
Kazoleas, D., Kim, Y. and Moffit, M. 2001. Institutional image: a case study. Journal of Corporate Communications, Vol 6, pp. 205-16.
Kotler, P & Fox, Karen F.A. 1995. Strategic Marketing for Educational Institutions. United State of America : Printice-Hall.
Kotler, P & Keller, K.L. 2012. Marketing Management.United State of America: Pearson.
Lam, S. Y., Shankar, V., Erramilli, M. K. and Murthy, B. 2004. Customer value, satisfaction, loyalty, and switching costs: An illustration from a business-tobusiness service context ,Journal of the Academy ofMarketing Science , pp. 293 – 311 .
Landrum, R., Turrisi, R. and Harless, C. 1998. University image: the benefits of assessment and
modeling. Journal of Marketing for Higher Education, Vol 9, pp. 53-68.
Liljande, V. and Strandik, T. 1993. Estimating zones of tolerance in perceived service quality and perceived sevice value, International Journal of Service Industry Management, Vol 4 pp. 6-28. Lovelock, C & Wirtz, J. 2011. Services Marketing. People, Technology, Strategy. United States of
America: Pearson.
McDougall, Gordon H.G. and Terrence Levesque. 2000. Customer satisfaction with services: putting perceived value into the equation, Journal of services marketing, vol. 14 pp. 392-410. Minkiewicz, J.,Evans, J., Bridson, K and Mavondo, F. 2011. Corporate image in the leisure services
sector, Journal of Services Marketing Vol. 25 pp.190–201.
Moorman, C., Zaltman, G and Deshpande, R. 1992, Journal of Marketing Research, Vol.29, pp. 314-328.
Morgan, R.M. and Hunt, S.D. 1994. The Commitment-Trust Theory of Relationship Marketing, Journal of Marketing, Vol. 58 pp. 20-38.
Nguyen, N. and LeBlanc, G. 2001. Image and Reputation of higher education institution in student’s retention decisions., The international journal of educational management, Vol 15, pp. 303-311.
Oliver, R.L. 2010. Satisfaction: A Behavioral Perspective On The Consumer. United States of Amer-ica: M.E. Sharpe.
Palacio, A., Meneses, G. and Pe´rez, P. 2002. The configuration of the university image and its rela -tionship with the satisfaction of students. Journal of Educational Administration,Vol 40 , pp. 486-505.
Palmatier,R.W., Dant,R.P., Grewal,D. & R. Evans, K.R. 2006. Factors Influencing the Effectiveness
of Relationship Marketing: A Meta-Analysis.
Parasuraman, A., Valarie, A., Zeithaml and Leonard, L.B. 1994. Reassessment of Expectations as a Comparison Standard in Measuring Service Quality: Implications for Further Research, Jour-nal of Marketing Vol.58.pp. 111-124.
___________, A., Zeithaml, V. A., & Berry, L. L. 1985. A conceptual model of service quality and its implications for future research. Journal of Marketing, vol 49, pp. 41-50.
___________, A., Zeithaml, V., & Berry, L. 1988. SERVQUAL: a multiple item scale for measuring consumer perceptions of service quality. Journal of Retailing, vol 6(1), pp. 12-36.
Porter, L.W., Steers, R.M., Mowday, R.T., and Boulian, P.V. 1974. Organizational commitment, job satisfaction, and turnover among psychiatric technicians, Journal of Applied Psychology. Vol 59, pp. 603-609.
Rojas-Me´ndez, J.I., Vasquez-Parraga, A. Z., Kara, A and Cerda-Urrutia, A. 2009. Determinants of Student Loyalty in Higher Education: A Tested Relationship Approach in Latin America, Latin American Business Review, Vol. 10, pp.21–39.
Sanchez-Fernandes, R. And Inesta-Bonillo, M.A. 2006. Consumer Perception of Value : Literatur Review and A New Conceptual Framework, Journal of Consumer Satisfaction, Dissatisfac -tion, and Complain Behaviour, Vol 19, pp. 40-58.
Selnes, F. 1998, Antecedents and consequences of trust and satisfaction in buyer-seller relationships, European Journal of Marketing, Vol. 32 , pp. 305-22.
Sivadas, E., Baker‐Prewitt, J. 2000. An examination of the relationship between service quality, cus-tomer satisfaction, and store loyalty, International Journal of Retail & Distribution Manage-ment, Vol. 28 , pp.73 – 82
Tax, S.S., Brown, S.W. & Chandrasekaran, M. 1998. Customers Evaluations of Service Complain Experiences: Implication for Relationship Marketing, Journal Of Marketing, Vol. 62 pp. 60-76.