Refer to Important disclosures in the last page of this report
Stock DataTarget price (Rp) Rp3,700
Prior TP (Rp) Rp3,900
Shareprice (Rp) Rp3,450
Upside/downside (%) +7.2
Sharesoutstanding (m) 99,062
Marketcap. (US$ m) 23,041
Republic of Indonesia 52.1%
Bank of New York Mellon 6.1%
Public 41.8%
Estimate Change; Vs. Consensus 18F 19F Latest EBITDA (Rpbn) 60,101 62,239
Vs. Prior EBITDA (%) -4 -7
Vs. Consensus (%) -4 -12
Source: Bloomberg
Paula Ruth
PT Indo Premier Sekuritas [email protected] +62 21 5793 1168
Navigating transition and recovery
Less disruption to data pricing improvement.
Employees’ retirement may ease margin decline
Only minor impact from Rupiah weakness in short term.
Maintain HOLD TP Rp3,700, at +1STD 7-yr mean.
Less pricing disruption.
Telkomsel (Tsel) indicated it recently experienced
healthier competition vs. 1H18, thanks to less pricing disruption from observed
starter pack market so far. Although certain area might be more competitive than
average,
Tsel plans to keep premium (20-30%; sometimes max. 40% in
competitive areas) vs. competitors. Tsel may increase data pricing again between
Oct-Nov (depend on competition, incl. small players). We expect
TLKM’s
2H18
revenue to grow +9%YoY, as non-Telkomsel continue its strong revenue growth
(implying 2H18F +26%YoY), while
Tsel’s revenue slightly recover to +4%YoY in
2H18F.
Employees’
retirement may ease margin decline
. Company said c
.
7K
personnel (mostly non-Tsel; c.2K personnel/year in 2018F-20F), accounted c.
30% of FY17 TLKM’s total personnel, will
enter normal retirement during
2018F-25F. We expect personnel expense to revenue ratio to gradually decline to 9% in
2023F from 11% in 2018F. We still estimate TLKM’s EBITDA margin to decline to
43% in 2020 from 45% in 2018, but stabilize temporarily during 2021F-23F.
Manageable forex risk in short term.
We estimate 2018F/19F capex paid
(settled) in USD portion of total capex at 17% for TLKM’s group and 10% for Tsel,
based on discussion with company. Tsel might also be able to negotiate Rupiah
weakness impact to its USD-paid capex if forex rate reached certain threshold,
according to company. In terms of debt, TLKM’s USD exposure is relatively small
at c.3%, similar to ISAT (c. 2%), but below EXCL (c.31%) as of 2Q18.
Reduce TP by 5% to Rp3,700
–
Maintain HOLD.
We use DCF to arrive to our
TP with 10% WACC. We decreased TP by 5% mainly because we cut 18F/19F
EBITDA by 4/7% (slower margin recovery). TLKM trades at 8.5x 19F EV/EBITDA
(adj. with ownership in Tsel). Current 19F EV/EBITDA is at 7% premium to avg.
regional excl. Indonesia, but 19F P/E is similar (Figure 10). Our TP translates to
8.9x 19F EV/EBITDA, at +1STD of 7-yr mean. We put a Hold to TLKM as we view:
1) Although competition is healthier vs. 1H18, 2018F-19F data pricing might yet
enough to expand blended EBITDA margin in 2019F; 2) Magnitude of data pricing
increase in outer Java might be limited for now as est. smartphone penetration
there is still at c.50%. Upside risk: Data pricing, cost saving effort, Indihome.
Telkom
(
TLKM IJ
)
14 September 2018
Company Update
HOLD
(Unchanged)
Year To 31 Dec 2016A 2017A 2018F 2019F 2020F
Revenue(RpBn) 116,333 128,256 135,161 144,124 157,198
EBITDA(RpBn) 59,498 64,609 60,101 62,239 67,103
Source: TLKM, IndoPremier Share Price Closing as of : 13 September 2018
2
Refer to Important disclosures in the last page of this report
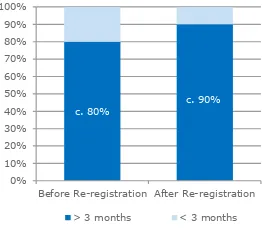
Fig. 1: Tsel’s subscriber base and ARPU Fig. 2: Tsel’s subscriber mix based on “length of stay” period
38
Subscriber - LHS Implied ARPU - RHS
We expect subscriber base still slightly decline in 2H18F, but ARPU to increase as subscriber adjusting behaviour to operators’ marketing and pricing strategy post- registration of prepaid card.
c. 80%
Before Re-registration After Re-registration
> 3 months < 3 months
Subscriber mix signals better loyalty after prepaid card registration (2Q18) vs. before (1Q18). This includes impact from lower number of subscriber base to 178mn in 2Q18 after blocking period vs. 193mn in 1Q18.
Source: Company, IndoPremier Source: Company, IndoPremier
Fig. 3: Tsel, Indihome, and other non-Telkomsel revenue Fig. 5: TLKM’s Opex without D&A breakdown (2Q18)
35%
Telkomsel - LHS Indihome (implied) - LHS Non-Telkomsel excl. Indihome (implied) - LHS TLKM's cnsl. EBITDA margin (RHS)
Personnel
Source: Company, IndoPremier Source: Company, IndoPremier
Fig. 5: EBITDA Telkomsel and implied non-Tsel (with Indihome) Fig. 6: TLKM’s hist-fw. EV/EBITDA (adj. to ownership in Tsel)
0
TLKM Fw-EV/EBITDA Fw-EV/EBITDA avg (LHS)
Fw-EV/EBITDA + 1 STD (LHS) Fw-EV/EBITDA - 1 STD (LHS)
Note: Until 7 Sep 2018 at 8.1x
-2STD 4.5 -1STD 6.0 Avg. 7.5 +1STD 8.9 +2STD 10.4
3
Refer to Important disclosures in the last page of this report
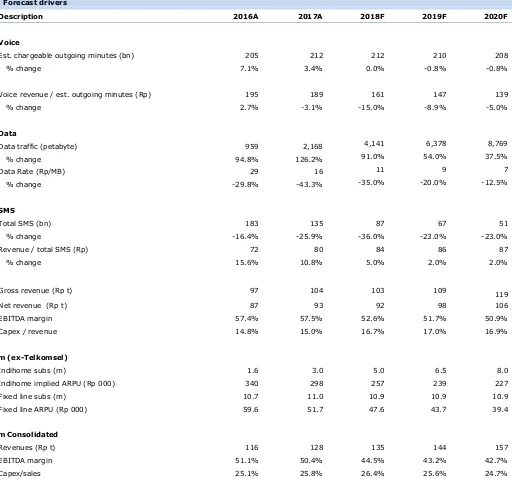
Fig. 7: Forecast drivers
Description 2016A 2017A 2018F 2019F 2020F
Aim for further monetization
Telkomsel said industry shift to renewal market from starter pack so far has
helped to ease competition. The company is still monitoring customer behaviour
and competition in 2H18F, which might affect view for 2019F. There might be
further increase in Tsel’s data pricing between October and November, as part of
seasonal adjustment, but it will depend on competition situation, incl. from small
telco players. Tsel said 2Q18F margin drop was due to mixed factor, but mainly
due to slowing down in top-line during prepaid card registration. Thus, we expect
Tsel margin to recover gradually in 2H18F along with top-line, supported also with
cost saving, i.e. network digitalization cost and more efficient marketing (renewal
market generally needs less marketing than starter pack market).
4
Refer to Important disclosures in the last page of this report
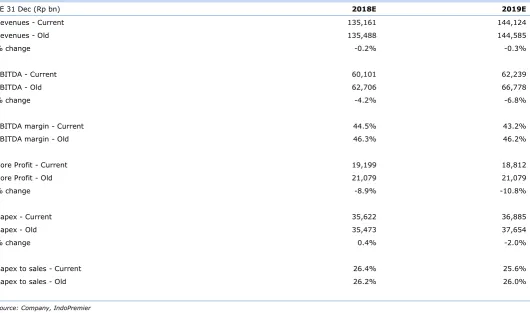
Fig. 8: Change in estimates – TLKM consolidated
YE 31 Dec (Rp bn) 2018E 2019E
Fig. 9: Risk-free-rate and terminal EV/EBITDA assumption
Risk-Free rate 8.0%
Equity market risk premium 6.0%
Beta 0.75
Cost of equity 12.5%
Post-tax cost of debt 6.0%
Debt/Capital ratio 38.7%
WACC 10.0%
Terminal EV/EBITDA Telkomsel: 8x
Non-Telkomsel: 6x
5
Refer to Important disclosures in the last page of this report
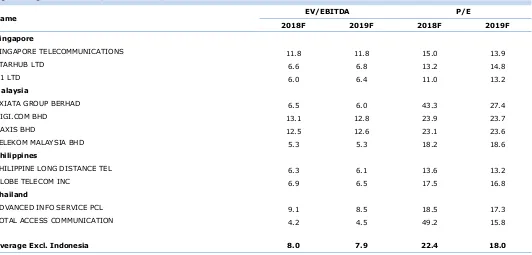
Fig. 10: Regional telcos’ EV/EBITDA and P/E ratios
Name EV/EBITDA P/E
2018F 2019F 2018F 2019F
Singapore
SINGAPORE TELECOMMUNICATIONS 11.8 11.8 15.0 13.9
6
Refer to Important disclosures in the last page of this report
Year To 31 Dec (RpBn) 2016A 2017A 2018F 2019F 2020F
Income Statement
Net Revenue 116,333 128,256 135,161 144,124 157,198
Cost of Sales 0 0 0 0 0
Gross Profit 116,333 128,256 135,161 144,124 157,198
SG&A Expenses (75,367) (84,093) (95,155) (103,902) (113,990)
Operating Profit 40,966 44,163 40,006 40,221 43,209
Net Interest (1,094) (1,335) (1,880) (2,494) (3,325)
Cash & Equivalent 31,238 27,318 20,380 16,896 13,920
Receivable 7,900 9,564 9,880 10,535 11,491
Inventory 584 631 680 725 791
Other Current Assets 7,979 10,048 10,155 10,598 11,460
Total Current Assets 47,701 47,561 41,095 38,755 37,662
Fixed Assets - Net 114,498 130,171 146,979 163,299 179,857
Goodwill 0 0 0 0 0
Non Current Assets 15,565 18,604 28,922 36,031 46,459
Total Assets 179,611 198,484 219,293 240,540 266,604
ST Loans 911 2,289 1,422 1,739 1,897
Payable 13,690 15,791 17,171 17,657 19,259
Other Payables 20,640 22,087 22,830 24,190 26,274
Current Portion of LT Loans 4,521 5,209 6,406 3,053 4,284
Total Current Liab. 39,762 45,376 47,787 46,638 51,713
Long Term Loans 26,367 27,974 37,568 49,515 56,231
Other LT Liab. 7,938 13,004 15,576 20,084 26,523
Total Liabilities 74,067 86,354 100,931 116,238 134,467
Equity 7,769 7,817 7,817 7,817 7,817
Retained Earnings 76,615 84,896 87,486 91,898 97,503
Minority Interest 21,160 19,417 23,058 24,587 26,818
Total SHE + Minority Int. 105,544 112,130 118,362 124,303 132,137
Total Liabilities & Equity 179,611 198,484 219,293 240,540 266,604
7
Refer to Important disclosures in the last page of this report
Year to 31 Dec 2016A 2017A 2018F 2019F 2020F
Cash Flow
Net Income (Excl.Extraordinary&Min.Int) 29,172 32,701 28,364 28,067 29,672
Depr. & Amortization 4,628 3,479 18,814 20,564 22,269
Changes in Working Capital 4,154 (336) 1,387 656 1,680
Others (10,123) (9,290) (7,508) (7,832) (7,530)
Cash Flow From Operating 27,831 26,554 41,057 41,456 46,090
Capital Expenditure (18,237) (22,191) (45,940) (43,993) (49,255)
Others 3,023 431 3,278 776 606
Cash Flow From Investing (15,214) (21,760) (42,662) (43,217) (48,650)
Loans (2,813) 3,673 9,924 8,911 8,105
Equity 1,996 0 (1,738) 0 0
Dividends (13,547) (16,609) (14,400) (14,109) (14,785)
Others 3,291 414 5,775 3,555 5,571
Cash Flow From Financing (11,073) (12,522) (438) (1,642) (1,109)
Changes in Cash 1,544 (7,728) (2,043) (3,403) (3,669)
Financial Ratios
Gross Margin (%) 100.0 100.0 100.0 100.0 100.0
Operating Margin (%) 35.2 34.4 29.6 27.9 27.5
Pre-Tax Margin (%) 32.8 33.3 28.2 26.2 25.4
Net Margin (%) 16.6 17.3 14.2 13.1 12.5
ROA (%) 11.2 11.7 9.2 8.2 7.8
ROE (%) 19.5 20.3 16.7 15.5 15.4
ROIC (%) 18.6 19.3 15.2 13.4 12.7
Acct. Receivables TO (days) 24.7 24.9 26.3 25.9 25.6
Acct. Receivables - Other TO (days) 0.0 0.0 0.0 0.0 0.0
Inventory TO (days) 0.0 0.0 0.0 0.0 0.0
Payable TO (days) 0.0 0.0 0.0 0.0 0.0
Acct. Payables - Other TO (days) 0.0 0.0 0.0 0.0 0.0
Debt to Equity (%) 30.1 31.6 38.4 43.7 47.2
Interest Coverage Ratio (x) 0.1 0.1 0.1 0.1 0.1
Net Gearing (%) 1.9 9.2 21.1 30.1 36.7
Head Office
PT INDO PREMIER SEKURITAS
Wisma GKBI 7/F Suite 718
Jl. Jend. Sudirman No.28
Jakarta 10210 - Indonesia
p +62.21.5793.1168
f +62.21.5793.1167
INVESTMENT RATINGS
BUY : Expected total return of 10% or more within a 12-month period HOLD : Expected total return between -10% and 10% within a 12-month period SELL : Expected total return of -10% or worse within a 12-month period
ANALYSTS CERTIFICATION.
The views expressed in this research report accurately reflect the analysts personal views about any and all of the subject securities or issuers; and no part of the research analyst's compensation was, is, or will be, directly or indirectly, related to the specific recommendations or views expressed in the report.
DISCLAIMERS