7(2), 2018: 22-29
Pa
g
e
22
Research in Business and
Social Science
IJRBS Vol 7 No 2, ISSN: 2147-4478
Contents available at www.ssbfnet.com/ojshttps://doi.org/10.20525/ijrbs.v7i2.879
The Influence of Community Behaviour on the
Quality of Tourism Services at Toba Lake North
Sumatera
Erika Revida
Professor Departement of Public Administration, Universitas Sumatera Utara, Indonesia
Asima Yanti Siahaan
Asssoc. Prof. Departement of Public Administration, Universitas Sumatera Utara
Sukarman Purba
Assoc. Prof. Departemen of Education Management, Universitas Negeri Medan
Abstract
This research aim as analyzing the influence of community behaviour on the quality of tourism services at Toba Lake North Sumatera. The method of research used mixed between quantitative and the qualitative research. Research sample were taken from 120 head of family at Toba Lake North Sumatera. The technique of data collection of research used documentation study, questionnaires, interviews and observations. The technique data analysis used Simple and Multiple Regression Analysis. The research results showed that there was positive and significant influence between community behavior on the quality of tourism services at Toba Lake North Sumatera. The recommendations of the research stated that it was important to enhance the quality of tourism services by enhancing knowledge, attitude and action about the quality of tourism services so that the quality of tourism services will be increased, and it need to establish tourism school at the Toba Lake North Sumatera
Key words: Community Behaviour, Knowledge, Attitude, Tourism Services
JEL classification:H41,H83,Z32 Submitted: 19.09.2018 - Accepted: 19.10.2018
Introduction
Peer-reviewed Academic Journal published by SSBFNET with respect to copyright holders.
Pa
g
e
23
and resources, promote culture, lift the image of the nation, homeland, strengthen the identity and unity of the nation and, strengthen friendship among nations.
The destination of tourism development above will be achieved if accompanied by positive community behavior towards tourism itself. Behavior is the response of an individual to the stimulation obtained either from within or outside of himself. Behavior is activity done by society in everyday life. According to Notoamidjoyo (2010) behavior was determined by knowledge, attitude and action of people. Thus, the community behavior meana all kind of experience as well as human interaction with the environment manifested in the form of knowledge, attitudes and actions about something around him. Community behavior in providing tourism services are all activities and human interaction measured through knowledge, attitude and actions about something.
Community behavior towards something will impact on the actions and is the result of all kinds of experiences and interaction of community with their environment that manifests in the form of knowledge, attitudes and actions. In other words, behavior is the response or reaction of an individual to a stimulus that comes from outside or from within him. This response can be passive or active. By this research community behavior can be formulated as a form of experience and interaction of community with their environment, especially regarding knowledge, attitudes and action about tourism service. Active behavior can be seen, while passive behavior is not visible, such as knowledge, perception, or motivation. Some experts distinguish behavioral forms into three domains, namely knowledge, attitudes, and actions or often we hear in terms of knowledge, attitude, practice (Sarwono, 2004).
Tourism services could be stated that the better of community behavior would be the better of the quality of tourism services provided to tourists and vice versa. According to Tjiptono (1997) the quality of tourism service contains 7 (seven) terms that were conformity with requirements, suitability for use, continuous improvement, free from damage, fulfillment of customer requirement since beginning and every time, doing everything right from the beginning, something that can make customers happy. There were several studies that support this research done by Harahap (2012), Sulistiyani (2010), and Rahadhini, et al (2013).
Actually, there were several programs that had been done by the government to enhance the quality of tourism services such as education and training of tourism services, providing financial assistance, tourism service certification programs and other educations and training. But, in fact, the quality of community tourism service not as an expected. There were many services such as not friendly, not responsive to the needs of tourists, such as behavior of cheat tourist, littering, and others. This was the reason why the research done by the tittle "The Influence of Community Behaviour on The Quality of Tourism Services at Toba Lake North Sumatera.
Research and Methodology
This study used combined quantitative and qualitative research (Cresswell, 2012). Samples of this research were the community the head of family who lives in Toba Lake North Sumatera as many as 120 head of family. Data was collected by documentation study, questionnaire, interview and observation. Technique of data analysis done with Simple and Multiple Regression Analysis. In measuring the variable of quality of community tourism service Tjiptono’s theory (1997) that were conformity with requirements, suitability for use, continuous improvement, free from damage, fulfillment of customer requirement since beginning and every time, doing everything right from the beginning, something that can make customers happy was used.
Result and Discussion
Peer-reviewed Academic Journal published by SSBFNET with respect to copyright holders.
Pa
g
e
24
Table 1: The Summary of Descriptive Analysis Results of Research Variables
Descriptions Community Behaviour
Ideal Deviation Standard 40 20
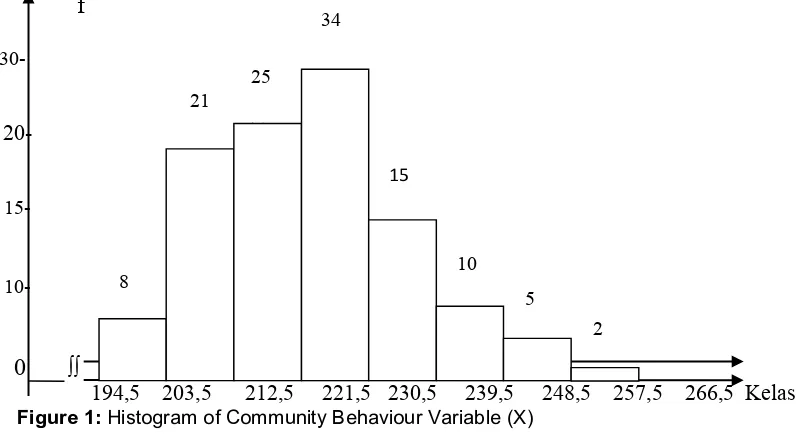
Table 2: Frequency Distribution of Community Behavior Variable (X)
Class Class Interval
Based on the table 2, the frequency distribution seen that the average score was in grade 4, about 45% of the answer of respondents were below the average and about 55% of the answer of respondents were on average and above average. Next, the histogram figure of the community behavior variable were shown in the following figure 1.
Figure 1: Histogram of Community Behaviour Variable (X)
Peer-reviewed Academic Journal published by SSBFNET with respect to copyright holders.
Pa
g
e
25
Furthermore, the description data of The Quality of Tourism service variable was shown at table 3 as follow.
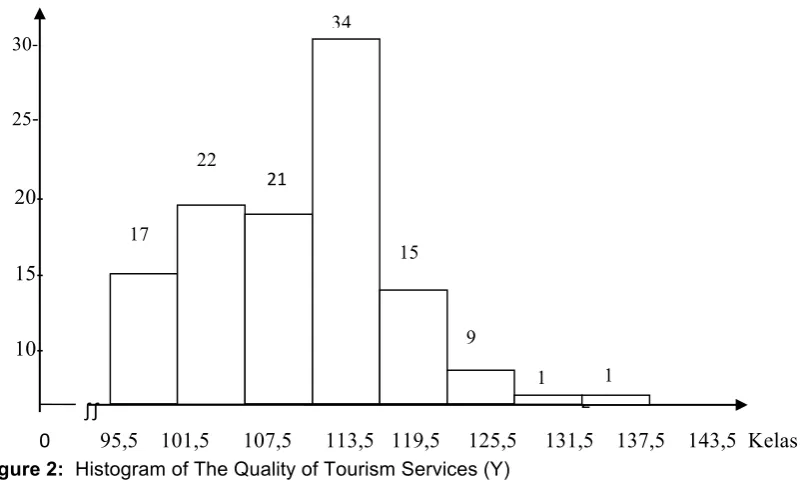
Table 3: Distribution of the Quality of Tourism Service Variable (Y)
Class Class Interval
Based on the table 3 the frequency distribution showed that the average score was in grade 4, about 50% of the respondents' answers were below the average and about 50% of the respondents were on average and above average. Next, the histogram of the quality of tourism services variable was shown in the following figure 2.
Figure 2: Histogram of The Quality of Tourism Services (Y)
Furthermore, from the data above it could be described the criteria tendency level of Community Behavior variable (X) as presented in table 4 below.
Table 4: The Trend Level of Community Behaviour (X)
Peer-reviewed Academic Journal published by SSBFNET with respect to copyright holders.
Pa
g
e
26
Table 4 it reveals there were as many as 16 (13.33%) respondents stated Community behavior was in good category, and as many as 104 (86.67%) respondents stated Community behavior was in sufficient category. Thus it could be concluded that The Community Behavior of was in sufficient category. Next, the trend level of The quality of Tourism Service variable presented in the following table 5 below.
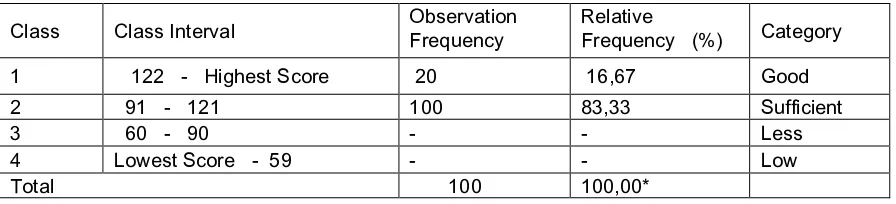
Table 5: The Trend Level of The Quality of Tourism Service (Y)
Class Class Interval Observation Frequency Relative Frequency (%) Category
1 122 - Highest Score 20 16,67 Good
2 91 - 121 100 83,33 Sufficient
3 60 - 90 - - Less
4 Lowest Score - 59 - - Low
Total 100 100,00*
Based on the table 5 it could be stated that there were as many as 20 (16.67%) of respondents stated that the quality of tourism service was in good category, and 100 (83.33%) respondents stated sufficient category. Thus it could be concluded that the quality of tourism services were in the sufficient category. Before going to the hypothesis test first done the test of requirement analysis namely normality and linearity test between pairs of research variable relationships as follow at table 6.
Table 6: Normality Test with Kolmogorov-Smirnov Test
Community Behaviour
The Quality of Tourism Service
N 120 120
Normal Parametersa,b Mean 223.55 112.69
Deviation Standard 14.802 9.271
Most Extreme Differences Absolute .073 .080
Positive .073 .080
From the calculation in the table above turned out to be the value of Asymp. Sig (2-tailed) > 0.05, thus it could be concluded that the data distribution of each research variable does not deviate from the normal distribution. It means that the assumption of normality has been fulfilled.
Table 7: Summary of Linearity Test Results and Meaning Test
No
The Relations
between Variable
Linierity Test Meaning Regression Test
Fh Sig. Status Fh Sig. Status
1 X with Y 0,484 0,996 Linier 59,399 0,000 Signifikan
Furthermore, the result showed that the calculation for the large linearity test value Fh significance value (sig)
> 0.05. It means that the pair of variables have a linear relationship, and the value of Fh had a significance
Peer-reviewed Academic Journal published by SSBFNET with respect to copyright holders.
Pa
g
e
27
Table 8: Coefficient Regression Equation Ŷ = 31,67 + 0,36X
Model Unstandardized Coefficients Standardized
a. Dependent Variable: The Quality of Toourism Services
The regression equation showed Ŷ = 31.67 + 0.36X. The Quality of tourism services increased the variable of community behavior will be increased too. Every increased of one score of Quality of Tourism Services followed by an increase of 0.36 score Community behavior on the constant 31.67. Next the result of significant test shown at the table 9 below.
Table 9: ANAVA Significance Test of Regression Equation Ŷ = 31,67+ 0,36X
Model Sum of Squares df Mean Square F Sig.
1 Regression 3424.532 1 3424.532 59.399 .000a
Residual 6803.060 118 57.653
Total 10227.592 119
a. Predictors: (Constant), Community Behaviour b. Dependent Variable: Quality of Tourism Services
From ANAVA table above, the significance test of regression coefficient significance was significant because the value of Fcount= 59,39 was bigger than Ftable = 8,96 at α = 0,01. Correlation coefficient rxy = 0,579. When
compared with the rtable value at α = 0.01 of 0.210, it turned rcount> rtable or 0.579> 0.210. For the test with ttest
was obtained tcount of 9.21, when compared to the ttable value at α = 0.01 obtained 2.36, then the value tcount >
ttable or 7.07> 2.36. Then it could be concluded that the correlation coefficient was means. Based on the
results of these calculations, the hypothesis Ho rejected and Ha accepted, or Community behavior directly positive and significant influence on the quality of tourism services. Thus the hypothesis of this research was relevant to the research conducted by Harahap (2012)6) which concluded there was influence Quality of service, Price and Promotion of Visitor Satisfaction at Museum Ronggowarsito Semarang. This research also relevant with the research of Sulistiyani (2010)and Rahadhini and Desma (2013). Furthermore, the large contribution of community behavior (X) to the quality of tourism services (Y) was obtained by squaring the correlation coefficient which was the coefficient of determination. The coefficient of determination ryx2 =
(0.579) 2 x 100% = 33.52%. It means that 66.48% of variation Quality of Tourism Service (Y) could be explained by the variation of Community Behavior (X), and the remaining 66.48% determined by other variables. Next, to know more influential factors from indicator of community behavior to the quality of tourism service done by counting influence of each indicator from community behavior to the quality of tourism services. The results of the descriptive analysis of each indicator of the community behavior variable were presented in table 10 below.
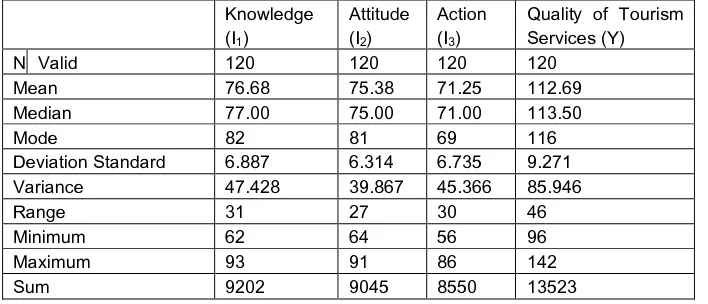
Table 10: Summary of Decrisptive Analysis of Every Indicator of Community Behaviour
Knowledge
Deviation Standard 6.887 6.314 6.735 9.271
Variance 47.428 39.867 45.366 85.946
Range 31 27 30 46
Minimum 62 64 56 96
Maximum 93 91 86 142
Peer-reviewed Academic Journal published by SSBFNET with respect to copyright holders.
Pa
g
e
28
Furthermore, causal relationships between indicators of community behavior (knowledge, attitude and action) with the quality of tourism services were shown in Figure 1 below.
The great influence of each indicator of community behavior ((knowledge, attitude and action) on the quality of tourism services was shown in table 11 below.
Tabel 11: Multiple Regression Equation Ŷ = 33,91 + 0,36X1 + 0,38X2 + 0,30X3
a. Dependent Variable: Quality of Tourism Services
From the table 11 it could be seen that the influence of knowledge on quality of tourism service was 0.273, the influence of attitude toward quality of tourism service was 0,2463, and the influence of action toward quality of tourism services was 0,219. The direct contribution of each indicator of community behavior on quality was presented in table 12 below.
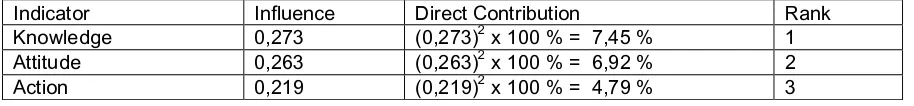
Table 12: Summary of Direct Contribution of Each Indicator of Community Behavior on the Quality of Tourism Services
Indicator Influence Direct Contribution Rank
Knowledge 0,273 (0,273)2 x 100 % = 7,45 % 1
Attitude 0,263 (0,263)2 x 100 % = 6,92 % 2
Action 0,219 (0,219)2 x 100 % = 4,79 % 3
From the three indicators of community behavior, knowledge factors had stronger influence than attitude and action factor on the quality of tourism services.
Conclusion
Peer-reviewed Academic Journal published by SSBFNET with respect to copyright holders.
Pa
g
e
29
better of quality of tourism service at Toba Lake North Sumatera. The trend level of community behaviour and quality of tourism services at Toba Lake North Sumatera was in sufficient category.
From the three indicators of community behaviour, knowledge was large influence than attitude and action at Toba Lake North Sumatera. It was necessary to enhance community behavior by disseminating information the importance of community behaviour so that the quality of tourism services will be increased.
The quality of tourism services needs to be improved through improving the quality of education and training as well as relevant courses. There should be a certification of tourism human resources so that the quality of tourism services at Toba Lake North Sumatera increased.
Acknowledgment
This research was funded by Directorate of Research and Community Service Directorate General Strengthening Research and Development of Research, Technology and Higher Education Ministry in accordance with research funding agreement and community service for fiscal year 2018. Therefore, I would like to thank the Directorate of Research and Community Service Directorate General Strengthening Research and Development of Research, Technology and Higher Education Ministry of Indonesia and Universitas Sumatera Utara.
References
Creswell, J. W. (2002). Research Design. Qualitative & Quantitative Approaches. New York: Sage Publication, Inc.
Harahap, K.A.S. E. (2012). Analisis Pengaruh Kualitas Pelayanan, Harga, Dan Promosi Terhadap Kepuasan Pengunjung Di Museum Ronggowarsito Semarang. Jurnal Dinus. Universitas Dian Nuswantoro. Semarang: http://Eprints.Dinus.Ac.Id/8885/1/Jurnal_13934.Pdf.com. Diakses tanggal 20 Mei 2018.
Notoatmodjo (2010). Ilmu Perilaku Kesehatan. Jakarta: PT Rinneka Cipta.
Rahadhini, L. Marjam, D.(2013). Pengaruh Citra Objek Wisata Umbul Tlatar Boyolali Terhadap Loyalitas Pengunjung Dengan Kepuasan Sebagai Variabel Mediasi. Universitas Slamet Ridaya Surakarta. www.e-jurnal.com/2013/12/pengaruh-citra-objek-wisata-umbul.html. Diakses tanggal 19 Mei 2018.
Sarwono, W. S.( 2004) Psikologi remaja. Jakarta. PT RajaGrafindo Persada.
Sudjana (2003) Statistik. Teknik Analisis Regresi dan Korelasii. Bandung : Tarsito.
Sulistiyani, E. (2010). Membangun Loyalitas Wisatawan Melalui Peningkatan Kualitas Obyek Wisata, Promosi dan Kepuasan Wisatawan di Kawasan Wisata Tawangmangu Karanganyar. Politeknik Negeri Semarang. Journal Publish. www.polines.ac.id/ragam/indexfiles/jurnalragam/paper7.com. Diakses tanggal 20 Mei 2018.