Volume 26, Number 2, 2011, 201 – 218
DO OVERCONFIDENT INVESTORS TRADE EXCESSIVELY IN THE
CAPITAL MARKET? EVIDENCES IN AN EXPERIMENTAL
RESEARCH SETTING
Mahatma Kufepaksi
University of Lampung (mahapaksi@yahoo.com)
ABSTRACTS
The existence of overconfident investors in capital markets has been the subject of much researches in the past. Using the market data, these previous researches demonstrates that overconfident investors tend to trade excessively, leading to losses. The current experimental research addresses these issues in the Indonesia Capital Market. According to its methodology, participants are classified into three groups based on their score of overconfidence: moderate, more overconfident, and less overconfident investors. The research design employs the state of no available market information, good news signals, and bad news signals as treatments. The result demonstrates that the more overconfident investors perform higher trading value than those who are less overconfident in all artificial markets leading to transaction losses, except that in the bad news market. In that bad news market, the more and the less overconfident investors gain profits, and the moderate investors suffer from trading losses.
Keywords: overconfidence, excessive trading, profit and loss
INTRODUCTION
People often exhibit irrational behaviour, such as overconfidence, in their daily life; and further, due to this overconfidence, people tend to make mistakes when drawing conclusions. This phenomenon of overconfidence as the tendency of the decision makers to overesti-mate the precision of their knowledge has been well documented in previous research (Lichtenstein, et al., 1982; Camerer, 1995; Kruger & Dunning, 1999). This previous research is very clear that when people suffer from overconfidence, they tend to overvalue both the precision of their knowledge and the accuracy of their information. This usually unconscious overvaluation distorts their perceptions of their own ability in such a way that they tend to create for themselves an
illusion of control, whereby they are able to manage and influence the outcomes of uncontrolled events (Nofsinger, 2002). According to Lord et al. (1979), people who suffer from overconfidence tend to overvalue the presence of confirming evidence while ignoring or downplaying the presence of contradictory evidence. This has obvious implications for trading performance in financial markets, and as such, will be the primary focus of the present study.
that people who have lower levels of know-ledge tend to suffer from overconfidence. Therefore, they tend to make biased decisions which magnify these false beliefs (Lichtenstein et al., 1982; Fischoff et al., 1977; Lichtenstein & Fischoff, 1977). Furthermore, each indivi-dual also has diverse levels of confidence that would influence his decision when predicting the outcome of uncertain events. According to Klayman et al., (1999), the combination of level of knowledge and confidence will determine the level of one’s overconfidence, which varies from one person to another. The differences in this level of overconfidencewill bring about the differences in interpreting and processing information, ultimately leading to different decisions (Kahneman & Tversky, 1973, 2001; Griffin and Tversky, 1992).
Empirical evidence demonstrates that overconfident investors tend to engage in excessive trading value in the capital market, leading to trading losses. Odean (1999) shows that overconfident investors tend to assess the accuracy of their information so excessively that they are less cautious and tend to neglect the possibility of risks. Overconfident investors unconsciously buy and sell the securities at exceedingly high and low prices, respectively. They tend to trade the securities based on misperception judgment. They do not realize that they are required to pay higher commission fees. These transactions, understandably, end up with a large net loss. Nevertheless, other empirical research demonstrates that over-confidentbehaviour does not always end with net transaction losses. Overconfident investors still have the opportunity to gain profits when they deliver the predicted price of the securities in such a way that is close to the prevailing market price (DeLong et al., 1990;Hirshleifer & Luo, 2001; Gervais & Odean, 2001).
In securities trading, all investors usually seek securities whose prices reflect an increasing trend and then predict the value of the securities based on their private information (De Bondt, 1993). The underlying reason for
this behaviour is that the investors believe that the flows of income and securities price do not follow a random walk, meaning that the future value of the securities price is influenced by the previous ones. Unfortunately, overconfident investors often make biased decisions as they observe consecutive securities prices. As the prices tend to increase, they would predict that the price would continue to increase in next trading sessions, although such predictions are not always true. In addition, they also tend to increase their trading value to capture higher returns but end up experiencing net trading losses. When they experience these losses, there would naturally exist a transfer of wealth from the overconfident investors to the less overconfident or rational investors (Odean, 1998a; Barber & Odean, 2000).
Since securities trading involves uncer-tainty, it is suspected that there exists a group of investors who may be referred to as more overconfident investors conducting overconfi-dent trading. Therefore, the research issues are formulated as follows:
1. Do more overconfident investors perform excessive trading value, or at least perform higher trading value than those who are less overconfident? This research will answer whether research done in a western context is also applicable to an Indonesian context. 2. Will there be transfers of wealth between
the less and the more overconfident investors?
LITERATURE REVIEW AND HYPOTHESES
1. Literature Review
identifying the factors influencing the observed events. The knowledge constraint and variabil-ity among those decision makers would lead to different levels of confidence, implying inherently different levels of risk preference. In other words, when the decision makers increase their level of confidence, they increase their risk accordingly.
1.1. The Relationship between Confidence and Knowledge Level
In dealing with uncertainty, people generally tend to undertake decisions based on their level of confidence. Level of confidence represents the probability in attaining beliefs and assumptions which are true, whereas the magnitude of probability is determined by the level of knowledge. According to Winkler and Murphy (1968), there is an inverse relationship between the level of knowledge and level of confidence when people encounter uncertainty. People who have a high level of knowledge tend to reduce their level of confidence by decreasing the perceived probability that their beliefs will hold to be true. Conversely, those who have a low level of knowledge tend to increase their level of confidence by artificially inflating the probability that their beliefs will be true. Klayman et al., (1999) suggest that the combination of level of knowledge and level of confidence would determine the level of overconfidence.
1.2. Overconfident Investors in Securities Markets
Many researchers have elaborated the overconfident behaviour in securities markets. Daniel and Titman (1999) show that when investors encounter excessive tasks, but with a feedback loop that runs very slowly, the overconfident behaviour tends to strengthen. In addition, this overconfident behaviour mani-fests when the investors deal with relatively difficult asset valuation such as that which is dominated by intangible assets. The more concrete and real the asset is, the less the
tendency of overconfident behaviour occur-ring. Daniel and Titman (1999) clearly demonstrate based on their observation of overconfident behaviour in the period of 1964 – 1997, that there is no evidence for the efficient market hypothesis to exist; and further, that securities prices seem to be predominantly influenced by overconfident behaviour.
In a similar way, Odean (1998a) demon-strates how overconfident investors conduct their trading strategy, with respect to rational versus overconfident investor profiles. The researcher collected the data from a discount brokerage house in the period of 1991- 1996 to calculate the return based on the trading position. The study examines the two compet-ing theories explaincompet-ing the aggregate investor behaviour in that period: the Theory of Rational Expectation (Grossman and Stiglitz, 1980) and Overconfidence Theory (Daniel et al., 1998). The first theory predicts that rational investors would act rationally so that they would not trade excessively, while the second predicts that the overconfident behaviour tends to trade excessively. The results of this research show that in the aggregate perspective, overconfident investors gain fewer profits than the market returns. They tend to trade so excessively that they behave carelessly, which in turn leads to underestimation of risks. They do not realize that their excessive trading incurs an increase in the transaction cost since they would be charged at a higher commission cost beyond their expectation. Their net trading losses, therefore, come as little surprise.
1.3. Excessive Trading Phenomena
Empirical research demonstrates that the investors who suffer from overconfidence tend to trade excessively, more than they would if they were more rational. For example, Barber and Odean (1999, 2000) show that the over-confident investors tend to be more actively engaged in their trading activities when they overestimate the accuracy of their own information. Such misperceptions would be stronger when the information develops partially and arrives in a late and unpredictable fashion. These misperceptions would cause the traders to overvalue, and in some cases undervalue, the securities, as well as affecting an increase of the trading value. Such overval-ued or undervaloverval-ued securities and excessive trading become readily apparent after the data has been analyzed.
Many scholars have developed models of overconfident behaviour in the securities market, predicting that such behaviour would lead to trading losses. Benos (1998) and Odean (1998b) develop models suggesting that overconfident investors are inclined to trade too much. These models stipulate that the more overconfident an investor feels, the more he engages in his trading activities and the lower his expected utility. Rational investors, though, do better in assessing their expected profits from trading. Rational investors will not trade if the expected returns from their trading are insufficient to offset the possible costs. Overconfident investors, on the other hand, have unrealistic beliefs about their expected profit. They may engage in costly trading although their expected profits are insufficient to offset the costs of trading, simply because they overestimate the magnitude of expected profits and underestimate the underlying risks. Benos (1998) and Odean (1998b) present a model of overconfidence assuming that investors overestimate the precision of their information signals. In these frameworks, at worst, overconfident investors believe that they have useful information when in fact they have no information. Other overconfidence models
predict that overconfident investors tend to increase their trading value excessively, though they still experience trading losses (Gervais and Odean, 2001; Caballe & Sakovic, 1998).
2. Hypotheses
2.1. Investor Reactions in the Absence of any Information
Psychological research shows that indi-viduals who have low levels of knowledge tend to display overconfident behaviour (Lichtenstein et al., 1982; Fischoff et al., 1977; Lichtenstein & Fischoff, 1977). This implies that the lower the level of an individual’s knowledge is, the greater the tendency to be more overconfident. Thus, the less informed investors will also be more overconfident, and this research refers to them as just “more overconfident” throughout the length of the study. Conversely, the higher the level of an individual’s knowledge is, the greater the tendency to be less overconfident. Thus, the more informed investors will also be less overconfident, and this research refers to them as just “less overconfident.” Psychological evidence also demonstrates that people tend to engage in overconfident behaviour when they deal with uncertain conditions, especially when they find that the problem is very difficult (Juslin et al., 1999, Klayman et al., 1999, Soll & Klayman, 2004).
periods, and so no one investor feels at an advantage when dealing with the market information. Given the inherent uncertainty of these conditions, investors will predict the value of the securities based on their confidence and level of knowledge. On the other side, empirical research also reveals that given the overconfidence of the investors, they tend to trade excessively (Odean, 1999; Barber & Odean, 1999, 2000). In the current research context, the more overconfident investors are expected to perform higher trading value than those who are less overconfident. Therefore, the hypothesis is formulated as follows. Hypothesis1a: The more overconfident
inves-tors conduct higher trading value than that of the less overconfident ones in the absence of information.
Empirical evidence demonstrates that as the more overconfident investors experience transaction losses due to the overconfidence, there will be a transfer of wealth from the more to the less overconfident investors (Odean, 1999; Barber & Odean, 2000). The next hypothesis is formulated as follows.
Hypothesis1b: There is a transfer of wealth from
the more to the less overconfident inves-tors in the absence of information.
2.2. Investor Reactions when the Market Provides Good News
Self deception hypothesis (Trivers, 2004) states that as overconfident individuals en-counter good news, they tend to exaggerate their positive qualities (e.g., convincing themselves that they are smarter or stronger than they really are), and this zealous belief in self can help to fool others about these quali-ties. Due to overconfidence, those overconfi-dent individuals tend to overvalue the precision of their knowledge and the accuracy of their information. Observing the good news, therefore, they tend to buy securities at a relatively high price. In addition, as they
observe the increasing market price, they would extrapolate a persistent increase in following trading session. Empirical research confirms this notion (De Bondt, 1993). Other findings suggest that when the signals of good news enter into the market, the more over-confident investors tend to buy the securities excessively at a higher price leading to trading losses (Bloomfield et al., 1999; Bloomfield & Libby, 1996; Camerer, 1987). Due to the transaction losses, there is a transfer of wealth from the more to the less overconfident investors. The next hypotheses are therefore presented as follows.
Hypothesis2a: The more overconfident
investors conduct higher trading value than that of the less overconfident ones as the market provides signals of good news. Hypothesis2b: The signals of good news evoke
a transfer of wealth from the more to the less overconfident investors.
2.3. Investor Reactions when the Market Provides Bad News
Therefore, the next hypotheses are presented as follows:
Hypothesis3a: The more overconfident
inves-tors conduct higher trading value than that of the less overconfident ones as the market provides a signal of bad news. Hypothesis3b: The signals of bad news evoke a
transfer of wealth from the more to the less overconfident investors.
RESEARCH METHOD
The current research employs a two- group-pretest-posttest quasi-designed research methodology (Isaac & Michael, 1985; Christensen, 1988). It is a 2x3 design research focusing on between subject observations (Cook & Campbell, 1979). In order to increase the observations, the research design imple-ments repeated measurement, meaning that the same subject will be treated differently and repeatedly (Kerlinger and Lee, 2000).
1. Subjects
In this experimental research, thirty out of one hundred fifty students of The Masters Program of Science at Gadjah Mada Univer-sity, Yogyakarta, Indonesia majoring in Finance and Accounting were randomly selected as artificial investors. These students had all already taken at least one of the following courses: Portfolio Theory, Advanced Financial Management, and Finance Seminar though they had no previous experience in taking part in any securities trading activities. The selection of those participants meets the procedure of the standard test for calibration of
confidence, as addressed in the following section.
2. Test for Calibration of Confidence
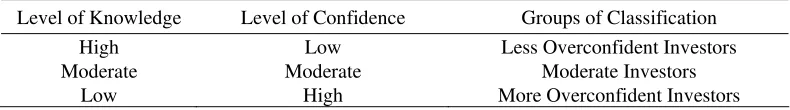
The overconfident behaviour from a sample set of observations can be measured from the score generated from the level of overconfidence. Klayman et al., (1999) documented that the intersection of level of knowledge with the level of confidence would determine the resulting level of overconfi-dence. Therefore, given that the factors contributing to this overconfidence vary among individuals, it may be assumed that the level of overconfidence similarly varies among individuals. Klayman et al., (1999) explain further that anyone who has a positive score of level of overconfidence can be classified as overconfident one. In this research, those who have positive score of overconfidence were classified into three groups as shown in the following Table 1.
Conversely, those who attain a negative level of overconfidence can be classified as under-confident. This demarcation is very important to accurately distinguish overconfi-dent from under-confioverconfi-dent behaviour arising from a sample set of observations so that misinterpretation can be avoided. Therefore, under-confident participants are not allowed to participate in this current research since real investors do not exhibit such characteristics. By doing so, the goal of this experimental research, which only observes the overconfident inves-tors, will be achieved. As a further point of clarification, it should be noted that the construct of overconfidence is stronger than
Table 1. The Classification of Groups of Overconfident Investors
Level of Knowledge Level of Confidence Groups of Classification
High Low Less Overconfident Investors
Moderate Moderate Moderate Investors
confidence since it relates to the aspect of knowledge. In other words, when confidence is moderated by knowledge, it will proceed to overconfidence. Therefore, this current research focuses on overconfidence rather than merely on confidence itself.
In this experiment, levels of overconfi-dence of all participants were thoroughly observed. Following Klayman et al. (1999), the level of overconfidence was observed by conducting a test for calibration of confidence. This test is a standard procedure to observe and measure the level of overconfidence by comparing the average of correct answers and the average level of the confidence based on the sets of two-choice questions such as “Which of these nations has higher population: (a) China, or (b) India?”. The participants answer fifteen out of twenty five sets of questions that are randomly chosen. For each set of question, participants choose the answer that they think is more likely to be right and indicate, on a scale from fifty to one hundred percent, how sure they are about having chosen their answers correctly. When the average level of confi-dence is higher than the average of correct answers, there will be a positive score of overconfidence, and when the average level of confidence is lower than the average of correct answers, a corresponding negative score for overconfidence (i.e., under-confident) will be resulted. As stated above, this current research only focuses on participants who have positive score of overconfidence.
Due to budget as well as laboratory constraints, the experimenter only focused on thirty participants who were classified into three groups based on their level of overconfi-dence. The first group was labelled as more overconfident investors, consisting of ten participants who were randomly selected from the top-level-overconfident ones. In line with Klayman et al., (1999), it was expected that these investors would have the least correct answers among all participants; therefore, these investors were classified as less informed ones
in this paper. The second group was labelled as less overconfident investors, consisting of ten participants who were randomly selected from the bottom-level-overconfident ones. These investors, it was hypothesized, would have the most correct answers among all participants. They were also classified as more informed ones. The last group was labelled as moderate investors and which consisted of ten participants who were randomly selected from the middle-level of overconfident ones. All investors in those three groups participated in securities trading to discover the market price of the securities and determine the underlying trading value. However, the performance of moderate investors is excluded from the analysis to achieve the greatest difference.
3. The Trading
In this current experimental design, all participants were required to join in computer-ized artificial markets, similar to those used by Bloomfield et al., (1999) and Bloomfield and Libby (1996). The market prices in this research reflected those of the Indonesia Stock Exchange, in which a pre-opening market is implemented to discover the market price that will become the barometer of the expected price of the majority of market players for each trading day. The pre-opening market in this research took place in approximately four minutes.
research design applied various controls, as follows:
Twelve rounds of trading occurred during the day; each of which was comprised of three trading sessions in the hopes that the participants would be able to maintain their stamina throughout the entire process. The length of each trading session was around four minutes; therefore, the entire during of all trading sessions was approximately three and a half hours.
Three different securities were randomly selected in each trading session to increase the probability of the transaction occurring. Thus, all investors traded those three securities with one another in each trading session to discover the market prices of the underlying securities one at a time. They would then continue trading in the next trading session to discover the next market prices and so on.
There were, in total, thirty six different kinds of securities available to be randomly allocated into thirty six trading sessions of three different securities. All participants had the opportunity to observe and take advantage of prevailing market prices from the previous trading session and other available information to predict the market prices of the securities in the following trading session. However, the participants may not simultaneously buy and sell the same security in any given sessions. In addition, short selling was not allowed to limit the complexity and isolate other confounding factors.
The real names of the underlying securities were hidden and then labelled with random numbers to reduce research bias due to the reputations of the represented companies
The research design also provided cash motivation to encourage the participants to trade seriously. Participants were informed that three randomly selected participants would receive payment equal to their
profits. In addition, all participants also received a nominal amount of money as the participation fee.
This research design offers asymmetric information in all trading sessions so that there is no participant who could access any private information that may make him better off vis-à-vis other investors. To this end, all participants were given the same company financial reports to predict the value of the securities. However, since they had different level of overconfidence, they should create different predictions about the value of the securities. In other words, since each participant had a different level of knowledge and level of confidence, there should be varying predicted values of the securities. In term of the research design, the more overconfident investors, as irrational investors, who have a lower level of knowledge and higher level of confidence, are expected to overvalue their knowledge, underestimate their risk, and exaggerate their ability to control events such that they trade excessively and ultimately suffer net trading losses.
4. Treatments
a likely candidate for Finance Minister who seems to be generous to the market (Stickel, 1995). The signals of bad news are comprised of initial public offerings (Daniel et al., 1998), recommendations to sell the securities from the analysts (Stickel, 1995), the failure to avoid or reduce a tax burden (Teoh et al., 1998), and an increase in the interest rate of borrowing (Stickel, 1995). It was expected that the treatments would elicit different effects on the trading value from both the more overconfident investors as well as the less overconfident investors, given their corresponding different levels of knowledge and confidence. Following Cook and Campbell (1979), the experimenter implemented different treatments towards the same participants to increase the number of observations. Such repeated measurement was justified, given that the experimenter could only access a single population.
5. Variable Measurements
The causal relationship in this research is that the level of overconfidence influences the trading value and magnitude of profits and losses. Thus, the independent variable in this experiment is the level of overconfidence of all participants in their respective groups of investors; namely, the more overconfident investors, the less overconfident investors, and the moderate investors (see section 3.2). The dependent variables in this experiment are the trading value and the magnitude of profits and losses. The trading value reflects the value of securities sold or bought at the prevailing market price, denominated in local currency: Indonesian Rupiah (IDR). According to Bloomfield et al., (1999), profit or loss of securities trading is measured by how much the
market price deviates from its fundamental value. Profit or loss is therefore calculated based on the assumption that capital gain/loss is ignored. Thus, profit or loss of a security trading is generated from the following transactions:
For bid (buying) orders :
Profit or loss will be generated when the prevailing market price is either lower or higher, respectively, than the fundamental one.
The fundamental values of the securities were calculated following Bernard (1994)
For ask (selling) orders:
Profit or loss will be generated when the prevailing market price is either higher or lower, respectively, than the fundamental one.
RESULTS AND DISCUSSION
1. Experiment 1: Trading Activities in the Pre-Opening Periods
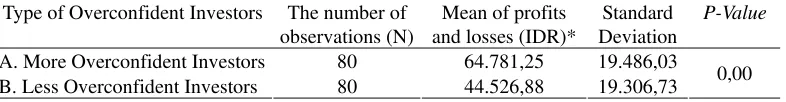
1.1. The Performance of Trading Value In these pre-opening periods, the less and the more overconfident investors both pro-duced trading value as reflected in the following Table 2.
As shown in Table 2, the T test for the equality of means implies that the mean difference of trading value between those two observed investors is significant. This shows that the more overconfident investors tended to demonstrate a higher mean trading value than that of the less overconfident ones. This finding support Hypothesis 1a.
Table 2. Summary of the Test on the Performance of Trading Value in the Pre-opening Periods
Type of Overconfident Investors The number of observations (N)
Mean of profits and losses (IDR)*
Standard Deviation
P-Value
A. More Overconfident Investors 80 64.781,25 19.486,03
B. Less Overconfident Investors 80 44.526,88 19.306,73 0,00
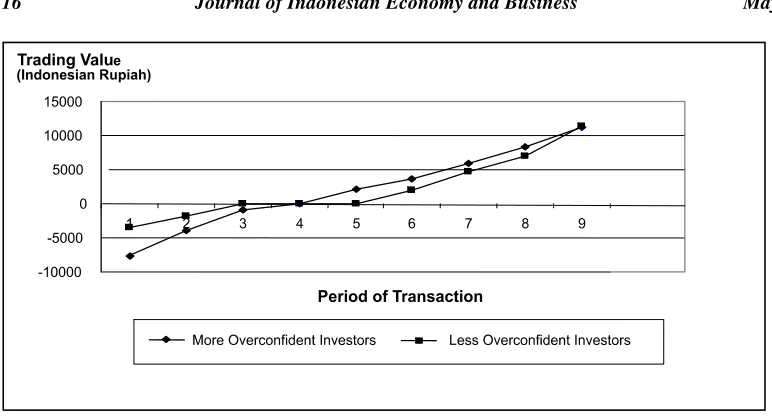
This finding supports and strengthens previous research evidence that due to overconfidence, the more overconfident inves-tors tend to trade excessively, or at least they perform higher trading value than that of the less overconfident investors (Odean, 1999; Barber & Odean, 1999, 2000). Figure 1 shows the trading value of these two groups of investors in the pre-opening periods.
As illustrated in Figure 1, the more overconfident investors executed trading values exceeding that of the less overconfident investors in all pre-opening periods. This suggests that due to overconfidence, the more overconfident investors perceived that they had the capability above the average, and in doing so conducted risky trading with a resulting higher trading value than that of the less overconfident ones.
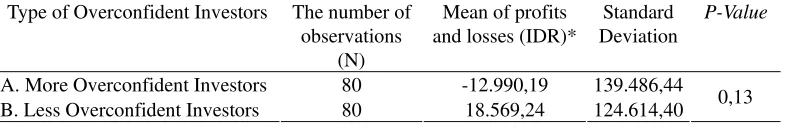
1.2. Profits and Losses.
The next significant finding of the current research involved the profits and losses generated from various strategies used by the investors. According to the rules of the game in the Indonesia Stock Exchange, bid orders at the highest price and ask orders at the lowest price would be traded first. This current research shows that the more overconfident investors (i.e., less informed ones) tended to deliver their bid orders at a high prices and ask orders at a low prices. In other words, the more overconfident investors tended to buy the securities at a higher price and sell them at a lower price than their fundamental price and in doing so they experienced losses. Table 3 summaries the test on the performance of profits and losses generated from the securities trading in the pre-opening periods.
20000 40000 60000 80000 100000 120000
1 2 3 4 5 6 7 8
Period of Transaction Trading Value
(Indonesian Rupiah)
More Overconfident Investors Less Overconfident Investors
Figure 1. Investor Trading Value in the Pre-opening Periods
Table 3. Summary of the Test on the Performance of Profits and Losses in the Pre-opening Periods
Type of Overconfident Investors The number of observations
(N)
Mean of profits and losses (IDR)*
Standard Deviation
P-Value
A. More Overconfident Investors 80 -12.990,19 139.486,44
B. Less Overconfident Investors 80 18.569,24 124.614,40 0,13
As shown in Table 3, due to the overconfidence, more overconfident investors experienced trading losses while the less overconfident investors booked profits. Further, statistical analysis of the equality of means demonstrates that the mean difference of profits and losses between the two observed investor groups is not significant. In other words, these two groups of investors statistically share gains and losses at relatively the same amount of money. This result shows that the more overconfident investors suffer from losses and the less overconfident investors receive profits. This implies that there is a net transfer of wealth from the more to the less overconfident investors, and as such confirms Hypothesis 1b. This finding also supports previous researches (Odean, 1999; Barber & Odean, 1999, 2000; Raghubir & Das, 1999).
An interesting finding of note here is that the less overconfident investors gain profits that exceed the losses of the more overconfident investors. This may be due to the fact that there were actually three groups of investors in the market; namely, the more and less overconfident investors as well as the moderate investors. According to the
methodology, the three groups of investors participated in price discovery, but the performance of those moderate investors has been excluded from the observation to achieve the greatest difference. This finding implies that there is not only a transfer of wealth from the more to the less overconfident investors but also from the moderate to the less overconfi-dent ones, accordingly. Thus, in this case, the less overconfident investors demonstrate that they have a better chance to beat the market than anyone else. The following Figure 2 demonstrates how both groups of investors, the more and the less overconfident, compete against each other to gain profits in the pre-opening periods.
This figure implies that on average, less overconfident investors gain higher profits than that of the more overconfident ones since they have higher competency and better strategy in beating the market.
2. Experiment 2: Trading Activities in the Good News Periods
2.1. The Performance of Trading Value
In the second experiment, all investors received the signals of good news in various
-80000 -60000 -40000 -20000 0 20000 40000 60000
1 2 3 4 5 6 7 8
Period of Transaction Trading Value
(Indonesian Rupiah)
More Overconfident Investors Less Overconfident Investors
forms. Previous empirical research documents that when observing the bullish market due to good news, the overconfident investors, namely the less informed ones, tend to increase their bid price and the number of securities they want to buy so that they subsequently increase their trading value (DeBondt, 1993). They do so since they perceive that they have a capability above average which makes them more likely to gain profits. Based on the hypothesis of self deception (Trivers, 2004), overconfident investors tend to buy more securities and sell fewer securities when they observe the signals of good news. Generally, overconfident investors claim that they have more accurate information and better knowledge than others so that they tend to trade carelessly, ignoring the underlying risks. Other evidence shows that overconfident investors tend to buy risky small capitalization securities and sell the profitable securities so that they under-diversify their portfolio (Nofsinger, 2002). Therefore, they ultimately incur trading losses.
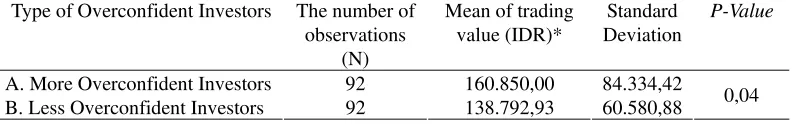
The current research shows that when good news enters into the market, every investor reacts in different ways that produce different outcomes as presented in Table 4.
Statistical analysis of the results demon-strates that the mean difference of the trading value between those two observed investors is significant. Therefore, those two groups of investors performed different mean trading value to a significant degree. The fact suggests that the more overconfident investors perform higher mean trading value than that of the less overconfident investors due to the signals of
good news, which supports Hypothesis 2a. This finding also strengthens the argument that more overconfident investors perceive that they have better knowledge and more accurate informa-tion to predict the market price of underlying securities better in all trading periods. Their false belief guides them to trade excessively to gain higher profits by increasing the orders to buy the securities in numerous quantities at higher price relative to their fundamental price. Their strategies lead to the higher trading values compared to the less overconfident investors as shown in Figure 3.
As clearly demonstrated in Figure 3, in the earlier period, less overconfident investors led the trading value. Their partners took over in the third period of transaction and then led the trading value in the remaining periods. On average, the more overconfident investors performed higher trading value than that of the less overconfident ones.
2.2. Profits and Losses.
Previous research amply documents that due to overconfidence, more overconfident investors tend to underestimate risk and conduct securities trading carelessly, resulting in transaction losses (Raghubir & Das, 1999). This current research also shows that the signals of good news also resulted in losses for this group (see Table 5).
As shown in Table 5, the mean value for profits and losses of the more overconfident investors is statistically different from that of the less overconfident ones. This demonstrates that when responding to the signals of good news, the more overconfident investors traded
Table 4. Summary of the Test on the Performance of Trading Value in the Good News Periods
Type of Overconfident Investors The number of observations
(N)
Mean of trading value (IDR)*
Standard Deviation
P-Value
A. More Overconfident Investors 92 160.850,00 84.334,42
B. Less Overconfident Investors 92 138.792,93 60.580,88 0,04
poorly, since they were inclined to buy the underlying securities at a higher price than their fundamental ones. In addition, since they tended to overestimate their capabilities, they were also inclined to underestimate the risk by delivering the order to buy the securities in an excessive manner, with the result of trading losses. On the other hand, the less overconfi-dent investors traded carefully so that they ended up with profits. Thus, there was a transfer of wealth from the more to the less overconfident investors and this finding supports Hypothesis 2b.
An interesting outcome of note is that these signals of good news resulted in both groups of investors sharing the profit and loss at different amounts of money. Considering the similar argument from Experiment 1, this finding implies that there should be a transfer of wealth from the more overconfident investors to both less overconfident and moderate investors. Figure 4 shows the profits and losses of the
observed investors when they dealt with good news; and further, that the less overconfident investors experienced higher profits than that of the more overconfident ones. The less overconfident investors also gained the greatest profits in the sixth and seventh periods, causing them to lead the competition.
3. Experiment 3: Trading Activities in the Bad News Periods
3.1. The Performance of Trading Value
In Experiment 3, all investors received signals of bad news in various forms. As reflected in the hypothesis of self deception (Trivers, 2004), overconfident investors tended to sell numerous securities to reduce the risk that they would potentially jeopardize their wealth when they observed the signals of bad news. In responding to this bad news, overconfident investors generally assumed that the bad news would reduce the market price
0 20000 40000 60000 80000 100000 120000
1 2 3 4 5 6 7 8 9
Period of Transaction Trading Value
(Indonesian Rupiah)
More Overconfident Investors Less Overconfident Investors
Figure 3. Investor trading value in the good news periods
Table 5. Summary of the Test on the Performance of Profits and Losses in the Good News Periods
Type of Overconfident Investors The number of observations
(N)
Mean of profit and loss (IDR)*
Standard Deviation
P-Value
A. More Overconfident Investors 92 -44.141,61 184.331,42
B. Less Overconfident Investors 92 28.887,12 208.993,58 0,01
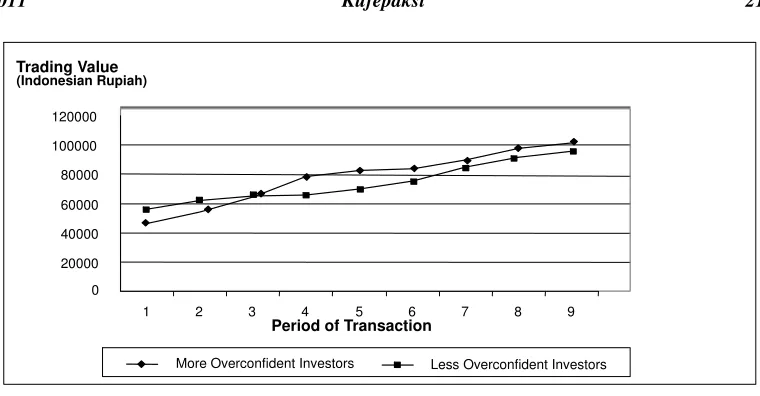
and they believed that the market price would continue to decrease in the following trading periods. Therefore, they were inclined to put their ask order at a lower price, expecting that they could sell the securities as soon as possible. Referring to Table 6, the statistical analysis demonstrates that the less overconfi-dent and more overconfioverconfi-dent investors performed significantly different mean trading values. This suggests that, due to overconfi-dence, the more overconfident investors performed a higher mean trading value than that of the less overconfident ones as bad news entered into the market, which supports Hypothesis 3a accordingly.
The trading performance of both groups of investors in these bad news periods is also presented in Figure 5.
As shown in this figure, the more overconfident investors performed higher trading values in the earlier periods than their partners do. In the rest of trading periods,
however, they tended to increase their trading value even more such that the less overconfident investors were unable to exceed them.
3.2. Profits and Losses
According to the statistical test on the performance of profits and losses, both the less overconfident and the more overconfident investors achieved interesting results, since both groups of investors earned profits as shown in Table 7. Both groups of investors enjoyed a statistically similar amount of profit. This implies that there is a transfer of wealth from the moderate investors to both groups of investors; therefore, this finding does not support Hypothesis 3b.
In this interesting case, the moderate investors, who are generally risk averters, may experience losses as they usually react too slowly in responding to any information. Therefore, when they receive bad news, they
-300000 -200000 -100000 0 100000 200000 300000 400000
1 2 3 4 5 6 7 8 9
Period of Transaction Trading Value
(Indonesian Rupiah)
More Overconfident Investors Less Overconfident Investors
Figure 4. Investor Profits and Losses in the Good News Periods
Table 6. Summary of the Test on the Performance of Trading Value in the Bad News Periods
Type of Overconfident Investors The number of observations
(N)
Mean of trading value (IDR)*
Standard Deviation
P-Value
A. More Overconfident Investors 90 94.445,83 68.775,52
B. Less Overconfident Investors 90 58.095,83 19.930,26 0,00
may respond to it so late that they are unable to capitalize on the available opportunities. In addition, it may be that moderate investors fail to predict the price of the underlying securities accurately so that they sell the securities at a lower price than the fundamental ones. These arguments would explain why moderate investors suffered from trading losses and the more overconfident and the less overconfident ones gained profits in these sessions. These results imply that although the investors suffer from overconfidence, the more overconfident ones have the opportunity to gain profits. This finding confirms the previous empirical research of DeLong et al., (1990), Hirshleifer and Luo (2001), and Gervais and Odean (2001).
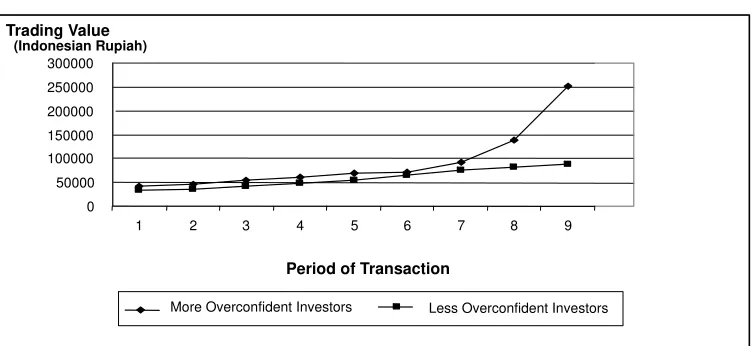
Figure 6 shows the profits and losses generated from the respective strategies of the observed investors. As illustrated in Figure 6, during the earlier periods of bad news, both the more overconfident and the less overconfident
investors experienced transaction losses and the moderate investors gained profits. Starting from the middle of the fourth period, the more overconfident and the less overconfident investors realized profits and their profits continued to increase until the ending period; whereas the moderate investors experienced trading losses. During that period of time, the more overconfident investors documented higher profits than that of the less overconfi-dent investors.
CONCLUSIONS AND RECOMMENDATIONS
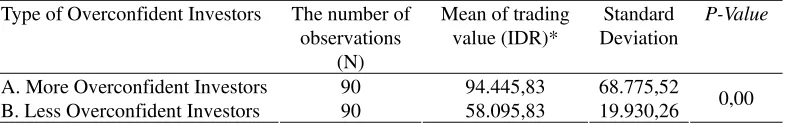
This paper focuses on the way the overconfident investors manage their trading activities after receiving the treatments. The result demonstrates that due to overconfidence, the more overconfident investors tended to trade in higher volume than the less overconfi-dent investors in all observed markets. Through poor trading, the more overconfident investors 0
50000 100000 150000 200000 250000 300000
1 2 3 4 5 6 7 8 9
Period of Transaction Trading Value
(Indonesian Rupiah)
More Overconfident Investors Less Overconfident Investors
Figure 5. Investor Trading Value in the Bad News Periods
Table 7. Summary of the Test on the Performance of Profits and Losses in the Bad News Periods
Type of Overconfident Investors The number of observations
(N)
Mean of profits and losses
(IDR)*
Standard Deviation
P-Value
A. More Overconfident Investors 90 2.102,30 5.693,05
B. Less Overconfident Investors 90 1.763,61 4.058,58 0,65
experienced trading losses leading to a transfer of wealth to the less overconfident investors in pre-opening and good news markets. However, due to the bad news, the less and the more overconfident investors gained profits and there was a transfer of wealth from the moderate investors to the more and less overconfident ones. Thus, the conclusion supports the previous research which also implies that the fact that research done in a western market context is also applicable to an emerging Indonesian market context.
This research design did not allow the investors to use short selling technique when they conducted the trading activities. A suggested avenue for future research would be to explore overconfident behaviour in an experimental setting when short selling is allowed in hopes of obtaining different results for a fruitful comparison of data. Future research may also involve students who have previous experience in taking part in securities trading activities as research samples, so as to replicate a more authentic market setting.
REFERENCES
Barber, M. Brad., and Terrance Odean, 1999. “The Courage of Misguided Convictions”. Financial Analysts Journal, November/
December, 41-54.
Barber, M. Brad., and Terrance Odean, 2000. “Trading is Hazardous to Your Wealth: The Common Stock Investment Performance of Individual Investors”. Journal of Finance( 55), 2, 773-806. Benos, Alexandross, 1998. “Overconfident
Speculators in Call Market: Trade Patterns and Survival”. Journal of Financial Markets(1), 3-4, 353-383.
Bernard, Victor., 1994, “Accounting Based Valuation Methods, Determinants of Book to Market Ratios and Implications for Financial Statement Analysis”, Working Paper, University of Michigan.
Bloomfield, Robert., Robert Libby., and Mark Nelson, 1999. “Confidence and the Welfare of Less Informed Investors”. Accounting, Organizations and Society (24), 623- 647.
Bloomfield, Robert., and Robert Libby, 1996. “Market Reactions to Differentially Available Information in The Laboratory”. Journal of Accounting Research (34), 183-207.
Caballe, Jordi., and Jozsef Sakovic, 1998. “Overconfident Speculation with Imper-fect Competition”. Universitat Autonoma de Barcelona, Spain. Working Paper. Camerer, Collin, 1987. “Do Biases in
Probability Judgment Matter in Markets? Experimental Evidence”. American Eco-nomic Review (77), December, 981-97. Camerer, C, 1995. “Individual Decision
Making” in: The Handbook Of Experi-mental Economics, Ed. John H Kagel., and Alvin E Roth, 587-703. New Jersey: Princeton University Press.
Christensen, B. Larry, 1988. Experimental methodology (4th ed.). Massachusetts: Allyn and Bacon, Inc.
Cook, T.D., and D.T. Campbell, 1979. Quasi Experimentation: Design and Analysis Issues for Field Settings. Boston: Houghton Mifflin.
Daniel, Kent., David Hirshleifer, and Avanidhar Subrahmanyam, 1998. “Investor Psychology and Securities Market Under and Overreactions”. Journal of Finance (LIII), 6, December, 1839 – 1885.
Daniel, Kent., and Sheridan Titman, 1999. “Market Efficiency in An Irrational World”. Financial Analysts Journal, November/December, 28 - 40.
DeLong, Bradford., Shleifer, A, Summers., and L.H.,Waldman, 1990. “Noise Trader Risk in Financial Markets”. Journal of Political Economy (99), 703 -738.
De Bondt, Werner, 1993. “Betting on Trends: Intuitive Forecasts of Financial Risk and Return”. International Journal of Forecasting(9), 355-371.
Fischhoff, Baruch., Paul Slovic., and Sarah Lichtenstein, 1977. “Knowing With
Certainty: The Appropriateness of Extreme Confidence”. Journal of Experi-mental Psychology: Human Perception and Performance(3), 4, 552-564.
Gervais, Simon., and Terrance Odean, 2001. “Learning to be Overconfident’. Review of Financial Studies(14), 1-27.
Griffin, Dale., and Amos Tversky, 1992. “The Weighing of Evidence and the Deter-minants of Confidence”. Cognitive Psychology(24), 411 -435.
Grossman, Sanford., and Joseph E Stiglitz, 1980. “On the Impossibility of Infor-mationally Efficient Markets”. American Economic Review(70), 393 –408.
Hirshleifer, David., and Guo Ying Luo, 2001. “On the Survival of Overconfident Traders in a Competitive Securities Market”. Journal of Financial Markets (4), 73-84. Hogarth, Robin, 1994. Judgement and Choice,
the Psychology of Decision. (2nd ed.). New York: John Wiley and Sons.
Raghubir, P., Sanjiv, R Das, 1999. “Case for Theory Driven Experimental Enquiry”. Financial Analysts Journal, November/ December, 56-79.
Stephen., and William B Michael, 1985. Handbook in Research and Evaluation. (2nded.). San Diego, California: Edits Publishers.
Juslin, P., P. Wennerholm., and Olsson, H, 1999. “Format Dependence in Subjective Probability Calibration”. Journal of Experimental Psychology: Learning, Memory, and Cognition(25), 1038-1052. Kahneman, Daniel., and Amos Tversky, 1973.
“On the Psychology of Prediction”. Psychological Review (80), 237-251. Kahneman, Daniel., and Amos Tversky 2001.
Kerlinger, N. Fred., and Howard B Lee, 2000. Foundations of Behavioral Research. (4th ed.) Fort Worth: Harcount College Publishers.
Klayman, Joshua., Jack Soll., and Sema Barlas, 1999. “Overconfidence: It depends on How, What and Whom You Ask”. Organizational Behavior and Human Decision Process(79), no 3, 216 – 247. Kruger, J., and D.Dunning, 1999. ”Unskilled
and Unaware of It: How Difficulties in Recognizing One’s Own Incompetence Lead to Inflated Self Assessments”. Journal of Personality and Social Psychology (77), 1121-1134.
Lichtenstein, Sarah., and Baruch Fischhoff, 1977. “Do Those Who Know More Also Know More About How Much They Know”. Organizational Behaviour and Human Performance(20), 159-183. Lichtenstein, Sarah., Baruch Fischhoff., and
Lawrence D Phillips, 1982. “Calibration of Probabilities: The State of the Art to 1980”. In Daniel Kahneman, Paul Slovic, and Amos Tversky (Ed.), Judgement Under Uncertainty: Heuristics and Biases (pp. 306-334). Cambridge, UK and New York: Cambridge University Press.
Lord, Charles., Ross G Lee., and Mark R Lepper, 1979. “Biased Assimilation and Attitude Polarization: The Effect of Prior Theories on Subsequently Considered Evidence”. Journal of Personality and Social Psychology(37), 2098-2109.
Nofsinger, John, 2002. The psychology of investing. N Jersey: Prentice Hall.
Odean, Terrance, 1998a. “Volume, Volatility, Price, and Profit When All Traders are Above Average”. Journal of Finance (LIII), December, 1887 -1934.
Nofsinger, John, 1998b. “Are Investors Reluctant to Realize Their Losses? Journal of Finance (53), No 5, 1775 – 1798.
Nofsinger, John, 1999. “Do Investors Trade Too Much?”. American Economics Review(89), 1279-1298.
Soll, Jack., and Joshua Klayman, 2004. “Overconfidence in Interval Estimates”. Journal of Experimental Psychology: Learning, Memory, and Cognition (30), no 2, 299-314.
Stickel, E. Scott, 1995. “The Anatomy of Performance of Buy and Sell Recommendations”. Financial Analysts Journal, September-October, 25 -39. Teoh, Siew, Hong., T.J. Wong., and Gita Rao,
1998. “Are Accruals During Initial Public Offerings Opportunistic?”. Review of Accounting Studies (4), no 4, 234- 259. Trivers, R, 2004. “The Elements of a Scientific
Theory of Self Deception”. Annals New York Academy of Science, ( 907), 114-131. Winkler, R.L., and Murphy, A. H, 1968.