eb site
General and Comparative Endocrinology
December 2001; 124(3) : 343-358 http://dx.doi.org/10.1006/gcen.2001.7723
© 2001 Elsevier Science (USA). All rights reserved
Archimer http://www.ifremer.fr/docelec/
Archive Institutionnelle de l’Ifremer
Effects of Rapeseed Meal-Glucosinolates on Thyroid Metabolism and Feed Utilization in Rainbow Trout
C. Burela, T. Boujarda, S. J. Kaushika, G. Boeufb, K. A. Molc, S. Van der Geytenc, V. M. Darrasc, E. R. Kühnc, B. Pradet-Baladed, B. Quérate, A. Quinsacf, M. Kroutif and D. Ribaillierf
a
Unité mixte INRA-IFREMER de Nutrition des Poissons, Station d'Hydrobiologie INRA, B.P. 3, 64310, Saint Pée-sur-Nivelle, France
b
Laboratoire de Physiologie des Poissons, IFREMER, Station de Brest, B.P. 70, 29280, Plouzané, France
c
Laboratory of Comparative Endocrinology, Catholic University of Leuven, Naamsestraat 59, 3000, Louvain, Belgium
d
CSIC-Centro Nacional de Biotecnologia, Campus de Canto Bianco-Ctra de Colmenar Viejo, Km 15,500, 28049, Madrid, Spain
e
Laboratoire de Physiologie Générale et Comparée, Muséum National d'Histoire Naturelle, 7 rue Cuvier, 75231, Paris Cedex, France
f
Laboratoire d'Analyses CETIOM, 270, avenue de la Pomme de Pin, 45160, Ardon, France
Abstract: Two rapeseed meals (RM1 and RM2), containing glucosinolates at a concentration of 26
and 40 µmol/g, respectively, were incorporated at increasing levels (10, 20, and 30% for RM1 and 30 and 50% for RM2) in diets of juvenile rainbow trout. Disturbances in the thyroid axis appeared after 14 days of feeding (with a dietary incorporation level of 10%). The dietary supplementation with T3 or iodine induced an increase in plasma T3 levels, compared to that in fish fed the RM diets, and reduced the deleterious effect of RM on growth. When trout were reared in seawater, there was also a slight increase in thyroid hormone levels. TSH treatment had no effect on the thyroid hormone plasma levels. The incorporation of 30% of RM1, which induced a lower dietary content of toxic compounds than RM2, led to a rapid decrease of plasma T4 and T3 levels, but growth was affected only after 6 months of feeding. During these studies, the deiodinase activities responded in a complex manner to restore plasma and tissue levels of T3.
Keywords: rapeseed; glucosinolates; growth; thyroid function; deiodinase activity; TSH; iodine;
INTRODUCTION
The presence of dietary glucosinolates (GLS) is known to impair the thyroid function
of humans (Astwood et al., 1949; McMillan et al., 1986), rats (Lo and Hill, 1971; Vermorel
et al., 1987), cattle (Virtanen et al., 1958), pigs (Aumaître et al., 1989; Bourdon and
Aumaître, 1990) and poultry (Akiba and Matsumoto, 1977), with deleterious consequences
on growth.
GLS are not directly responsible for the deleterious effects on thyroid function
(reviewed by Mawson et al., 1994b), but toxicity is caused by their derivative products, such
as thiocyanate anions, vinyloxazolidinethiones, and isothiocyanates. This breakdown is
mainly caused during the processing of rapeseed meal (RM) by myrosinase, which is a
specific plant hydrolytic enzyme, but also by high temperatures or the activity of the
intestinal microflora (Mawson et al., 1993). In fish of temperate areas such as rainbow trout
(Oncorhynchus mykiss), the role played by intestinal microflora is negligible compared to
that of terrestrial animals (Lesel, 1981), and the hydrolytic activity of intestinal microflora on
GLS may be ruled out.
The thiocyanate anions are competitors of iodine for active transport across the cell
membrane and for binding to tyrosine residues of thyroglobulin. Studies by Anke et al. (1980)
and Ludke et al. (1985) on growing pigs have shown that iodine supplementation (1 mg/kg) to
RM-based diets reduces the goitrogenic effects of thiocyanate anions and improves growth
performance. The same treatment in rats (Vermorel and Evrard, 1987) led only to a reduced
thyroid mass, without beneficial effects on growth and plasma thyroid hormone levels.
Vinyloxazolidinethione inhibits the normal coupling reaction whereby two molecules of
diiodothyronine (DIT) are joined to form thyroxine (T4), or in smaller quantities DIT with
on their conversion into vinyloxazolidinethione or into thiocyanate anions (Marwson et al.,
1994b).
Data from mammals suggest that the low circulatory levels of T and T3 4 due to the
intake of RM stimulate excessive secretion of hypothalamic thyroid-stimulating hormone
(TSH), which induces an increased thyroid follicle activity, resulting in a hypertrophy of the
thyroid tissue (Mawson et al., 1994b). TSH β mRNA has been isolated in several teleosts
(Moriyama et al., 1997; Pradet-Balade et al., 1997, 1999) and it remains to be demonstrated
that the low release of thyroid hormone observed in fish fed the RM-based diets is caused by
a blockage at the level of thyroid hormone synthesis and not by a lack of TSH stimulation.
Data on the goitrogenic effects of dietary RM in fish are also available (Yurkowski et al.,
1978; Higgs et al. 1982b; Hardy and Sullivan 1983; Leatherland et al. 1987; Hossain and Jauncey
1988; Teskeredzic et al. 1995; Webster et al., 1997; Burel et al. 2000a,b). The typical features of
a hypothyroid condition are low T3 and T4 plasma levels accompanied by hyperactivity of the
thyroid tissue in fish expressing a reduced growth rate. Recently, it was also shown in vitro that
the hypothyroidal condition led to an adjustment of the deiodinase activities compensating for the
low plasma level in T3 (Burel et al., 2000a,b). However, knowledge of the mechanisms involved
in the goitrogenic effect of RM in fish is still rudimentary and the causal relationship between
thyroid disturbance and reduced growth in fish fed this plant-product is still unclear. The
incapacity to express normal growth could be attributed to a lack of T3 according to the work of
Leatherland et al. (1987), who showed that a dietary T3 supplementation of trout fed with
RM-based diets can reduce the deleterious effect of RM on growth.
In this context, we initiated a series of experiments to determine to what extend the
troubles in the physiology, the metabolism, and the growth performance are due to the GLS
in trout fed RM-based diets and to evaluate the possibilities of reduction of these effects.
were to determine the sensitivity threshold of the thyroid axis of rainbow trout to the toxic
derivatives of GLS contained in RM and to study the effects of these goitrogenic compounds
on the thyroid status and the growth performance of fish over time. We examined also how a
dietary supply of triiodothyronine or iodine affected growth and thyroid function of fish fed
on RM-based diets, to assess the involvement of the goitrogenic derivatives of GLS in the
deterioration of growth performance. Furthermore, we invastigated whether the hypothyroid
condition was due to a blockage in hormone synthesis, as in mammals, by evaluating TSH
synthesis in the pituitary of fish fed a RM-based diet and by analyzing the response of such
fish to a TSH treatment. We have also studied the long-term effect of low thyroidal
disturbances on growth and the long-term effects of a iodine supplementation. Finally, the
potential interaction of iodine provided by the environment on the goitrogenic effect of
dietary RM was evaluated.
MATERIALS AND METHODS
Characteristics of RM used and feed preparation
Two different methods of fat extraction processes were applied to rapeseed (Brassica
napus). Details on these processes are given by Burel et al. (2000a). Pressure cooking led to a
reduction of the intact GLS content in RM1 (26 µmol GLS/g) and is susceptible to
inactivation of the myrosinase. Direct oil extraction had no effect on the final intact GLS
content of RM2 (40 µmol GLS/g).
Six experimental isonitrogenous and isoenergetic diets were formulated (Table 1): no
RM (control diet); 10, 20, and 30% RM1 (R1-10, and R1-20, and R1-30 diets); and 30 and
50% RM2 (R2-30 and R2-50 diets). All the diets were enriched with a mineral mixture
mg/kg), estimated from the iodine content of the ingredients given by Ferrando and Blum
(1989), were considered sufficient for salmonid species, even for those reared in freshwater.
The amount of toxic breakdown products, estimated as shown below, was higher in the
RM2-based diet than in the RM1-RM2-based diets (Table 1).
Experimental conditions
Four experiments were undertaken with rainbow trout. Experiments 1, 2, and 3 were
performed in freshwater at the INRA experimental fish farm (Donzacq, Landes, France) with
500-L tanks supplied with springwater (17 ± 1°, flow rate 10 L/min). Experiment 4 was
carried out at the IFREMER experimental facilities (Môle Sainte Anne, Brest, France) in
2000-L tanks supplied with freshwater (10 ± 1°, salinity 0-2 ‰, flow rate 30 L/min) or
seawater (12 ± 1°, salinity 35 ‰, flow rate 30 L/min).
In experiments 1, 2, and 3, feed was distributed by hand, twice a day, to apparent
satiety and the total feed intake was recorded. In experiment 4, feed was distributed in excess
by automatic feeders over a period of 6 h per day.
Experiment 1
Five diets were used in this experiment: control, R1-10, R1-20, R1-30, and R2-50. The
R1 diets allowed a graded level of RM and GLS derivatives, and the R2-50 diet was used as
negative control because of its high content of GLS derivatives.
Rainbow trout with an average body weight of 22 g were randomly allotted to 15
tanks (50 fish per tank, 3 tanks by treatment). After a 1-week adaptation period, the fish were
fed the experimental diets (in triplicate) for 58 days. A series of blood samples was taken
throughout the experiment (day , day , day , day , day-1 +1 +3 +7 +14, day+24 and day+58), 1 h after the
basis of 2 fish per tank. On other sampling days, 10 fish per tank (30 per dietary treatment)
were sampled. Blood samples were obtained from vessels near the caudal peduncle by means
of heparinized syringe and were immediately centrifuged (3000 rpm, 10 min). Plasma was
stored at -20° until T and T measurements. At day , day4 3 +7 +24, and day+58, the liver, brain and
kidney from the bled fish were removed, immediately frozen in liquid nitrogen, and
subsequently stored at -80°. The amount of food distributed and the increase in fish biomass
were measured for each replicate tank between days of blood and tissues sampling.
Experiment 2
In this experiment, the control diet, the R2-50 diet (high content of toxic compounds),
and the same diet supplemented with either 1 mg/kg of iodine 50-I), 10 mg/kg of T3
(R2-50-T310), or 20 mg/kg of T (R2-50-T 20) were used. 3,5,3’-Triiodo-L-thyronine (T3 3 3, Sigma)
was dissolved in 100 ml ethanol, and the pH was raised to 10.2 with 1M NaOH. Iodine (KI,
Sigma) was dissolved in 100 ml distilled water. The solutions were sprayed onto the dietary
ingredients during mixing. After granulation and evaporation of ethanol or water, the diets
were stored at -20°C.
Rainbow trout with an average body weight of 24 g were randomly allotted to 15 tanks
(50 fish per tank). After a 1-week adaptation period, the fish were fed the experimental diets (5
diets in triplicate) for 64 days. Fish biomass was determined for each replicate at day0, day+27,
and day+55. After 58 days of experimental feeding, blood and tissue (liver, brain, and kidney)
samples were taken from 15 fish per dietary treatment (5 fish per tank), as described for
Experiment 1.
Among the three groups of fish fed the control and the R2-50 diets, 20 fish were kept
from each tank after the first samplings (day+58). At day+63, after the morning meal, 5 fish per
TSH, Sigma, diluted in 9‰ saline solution), 5 fish with 100 µl of a 200 mg/L-TSH solution,
and 5 fish with 100 µl of 9‰ saline solution (sham-treated). The remaining 5 fish were
considered untreated control. The next morning (day+64), after the morning meal, blood
samplings were taken (as previously described) from 3 fish per tank, to total 9 fish per
treatment. Tissue samples were taken (as previously described) from fish injected with 200
mg/L-TSH and sham-treated fish.
Experiment 3
A control diet was compared to the R1-30 diet, supplemented or not with 2 mg/kg of
iodine (R1-30-I). The iodine supplement was added as described for Experiment 2.
Rainbow trout with an average body weight of 34 g were randomly allotted to nine
tanks with 50 fish per tank. After a 1-week adaptation period, the fish were fed the
experimental diets (three diets in triplicate) for 164 days. Fish biomass was determined for
each replicate at day , day0 +27, day+55, day+82, day+109, day+136, and day+164. Blood samples
were taken at day+58 and day+164 from 15 fish per dietary treatment (5 fish per replicate), 1 h
after the morning meal as previously described for Experiment 1.
After the last sampling (day+164), 12 fish fed the control and R1-30 diets were kept
from each tank, in the context of a further trial not described here. These fish were fed as
described before during 1 additional month, after which (day+194) blood samples and
pituitaries were removed, the latter being rapidly frozen in liquid nitrogen for storage before
RNA extraction.
Experiment 4
Rainbow trout with an average body weight of 160 g and previously reared in
adaptation period to the environmental conditions, i.e., fresh water or seawater, the fish were
fed the control, R1-30, or R2-30 diet for 25 days. Each experimental diet was distributed to a
batch of fish placed in freshwater and a batch in seawater. Then, blood samples were taken
from 15 fish per tank, 1 h after the morning meal as previously described for Experiment 1.
Analytical methods
Nutrient retention efficiencies: Whole-body samples (10 fish at the beginning and 3 × 5 fish
per treatment at the end of Experiment 2) were homogenized and freeze-dried for
composition analyses. Analyses of diets and whole body samples were made according to the
following procedures: dry matter after drying at 105° for 24 h; protein (N × 6.25) by the
Kjeldahl method after acid digestion; gross energy in an adiabatic bomb calorimeter (Parr);
fat after extraction with petroleum ether by the Soxhlet method, and, finally, total phosphorus
by spectrophotometric analysis of the phosphovanadomolybdate complex after mineralization
and acid digestion (ISO/DIS 6491 method). Nutrient retention efficiencies were calculated as
Retention = 100 × (FBW × final carcass nutrient or energy content − IBW × initial carcass
nutrient or energy content) / nutrient or energy intake, with IBW, FBW, and ABW as initial,
final, and average body weight, respectively.
GLS and breakdown products: To evaluate the amount of toxic compounds present in the
different diets, GLS were analyzed in RM1, RM2, and in diets as described in Quinsac et al.
(1991). The amount of breakdown products from GLS in the diets was estimated with the
considerations that the GLS content measured in the untreated RM (RM2) is the initial
amount of intact GLS without hydrolysis and that the final amount of intact GLS measured in
the diets resulted from the hydrolysis occurring during the oil extraction process in the case
of the RM2-based diets or from the granulation of the diets in the case of the RM1-based
Amount of breakdown products = (Amount of GLS in dry matter of RM2 × % dietary
incorporation of RM1 or RM2 × % dry matter of diet) - (amount of GLS measured in diet ×
% dry matter of diet).
The amount of breakdown products was expressed as equivalent µmol of GLS
hydrolysed. This estimation can be overestimated because of the volatile breakdown products
which may be lost during the oil extraction or the granulation. Results are expressed in
µmol/g, but squaring values in µg/g can be obtained with the following relationships: 0.432
and 0.123 µmol = 1 µg for GLS and GLS breakdown products in RM, respectively.
Measurement of the thyroidal status: For the assay for thyroid hormones in plasma, plasma
thyroid hormone (T4 and T3) levels were measured for each fish (except in Experiment 1,
where the blood of two fish was combined before centrifugation) with a radio-immunoassay
(RIA) described by Boeuf and Prunet (1985), and modified by Martinez et al. (1995). The
detection limits for the T and T4 3 RIAs were 1.25 and 0.62 ng/ml, respectively. The
percentage of specific binding obtained was 42 for T and 55 for T4 3, and the percentage of
unspecific binding was 10 for T and 9 for T4 3. These percentages were estimated at a
hormone level of 80 ng/ml. The intraassay coefficient of variation was 10% for both T4 and
T . 3
The different types of deiodinase activities present in rainbow trout (type I:D1; type
II: D2; type II: D3) and the tissues that contain the highest levels of enzymatic activity (liver,
brain, and kidney) were identified in a previous study (Mol et al., 1998). For the deiodinase
assay, in the present study, the D1 activity was measured in kidney, D2 in liver, and D3
activity in liver and brain (tissues pooled × 5, n=3) following the technique described in detail
in Burel et al. (2000a). The deiodinase activities in microsomal fractions of tissues are
For the RNA extraction and Northern blot analysis of the TSH ββ mRNA levels, total
pituitary RNAs from individual pituitaries were extracted in RNA+ (Bioprobe) as described
previously (Pradet-Balade et al., 1997). Total RNAs were separated through 1.2% (w:v)
agarose-formaldehyde gels, transferred to membranes (Duralon-UV, Stratagene), and treated
as previously described (Quérat et al., 1991). For hybridizations, the isolated 180 bp TSH ββ
and 865 bp ββ-actin cDNA fragments were used as templates for random-primed labeling,
and hybridization was performed as previously described (Pradet-Balade et al., 1997).
Scanning densitometry was performed with a Phosphor Imager (Molecular Dynamics).
Individual TSH ββ densitometric values were corrected by ββ-actin values for RNA loading
standardization.
Data analysis
Results are presented as means with standard deviation (SD). To test the effect of
dietary treatments, data were subjected to a one-way analysis of variance (P < 0.05), and
when appropriate, means were compared by the Tukey’s multiple range test for each
experiment.
RESULTS
Experiment 1
The dietary incorporation of RM1 up to 30% did not lead to any difference in terms of
growth performance, voluntary feed intake, or feed efficiency after 58 days of experimental
feeding. In contrast, the final body weight of the fish fed the R2-50 diet was significantly
lower than those of fish fed the other diets after 24 days (data not shown), and at day+58, it
a decrease in feed efficiency (FE), and the voluntary feed intake (VFI) was not significantly
affected (Table 2).
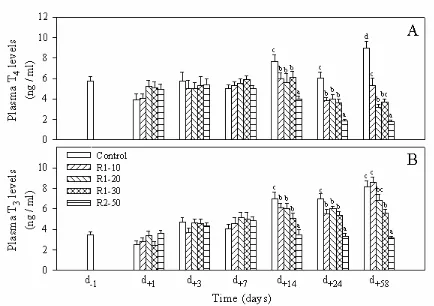
The plasma T and T4 3 levels (Fig. 1) were significantly reduced after 14 days of
feeding, even with only 10% of RM1 incorporated in the diet of trout. The drop in plasma T3
and T4 was more severe in fish fed the R2-50 diet. Whereas the effects of dietary RM on
plasma T4 levels were still pronounced in all groups after 58 days of feeding, only high levels
of dietary RM (30% of RM1 and 50% of RM2) had significant effects on plasma T levels. 3
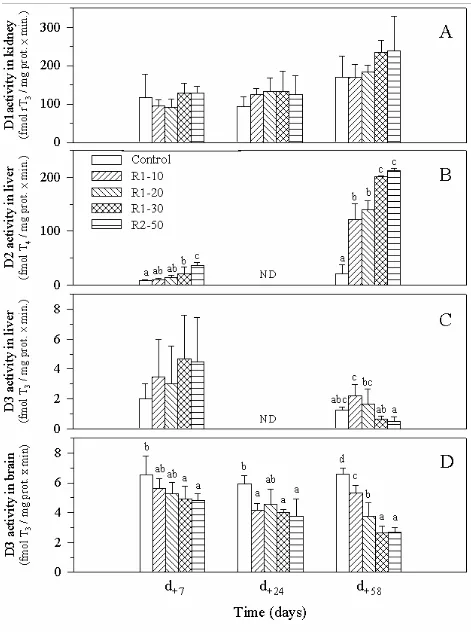
No significant effect of RM intake was observed on in vitro D1 activity in kidney of
trout sampled after 7, 24, or 58 days of feeding (Fig. 2A). After 58 days of feeding a large
increase of the D2 activity in liver was observed, even in RM1-10 fed-fish and this effect was
even visible after 7 days for R1-30 and R2-50 fed-fish (Fig. 2B). No significant effect of the
RM level on the in vitro D3 activity in liver was found (Fig. 2C). In contrast, a reverse
relationship between dietary level of RM and brain D3 activity was noted even after 7 days of
feeding (Fig. 2D). This effect was even more pronounced after 58 days, when a decrease in
brain D3 activity was observed in fish fed all the RM-based diets.
Experiment 2
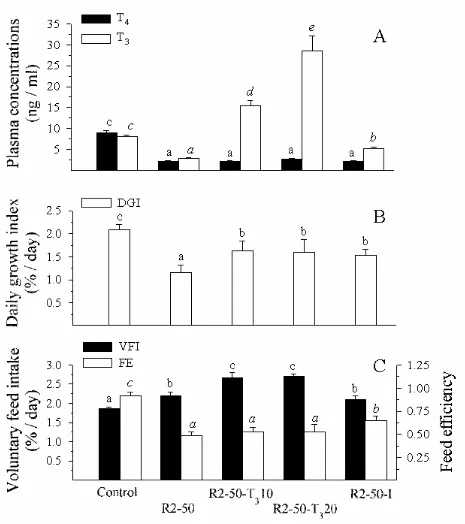
After 55 days, the dietary incorporation of 50% RM2 led to a significant (P<0.05) drop
of the plasma T4 and T3 levels compared to those in control fish (Fig. 3A). In addition, a
significant decrease of the growth rate (Fig. 3B), an increase of the feed intake, and a decrease
of the feed efficiency (Fig 3C) were observed. The lower feed utilization was characterized by
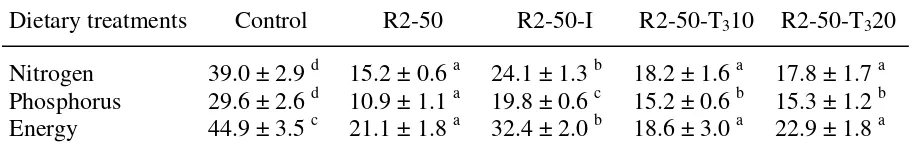
a significant lower retention of nitrogen, phosphorus, and energy (Table 3).
The addition of 10 and 20 mg/kg of T3 in the RM2-based diet led to a strong increase
(P<0.05) of the plasma T3 level (Fig. 3A), whereas plasma T4 did not change compared to
intake was strongly increased, but the feed efficiency remained as low as in R2-50-fed fish
(Fig. 3C). The dietary supplementation with 10 and 20 mg/kg of T3 had no significant effect on
the retention of nitrogen and energy, but significantly reduced the drop in phosphorus retention
(Table 3).
The supplement of 1 mg/kg of iodine in the R2-50 diet led to a significant increase of
the plasma T level, even though the plasma T3 4 level remained lower (Fig. 3A). The growth
rate was significantly higher than that of fish fed the unsupplemented R2-50, but was still
lower than that of the control fish (Fig. 3B). The feed intake was unaffected, but the feed
efficiency was significantly improved (Fig. 3C), with a significant reduction of the drop in
nitrogen, phosphorus, and energy retention (Table 3).
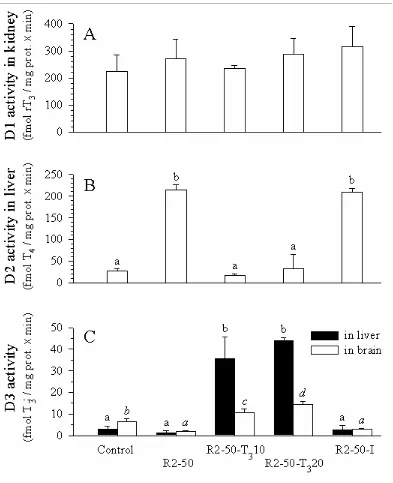
The dietary and hormonal treatments also affected the deiodinase activities in trout.
The incorporation of 50% of RM2 into the diet, inducing a significant drop in plasma T4 and
T3 levels, led to a significant increase of the D2 activity in liver (Fig. 4B) and a significant
decrease of the D3 activity in brain (Fig. 4C) compared to that of control fish. The D1
activity in kidney (Fig. 4A) and the D3 activity in liver (Fig. 4C) remained unchanged. The
significant increase of the plasma T levels induced by the dietary T3 3 supplementation in fish
fed the RM2-based diets led to a reduction of the D2 activity in the liver to a level similar to
that of control fish (Fig. 4B). However, it led also to a significant increase in D3 activity in
the liver and in the brain (Fig. 4C). The dietary iodine supplementation induced a slight
increase in plasma T levels in comparison to that induced by the T3 3 supplementation and did
not lead to any change in deiodinase activities compared to fish fed the RM2-based diet
without supplementation (Fig. 4).
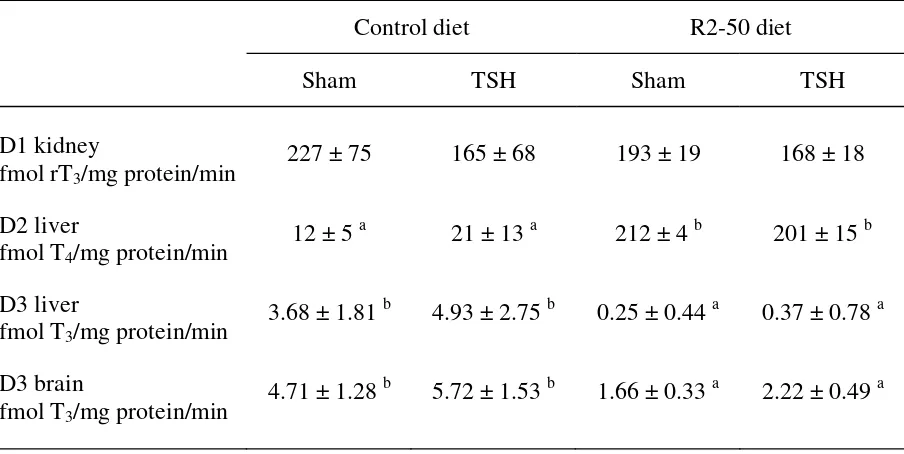
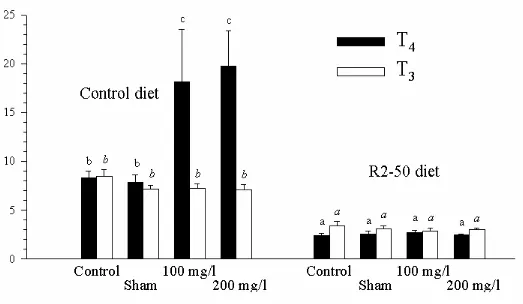
Fish fed the control diet and injected 100 and 200 mg/L of TSH significantly
increased their plasma levels in T after 24 h, without any change in the T4 3 levels (Fig. 5). In
The sham injection had no effect on the thyroid hormone levels compared to the control fish.
Irrespective of the dietary treatment, TSH injection had no significant effect after 24 h on the
D1 activity in kidney, the D2 activity, or the D3 activity in liver or brain (Table 4).
Experiment 3
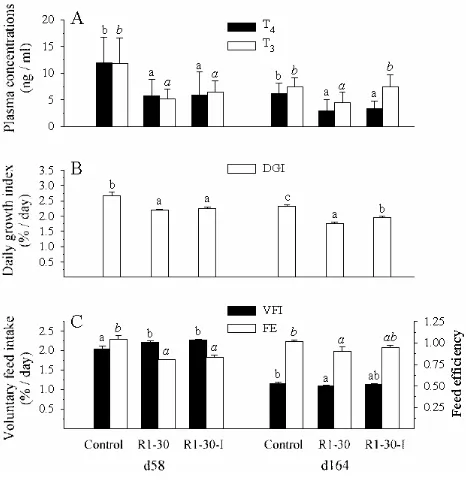
Compared to the control fish, the dietary incorporation of 30% RM1 led to a
significant decrease of ca. 50% of the plasma T and T4 3 levels after 58 days of feeding and ca.
50% of the plasma T and 40% of the plasma T4 3 levels after 164 days (Fig. 6A). The
difference between the body weight of the control fish and that of the fish fed the R1-30 diet
was ca. 15% after 55 days of feeding, and 32% after 164 days (Fig. 7). Feed intake,
stimulated during the first period, was inhibited over 164 days and feed efficiency was lower
than that in control fish, but this reduction was less pronounced after 164 days, (Fig. 6C).
After 194 days of feeding, plasma T4 still seemed to be reduced in the R1-30-fed fish (but this
diminution was not statistically significant). Correlatively, there was a high, significant
increase (more than 60-folds) of pituitary TSH ββ mRNA levels compared to the control
levels (177±172 vs. 2.83±2.4 in arbitrary units, P<0.001).
A significant beneficial effect of the dietary iodine supplementation of 2 mg/kg was
observed after 164 days on plasma T3 levels, which became similar to that of the control
group (Fig. 7A). In terms of growth performance, a significant long term effect of the iodine
supplementation was also visible as shown by the growth rate measured during the second
period (Fig. 7B). Feed intake and feed efficiency were not significantly increased in the long
Experiment 4
When fish were reared in fresh or seawater and fed for 25 days with diets containing
GLS (Fig. 8), the T and T4 3 levels were significantly reduced compared to those of the control
fish. There was a significant difference in the T4 plasma levels in fish reared in fresh or
seawater, whatever the diet. In seawater, plasma T4 levels were 41% higher in fish fed the
control diet and 48% higher in fish fed the RM2-based diet than in freshwater for the same
dietary conditions.
DISCUSSION
In trout, the mode of action of the GLS derivatives appears to be similar to those
described in terrestrial animals by Mawson et al. (1994ab), and the role played by the
thiocyanate anions is confirmed (see fig. 9). In trout fed diets containing RM1, disturbances
in the thyroid axis appeared quickly (from 14 days of feeding) and were already observed at
low dietary incorporation (10%). However, growth performance of trout was reduced much
later (after 80 days of feeding) and only with a higher level of RM1 dietary incorporation
(30%). In the case of a high dietary level of GLS derivatives (50% of RM2), the thyroidal
disturbances were much stronger and the growth performance was reduced more quickly
(after only 24 days). The resulting shortage in bio-active T3 is, at least, partially responsible
for the lower growth performance, leading to a reduction of the utilization of dietary proteins,
energy, and phosphorus. Indeed, when the diminution in thyroid hormones is counteracted by
iodine or T3 supplementation, a partial recovery of the growth is observed. An extra-supply of
iodine from a marine environment may also reduce the thyroid troubles, as seen for the fish fed
the R2-50 diet. This study showed also that the deiodinase activities respond to thyroid
hormone variations in a complex and coordinated way to maintain a sufficient plasma and
Mode of action of GLS derivatives on the pituitary-thryoid axis in the trout
As previously shown in numerous studies (see Introduction), the intake of RM
containing GLS derivatives led to a shortage in the release of the thyroid hormones in the
blood of trout. Our results supports the hypothesis that such a decrease is not caused by a lack
of pituitary stimulation, but rather by a blockage in the activity of the thyroid follicles, as it
has been hypothetized in terrestrial animals (Mawson et al., 1994b). Indeed, injections of
TSH did increase thyroid hormone levels in fish fed the control, RM-free diet, but not in the
trout fed a based diet. Furthermore, a hypertrophy of the thyroid tissue in trout fed a
RM-based diet has been shown previously (Burel et al., 2000a) and our present data suggest that
this hypertrophy is due to an increase in TSH stimulation. Indeed, the TSH β mRNA
expression levels were much higher in fish fed with RM than in the control. Low plasma
thyroid hormone levels would then increase TSH β mRNA expression level -hence, very
likely, TSH synthesis- and TSH liberation, as has been already described in other teleosts
(Larsen et al., 1997; Moryama, 1997; Pradet-Balade et al., 1997, 1999).
Furthermore, the deleterious effect of the thiocyanate anions, competitors of iodine in
the thyroid metabolism, has been demonstrated in trout and pigs (Anke et al., 1980; Ludke et
al., 1985).
In the fish fed a diet with a low level of toxic compounds (30% of RM1), iodine
supplementation (2 mg/kg) significantly affected plasma T3 levels only after 6 months of
feeding. When fish were fed a diet with a higher level of toxic compounds (50% of RM2), the
effect of the iodine (1 mg/kg) on plasma T3 was stronger and quicker (2 months). The iodine
supplementation did not allow a complete recovery of plasma T3 level and growth rate,
compared to control fish. The dose of iodine used in this study may have been too low to
compounds such as vinyloxazolidinethiones, nitriles, etc., the effects of which remain to be
studied in fish, may disturb the pituitary-thyroid axis at additional levels, so that iodine
supplementation would not completely counteract the global effect of the diet. The difference
between the two diets with regard to rapidity and intensity of the response of fish to the
iodine treatment may be due to a different ratio in thiocyanate anions and other GLS
derivatives in the two RMs used.
In fish, iodine may also be provided by the ambient environment by active transport
across the gills (Lall, 1988). In the present study, the seawater, more rich in iodine than the
freshwater, induced a slight increase in plasma T4 in fish fed with the RM2 diet. Those fish
also showed the stronger response to the iodine supplementation. This supports the idea that
the different content of thiocyanate anions in the two RMs is responsible for the different
effects of iodine supplementation. In addition, this result also suggests that marine fish
species could be less susceptible to RM intake than freshwater fish species, at least for some
diets, with respect to iodine supply. Our data obtained in turbot (Burel et al., 2000b) are in
good agreement with this hypothesis.
Compensatory effects of the deiodinases
We have already suggested that in trout and turbot the deiodinase activities may play
an important role in the regulation of the plasma T3 levels in fish fed RM-based diets (Burel
et al., 2000a,b). Plasma T3 and T4 decreased quickly (after 14 days of feeding) in trout in a
dose-dependent response to GLS breakdown products. The changes in the deiodinase
activities, in compensation to the shortage in bioactive T3 were sensitive and took place even
at the lowest incorporation (10%) of RM. The deiodinase response in liver and brain was
observed after only 7 days of feeding, even before the decrease in plasma thyroid hormone
compensatory activities of deiodinases were very high, but efficient only up to a level of 20%
of dietary RM.
As described in Burel et al. (2000a,b), the stimulation of the in vitro D2 activity in
liver suggested the possibility that in vivo T production from the circulating T3 4 was
increased. In addition, the decrease of in vitro D3 activity observed in brain suggested that the
in vivo degradation of T was reduced, probably to protect the brain against low T3 3 levels. In
the present study, contrary to earlier observations in trout (Burel et al., 2000a), the intake of
toxic compounds had no effect on in vitro D1 activity, an enzyme degrading rT3 but also
converting T4 into T3 as suggested by Kühn et al. (1993).
When the RM-based diets were supplemented with iodine, the plasma T3 level, but
not the T4, was increased. The in vitro deiodinase activities remained unchanged compared to
those in fish fed the unsupplemented RM-based diets. If the iodine supplementation really
enhanced thyroid hormone synthesis in thyroid follicles as discussed above, that was not
sufficiently enough to restore a normal thyroid metabolism, and the level of T4 conversion
into T remained high. 3
supplementation induced abnormally high plasma T
In fish fed a RM-based diet, T3 3
levels, whereas plasma T4 levels remained unchanged. In addition, there was a strong
inhibition of the in vitro conversion of T into T4 3 in liver and a strong stimulation of the in
vitro degradation of T in liver and brain, probably as a compensatory mechanism to the T3 3
overcharge. This is in agreement with the results of Sweeting and Eales (1992) and
MacLatchy and Eales (1993).
In the present study, the short time between the TSH injection and the blood sampling
(24 h) could explain the lack of deiodinase responses. Alternatively, a higher T4 clearance
Relationship between thyroid disturbances and growth capacity of trout
Several authors, including Eales and Shostak (1985), Boeuf and Gaignon (1989),
McCormick and Saunders (1990) and Gomez et al. (1997), have suggested a close
relationship between plasma T levels and growth in fish, probably through the effect of T3 3
on the intermediary metabolism (for review, Leatherland 1994). Moreover, Leatherland et al.
(1987) have shown that a dietary T3 supplementation to trout fed RM-based diets led to an
improvement in the growth performance compared to those in the trout fed the
unsupplemented RM diets. Our data suggest that a certain amount of bioactive T3 is
necessary to support a « normal » growth of the fish and that below a threshold level, growth
capacity is reduced, with a lower body retention of the dietary nitrogen, phosphorus and
energy.
In the present study, T3 (10 and 20 mg/kg) supplementation of RM-based diets led to
higher plasma T3 levels and increased growth performance, but without reaching that of the
control group. This improvement is likely due to a stimulation of feed intake, but feed
efficiency remained low, even if the body retention of phosphorus was improved. Iodine
supplementation also significantly increased plasma T3 level, though to a lower extent than the
T3 supplementation, and growth rate was not as low as that of the fish fed the unsupplemented
RM diet. In this case, the improvement of the growth performance was due to an increase in
the feed efficiency and an improvement of the retention efficiencies in nitrogen, phosphorus,
and energy. These results tend to confirm that the shortage in T3 is, at least partly, responsible
for low feed efficiency observed in fish fed the RM-based diets. The implication of thyroid
hormones in the intermediary metabolism of fish is well known (Leatherland, 1994), but the
lack of data on the digestibility of nutrients and energy contained in the supplemented and
unsupplemented diets prevents conclusions about the respective effects of a shortage in T3 on
The difference between the two RMs with regard to the rapidity and intensity of the
response of the fish to the iodine treatment may be due to a different ratio in thiocyanate
anions and other GLS derivatives in the two RMs used. In the case of the T3 treatment, the
results are only partially in agreement with those of Leatherland et al. (1987). Indeed, with the
same level of T3 supplementation, they observed a growth rate similar to that of the control
fish, with an increase in feed efficiency. Our results suggest that the shortage in T3 only
partially explains the reduced growth of fish. The lower growth rate could also be due, in part,
to a lower nutritional value of the diet, due to a high level of dietary incorporation of RM
containing fibers, tannins, and phytic acid. However, supraphysiological plasma T3
concentrations induce a catabolic state and can lead to cranial malformations, a phenomenon
that we observed in some fish in the present experiment (data not presented), and a depression
of growth (Higgs et al., 1982a). In our study, the mean plasma T3 levels in supplemented fish
were four- to ninefold higher than those in unsupplemented fish, whereas in the study of
Leatherland et al. (1987), they were only two- to fourfold higher. Another test with a lower
dietary T3 supplementation (lower than 10 mg/kg) would be necessary to determine to what
extent the thyroidal disturbance and of the hypothetical low nutritional value of the RM used
here are responsible for the lower growth of trout.
Threshold of sensitivity for an effect on thyroid status and growth
In this study, the dietary incorporation of RM with a low content of GLS at a level of
30% led to a decrease in the growth performance of rainbow trout only after 80 days of
feeding, whereas disturbances in the thyroidal axis were already observed at a level of 10% of
incorporation and after only 14 days of feeding. The results suggests that a plasma T3 level
decreased by about 30% can nevertheless allow a rather normal growth for up to 2 months,
An estimation of the amounts of the breakdown products from GLS in the diet used
was made, suggesting that 1.5 µmol GLS derivatives per gram of diet are sufficient to induce
reduced plasma T4 levels in juvenile rainbow trout. However, for diets containing up to 2.4
µmol of GLS breakdown products per gram or more, it seems that even if the plasma T4
levels are strongly reduced, a compensatory effect due, at least partly, to T4 desiodination into
T led to unaltered plasma T3 3 levels. It remains to be demonstrated that this adjustment is also
sufficient for normal growth at long term. A high dietary content in toxic compounds, for
instance a level of about 17 µmol/g due to the incorporation of 50% of untreated RM (RM2)
in the diet, leads to a drastic reduction of both plasma T and T3 4 levels accompanied by a
rapid decrease of the growth rate (after 24 days of feeding).
Our data are in accordance with those of Yurkowski et al. (1978), Hardy and Sullivan
(1983), and Leatherland et al. (1987), who had all determined a minimum level of GLS and
GLS breakdown products which induced thyroid disturbance in trout in the range of 1-2
µmol/g of diet. In relation to growth performance, our results suggest a critical dietary
content of toxic compound (≤ 3.7 µmol/g of diet) slightly higher than that of those authors
(1-2 µmol/g of diet), but lower than that of Abdou Dade et al. (1990), who have shown that a
RM-based diet containing around 10 µmol/g of GLS had no effect on the growth of rainbow
trout. In fact, the comparison of these results is difficult, because of the potential differences
in the nutritional value of the RM used, the profile of GLS and GLS breakdown products in
the diet, and the different ways to express the GLS dietary contents. Authors indicate either
the total amount of intact GLS, only that of some individual GLS such as progoitrine, or only
the amount of isothiocyanates and oxazolidinethione. When compared to terrestrial animals
(reviews in Mawson et al, 1994a, b), rainbow trout seem to have a thyroid sensitivity similar
µmol/g), and growing poultry (1.4 µmol/g), but a higher sensitivity than that of a young
ruminant such as the calf (8 µmol/g).
ACKNOWLEDGMENTS
This work was partially supported by the CETIOM (Centre Technique
Interprofessionnel des Oléagineux Métropolitains, France), the UNIP (Union Nationale
Interprofessionnelle des Protéagineux, France), and the KU Leuven Onderzoeksraad (project
OT/94/11). The authors gratefully acknowledge the skilled technical assistance of D. Blanc,
J. Brèque, Y. Hontang, A. Le Roux, L. Noterdaeme, P. Peyrotte, F. Sandres, A. Sévère, F.
Terrier, C. Vachot, W. Van Ham, and F. Voets.
REFERENCES
Abdou Dade, B., Aguirre, P., Blanc, D., and Kaushik, S. J. (1990). Incorporation du colza 00
sous forme de tourteau ou d'amande dans les aliments de la truite arc-en-ciel
(Oncorhynchus mykiss): performance zootechnique et digestibilité (Incorporation of
rapeseed 00 shape of cattle cake or almond in diets for rainbow trout (Oncorhynchus
mykiss): zootechnical performance and digestibility). Bulletin Français de la Pêche et de
la Pisciculture317, 50-57.
Akiba, Y., and Matsumoto, T. (1977). Effects of graded doses of goitrin, a goitrogen in
rapeseed, on synthesis and release of thyroid hormone in chicks. Jap. J. Zootech. Sci. 48,
757-765.
Anke, M., Schwarz, S., Hennig, A., Groppel, B., Grun, M., Zenker, G., and Glos, S. (1980).
Der einfluss zusächtlicher zink- und jodgaben auf rapsextraktionsschrotbedingte schäden
Astwood, E. B., Greer, M. A., and Ettlinger, M. G. (1949). L-5-vinyl-2-thiooxazolidone, an
antithyroid compound from yellow turnip and from brassica seeds. J. Biol. Chem. 181,
121-130.
Aumaître, A., Bourdon, D., Peiniau, J. and Bengala Freire, J. (1989). Effect of graded levels
of raw and processed rapeseed on feed digestibility and nutrient utilization in young pigs.
Anim. Feed Sci. Technol.24, 275-287.
Boeuf, G., and Gaignon, J.L. (1989). Effects of rearing conditions on growth and thyroid
hormones during smolting of atlantic salmon Salmo salar L. Aquaculture45, 29-38.
Boeuf, G., and Prunet P. (1985). Measurements of gill (Na+-K+)ATPase activity and plasma
thyroid hormones during smoltification in Atlantic salmon (Salmo salar L.). Aquaculture
45, 111-119.
Bourdon, D. and Aumaître, A. (1990). Low-glucosinolate rapeseeds and rapeseed meals:
effect of technological treatments on chemical composition, digestible energy content and
feeding value for growing pigs. Anim. Feed Sci. Technol. 30, 175-191.
Burel, C., Boujard, T., Escaffre, A. M., Kaushik, S. J., Boeuf, G., Mol, K., Van Der Geyten,
S., and Kühn, E. R. (2000a). Dietary low-glucosinolate rapeseed meal affects thyroid
status and nutrient utilization in rainbow trout (Oncorhynchus mykiss). Br. J. Nutr. 83,
653-664.
Burel, C., Boujard, T., Kaushik, S. J., Boeuf, G., Van Der Geyten, S., Mol, K., Kühn, E. R.,
Quinsac, A., Krouti, M., and Ribaillier, D. (2000b). Potential of plant-protein sources as
fish meal substitutes in diets for turbot (Psetta maxima): growth, nutrient utilisation and
thyroid status. Aquaculture188, 363-382.
Eales, J.G., and Shostak, S. (1985). Correlations between food ration, somatic growth
parameters and thyroid function in artic charr, Salvelinus alpinus L. Comp. Biochem.
Ferrando, R., and Blum, J. C., (Eds.) (1989) L'alimentation des animaux monogastriques:
porc, lapin, volaille (Nutrition of monogastric animals: pig, rabbit, poultry), 293 p. INRA,
Paris, France.
Gomez, J.M., Boujard, T., Boeuf, G., Solari, A., and Le Bail, P.-Y. (1997). Individual diurnal
plasma profiles of thyroid hormones in rainbow trout (Oncorhynchus mykiss) in relation to
cortisol, growth hormone, and growth rate. Gen. Comp. Endocrinol. 107, 74-83.
Hardy, R. W., and Sullivan, C. V. (1983). Canola meal in rainbow trout (Salmo gairdneri)
production diets. Can. J. fish. Aquat. Sci. 40, 281-286.
Higgs, D. A., Fagerlund, U. H. M., Eales, J. G., and McBride, J. R. (1982a). Application of
thyroid and steroid hormones as anabolic agents in fish culture. Comp. Biochem. Physiol.
73B (1), 143-176.
Higgs, D. A., McBride, J. R., Markert, J. R., Dosanjh, B. S., Plotnikoff, M. D., and Clarke,
W. C. (1982b). Evaluation of Tower and Candle rapeseed (Canola) meal and Bronowski
rapeseed protein concentrate as protein supplements in practical dry diets for juvenile
chinook salmon (Oncorhynchus tshawytscha). Aquaculture29, 1-31.
Hossain, M. A., and Jauncey, K. (1988). Toxic effects of glucosinolate (allyl isothiocyanate)
(synthetic and from mustard oilcake) on growth and food utilization in common carp.
Indian J. Fish. 35, 186-196.
Kühn, E. R., Mol, K. A., and Darras, V. M. (1993). Control strategies of thyroid hormone
monodeiodination in vertebrates. Zoological Science10, 873-885.
Lall, S.P. (1988). Minerals. In « Fish Nutrition » (J.E. Halver, Ed.), pp. 219-257. Academic
Press, Inc.
Larsen, D.A., Dickey, J.T. Dickhoff, W.W. (1998). Quantification of salmon thyrotropin-β
(TSH)-subunit messenger RNA by an RNase protection assay: regulation by thyroid
Leatherland, J. F., Hilton, J. W., and Slinger, S. J. (1987). Effects of thyroid hormone
supplementation of canola meal-based diets on growth, and interrenal and thyroid gland
physiology of rainbow trout (Salmo gairdneri). Fish Physiol. Biochem. 3, 73-82.
Leatherland, J.F. (1994). Reflections on the thyroidology of fishes: from molecules to
humankind. Guelph Ichthyol. Rev.2, 1-67.
Lesel, M. (1981). Microflore bactérienne du tractus digestif. In Nutrition des Poissons (M.
Fontaine, Ed.), pp. 89-100. Actes Coll. CNERDA, Paris, May 1979, CNRS, Paris.
Lo, M. T., and Hill, D. C. (1971). Effect of feeding a high level of rapeseed meal on weight
gains and thyroid function of rats. J. Nut. 101, 975-980.
Ludke, H., Schone, F., and Hennig, A. (1985). Der einfluss von jodkupfer- und zink- zulagen
zu rationen mit hohem rapsextraktionsschrotanteil auf wachstum und schildrüssenfunktion
des mastschweines. 1. Einfluss auf die mastleistung. Arch. Tierernähr., Berlin 35,
835-845.
MacLatchy, D. L., and Eales, J. G. (1993). Effect of T or T3 4 challenge on inner- and
outer-ring deiodination of T and T3 4 in the liver, kidney, and gill of rainbow trout,
Oncorhynchus mykiss. J. Exp. Zool.265, 637-645.
Martinez, I., Dreyer, B., Argersborg, A., Le Roux, A., and Boeuf, G. (1995). Effect of
triiodothyronine and rearing temperature on growth and skeletal myosin heavy chain
isoform transition during early development in salmonid (Salvelinus alpinus L.). Comp.
Biochem. Physiol. 112B, 717-725.
Mawson, R., Heaney, R. K., Zdunczyk, Z., and Kozlowska, H. (1993). Rapeseed
meal-Glucosinolates and their antinutritional effects. Part 1. Rapeseed production and chemistry
Mawson, R., Heaney, R. K., Zdunczyk, Z., and Kozlowska, H. (1994a). Rapeseed
meal-Glucosinolates and their antinutritional effects. Part 3. Animal growth and performance.
Nahrung38, 167-177.
Mawson, R., Heaney, R. K., Zdunczyk, Z., and Kozlowska, H. (1994b). Rapeseed
meal-Glucosinolates and their antinutritional effects. Part 4. Goitrogenicity and internal organs
abnormalities in animals. Nahrung38, 178-191.
McCormick, S.D., and Saunders, R.L. (1990). Influence of ration level and salinity on
circulating thyroid hormones in juvenile atlantic salmon (Salmo salar). Gen. Comp.
Endocrinol. 78, 224-230.
McMillan, M., Spinks, E. A., and Fenwick, G. R. (1986). Preliminary observations on the
effect of dietary brussels sprouts on thyroid function. Human Toxicolo. 5, 15-19.
Mol, K., Van der Geyten, S., Burel, C., Darras, V.M., Boujard, T., and Kühn, E.R. (1998).
Comparative study of iodothyronine outer ring and inner ring deiodinases activities in five
teleostean fishes. Fish Physiol. Biochem18, 253-266.
Moriyama, S., Swanson, P., Larsen, D. A., Miwa, S., Kawauchi, H., and Dickhoff, W. W.
(1997). Salmon thyroid-stimulating hormone: isolation, characterisation, and development
of a radioimmunoassay. Gen. Comp. Endocrinol. 108, 457-471.
National Research Council (NRC) (1993). Nutrient Requirements of Fish (Committee on
Animal Nutrition, Board on Agriculture, National Research Council, Ed.), 114 p. National
Academic Press, Washington, D.C.
Pradet-Balade, B., Schmitz, M., Salmon, C., Dufour, S., and Quérat, B. (1997).
Down-regulation of TSH subunit mRNA levels by thyroid hormones in the european eel. Gen.
Pradet-Balade, B., Burel, C., Dufour, S., Boujard, T., Kaushik, S.J., Quérat, B., and Boeuf, G.
(1999). Thyroid hormones down-regulate thyrotropin ββ mRNA level in vivo in the turbot
(Psetta maxima). Fish Physiol. Biochem. 20, 193-199.
Quérat, B., Hardy, A., and Fontaine, Y.A. (1991). Regulation of the type-II gonadotropin αα
and ββ subunit mRNAs by oestradiol and testosterone in the European eel. J. Mol.
Endocrinol., 7, 81-86.
Quinsac, A., Ribaillier, D., Elfakir, C., Lafosse, M., and Dreux, M. (1991). A new approach
to the study of glucosinolates by isocratic liquid chromatography. Part I. Rapid
determination of desulfated derivatives of rapeseed glucosinolates. J. Assoc. Off. Anal.
Chem., 74, 932-939.
Sweeting, R. M., and Eales, J. G. (1992). The acute influence of ingested thyroid hormones
on hepatic deiodination pathways in the rainbow trout, Oncorhynchus mykiss. Gen. Comp.
Endocrinol. 85, 376-384.
Teskeredzic, Z., Higgs, D. A., Dosanjh, B. S., McBride, J. R., Hardy, R. W., Beames, R. M.,
Jones, J. D., Simell, M., Vaara, T., and Bridges, R. B. (1995). Assessment of
undephytinized and dephytinized rapeseed protein concentrate as sources of dietary
protein concentrate as sources of dietary protein for juvenile rainbow trout (Oncorhynchus
mykiss). Aquaculture131, 261-277.
Vermorel, M., and Evrard, J. (1987). Valorization of rapeseed meal. 4. Effects of iodine,
copper and ferrous salt supplementation in growing rats. Reprod. Nutr. Dévelop. 27,
769-779.
Vermorel, M., Davicco, M.-J., and Evrard, J. (1987). Valorization of rapeseed meal. 3.
Effects of glucosinolate content on food intake, weight gain, liver weight and plasma
Virtanen, A. I., Kreula, M., and Kiesvaara, M. (1958). The transfer of
L-5-vinyl-2-thiooxazolidone (oxazolidinethione) to milk. Acta Chem. Scand. 12 (3), 580-581.
Webster, C. D., Tiu, L. G., Tidwell, J. H., and Grizzle, J. M. (1997). Growth and body
composition of channel catfish (Ictalurus punctatus) fed diets containing various
percentages of canola meal. Aquaculture150, 103-112.
Yurkowski, M., Bailey, J. K., Evans, R. E., Tabachek, J.-A. L., and Burton Ayles, G. (1978).
Acceptability of rapeseed proteins in diets of rainbow trout (Salmo gairdneri). J. Fish.
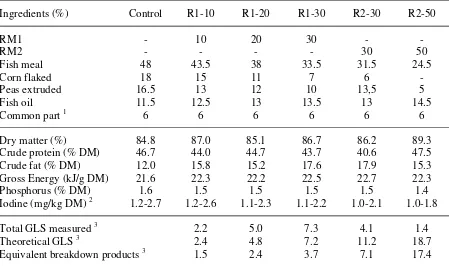
TABLE 1.
Ingredients and chemical composition of the basic diets used during the experiments
Ingredients (%) Control R1-10 R1-20 R1-30 R2-30 R2-50
RM1 - 10 20 30 - - Iodine (mg/kg DM) 2 1.2-2.7 1.2-2.6 1.1-2.3 1.1-2.2 1.0-2.1 1.0-1.8 Total GLS measured 3 2.2 5.0 7.3 4.1 1.4 Theoretical GLS 3 2.4 4.8 7.2 11.2 18.7 Equivalent breakdown products 3 1.5 2.4 3.7 7.1 17.4
1 Common part: 3% soluble fish protein concentrate (CPSP-G, Sopropêche, France); 1% vitamin
mixture (NRC, 1993); 1% mineral mixture (in g or mg/kg diet : calcium carbonate (40% Ca), 1.12 g; magnesium oxide (60% Mg), 0.62 g; ferric citrate, 0.1 g; potassium iodide (75% I), 0.2 mg; zinc sulphate (36% Zn), 0.2 g; copper sulphate (25% Cu), 0.15 g; manganese sulphate (33% Mn), 0.15 g; dibasic calcium phosphate (20% Ca, 18% P), 2.5 g; cobalt sulphate, 1 mg; sodium selenite (30% Se), 1.5 mg; KCl, 0.45g; NaCl, 0.2 g); 1% binder (alginate).
2 The total dietary iodine levels were estimated from the ingredients iodine contents given by
Ferrando and Blum (1989).
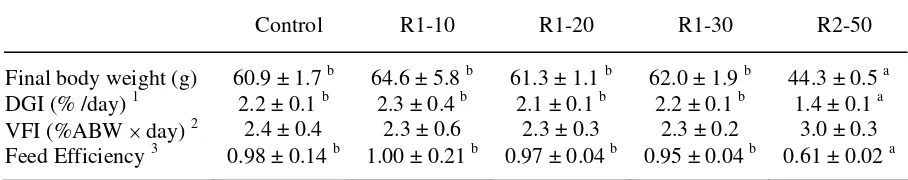
TABLE 2.
Growth performance of trout (initial body weight: 22g) fed the experimental diets during 58 days in Experiment 1.
Control R1-10 R1-20 R1-30 R2-50 Final body weight (g) 60.9 ± 1.7 b 64.6 ± 5.8 b 61.3 ± 1.1 b 62.0 ± 1.9 b 44.3 ± 0.5 a DGI (% /day) 1 2.2 ± 0.1 b 2.3 ± 0.4 b 2.1 ± 0.1 b 2.2 ± 0.1 b 1.4 ± 0.1 a VFI (%ABW × day) 2 2.4 ± 0.4 2.3 ± 0.6 2.3 ± 0.3 2.3 ± 0.2 3.0 ± 0.3 Feed Efficiency 3 0.98 ± 0.14 b 1.00 ± 0.21 b 0.97 ± 0.04 b 0.95 ± 0.04 b 0.61 ± 0.02 a
Note. Means are indicated with standard deviation (n = 3). Superscript letters indicate intergroup statistical differences (one way ANOVA and Tukey’s multiple range analysis; P < 0.05) between dietary conditions. IBW, FBW and ABW are initial, final and average body weights, respectively.
1
Daily growth index = 100 × ((FBW)1/3 - (IBW)1/3) / duration
2
Average of voluntary feed intake calculated for each period as follow: VFI = 100 × dry feed intake (g) / ((IBW + FBW) / 2) × duration
3
TABLE 3.
Coefficients of retention (% of intake) for nitrogen, phosphorus and energy in trout (initial body weight: 24 g) fed the experimental diets during 55 days in Experiment 2.
Dietary treatments Control R2-50 R2-50-I R2-50-T310 R2-50-T320
Nitrogen 39.0 ± 2.9 d 15.2 ± 0.6 a 24.1 ± 1.3 b 18.2 ± 1.6 a 17.8 ± 1.7 a Phosphorus 29.6 ± 2.6 d 10.9 ± 1.1 a 19.8 ± 0.6 c 15.2 ± 0.6 b 15.3 ± 1.2 b Energy 44.9 ± 3.5 c 21.1 ± 1.8 a 32.4 ± 2.0 b 18.6 ± 3.0 a 22.9 ± 1.8 a
TABLE 4.
Effect of THS treatment (200 mg/l) on the In vitro D1 activity (conversion of rT3) measured in kidney, D2 activity (conversion of T4) in liver, and D3 activity (conversion of T3) in liver and brain measured 24 h after injection in trout (mean weight around 55g) fed with a control diet or with a RM2-based diet for 64 days (Experiment 2).
Control diet R2-50 diet
Sham TSH Sham TSH
D1 kidney 227 ± 75 165 ± 68 193 ± 19 168 ± 18
fmol rT /mg protein/min 3
D2 liver
fmol T4/mg protein/min 12 ± 5 a
21 ± 13 a 212 ± 4 b 201 ± 15 b
D3 liver
fmol T3/mg protein/min 3.68 ± 1.81 b
4.93 ± 2.75 b 0.25 ± 0.44 a 0.37 ± 0.78 a
D3 brain
fmol T3/mg protein/min 4.71 ± 1.28 b
5.72 ± 1.53 b 1.66 ± 0.33 a 2.22 ± 0.49 a
FIGURE LEGENDS
FIG 1. Changes over time in plasma concentrations of thyroxine (T4) (A) and
triiodothyronine (T3) (B) in Experiment 1. Means (± standard deviation, n=15) sharing no
common superscript letter are significantly different (P < 0.05, one-way ANOVA and
Tukey’s multiple range test).
FIG 2. Changes over time of in vitro deiodinase activities for each dietary treatment in
Experiment 1: D1 activity in kidney (A, deiodination of rT3), D2 activity in liver (B,
deiodination of T ) and D3 activity in liver and brain (C and 3D, deiodination of T4 3). Means
(± standard deviation; n=3, samples pooled by 5) with no common superscript letter are
significantly different (P < 0.05, one-way ANOVA and Tukey’s multiple range test).
FIG 3. Plasma concentrations of T and T3 4 (A), daily growth index (B), voluntary feed intake
and feed efficiency (C) measured in trout (FBW of 54 g) after 2 months of dietary treatment
in Experiment 2. The RM2 based diet was supplemented with 10 or 20 mg/kg of T3 or with 1
mg/kg of iodine. Means (± standard deviation, n=15) with no common letter are significantly
different (P < 0.05, one-way ANOVA and Tukey’s multiple range test).
FIG 4. In vitro D1 activity (conversion of rT3) measured in kidney (A), D2 activity
(conversion of T ) in liver (B), and D3 activity (conversion of T4 3) in liver and brain (C) in
trout (mean weight around 50g) after 2 months of dietary treatment in Experiment 2. The
RM2 based diet was supplemented with 10 or 20 mg/kg of T3 or with 1 mg/kg of iodine.
Means (± standard deviation; tissues pooled by 5, n=3) with no common letter are
significantly different (P < 0.05, one-way ANOVA and Tukey’s multiple range test).
FIG 5. Effect of TSH treatments (sham saline solution, 100 mg/l of TSH or 200 mg/l of TSH)
on plasma concentrations of T3 and T4,, measured 24 h after injection, in trout (mean weight
Means (± standard deviation ; n=9) with no common letter are significantly different (P < 0.05,
one-way ANOVA and Tukey’s multiple range test).
FIG 6. Plasma concentrations of T3 and T4 (A), specific growth rate (B), and voluntary feed
intake (VFI) and feed efficiency (FE) (C) measured in trout after two months (fish mean
weight around 90 g), then after 6 months (fish mean weight around 300 g) of feeding in
Experiment 3. The RM1-based diet was supplemented with 2 mg/kg of iodine. Means (±
standard deviation; n=15) with no common letter are significantly different (P < 0.05,
one-way ANOVA and Tukey’s multiple range test).
FIG 7. Changes over time of trout mean weight in relation with the experimental diet intake
in Experiment 3. For each sample time, * indicates a statistical difference between dietary
treatments with P < 0.05 (one-way ANOVA). Means (± standard deviation; n=3) with no
common letter are significantly different (Tukey’s multiple range test).
FIG 8. Effect of aquatic environment on plasma concentrations of T and T3 4 measured in
trout (initial mean weight around 160 g) fed with a control diet or with two RM-based diets
for 25 days in Experiment 4. Means (± standard deviation; n=15) with no common letter are
significantly different (P < 0.05, two-ways ANOVA and Tukey’s multiple range test).
FIG 9. Main processes of action of the glucosinolates in rainbow trout. Two asterisks,
original observations; one asterisk, observations made during this study that are not original;
Figure 1.
Figure 2
Figure 3
Figure 4
Figure 5
Figure 6
Figure 7
Figure 8
Incorporation of I2 containing in rapeseed meal
(fibres, tannins, saponins,