www.elsevier.nlrlocaterjappgeo
Multi-frequency synthetic-aperture imaging with a lightweight
ground penetrating radar system
Steven K. Koppenjan
a,), Curt M. Allen
a, Duane Gardner
a, Howard R. Wong
a,
Hua Lee
b, Stephanie J. Lockwood
b aSpecial Technologies Laboratory, Bechtel NeÕada, Santa Barbara, CA, 93111, USA
b
Department of Electrical and Computer Engineering, UniÕersity of California, Santa Barbara, CA 93106, USA
Received 1 October 1998; received in revised form 18 February 1999; accepted 18 October 1999
Abstract
Ž .
The detection of buried objects, particularly hazardous waste containers and unexploded ordnance UXO , has gained significant interest in the Unites States in the late 1990s. The desire to remediate the thousands of sites worldwide has become an increasing concern and the application of radar to this problem has received renewed attention. The US
Ž .
Department of Energy’s Special Technologies Laboratory STL , operated by Bechtel Nevada, has developed several
Ž . Ž .
frequency-modulated, continuous-wave FM-CW ground penetrating radar GPR units. To meet technical requirements for
Ž .
higher-resolution data, STL and the University of California, Santa Barbara UCSB is investigating advanced GPR hardware, signal processing, and synthetic-aperture imaging with the development of an innovative system. The goal is to design and fabricate a lightweight, battery-operated unit that does not require surface contact, can be operated by a novice user, and can achieve improved resolution. The latter is accomplished by using synthetic-aperture imaging, which forms the subsurface images by fully utilizing the data sequences collectively along a scan path. We also present the backward propagation algorithm as the basic structure of the multiple-frequency tomographic imaging technique, and the conventional
Ž .
fast Fourier transform FFT method which can be described as a degenerated case of the model where the computation procedure is approximated under the narrow-beam assumption.q2000 Elsevier Science B.V. All rights reserved.
Keywords: Ground penetrating radar; FM-CW; Synthetic-aperture imaging; Synthetic aperture radar
1. Introduction
Ž .
Special Technologies Laboratory’s STLs
original frequency-modulated, continuous-wave ŽFW-CW ground penetrating radar GPR unit. Ž .
)Corresponding author. Tel.: q1-805-681-2453; fax:
q1-805-681-2471; e-mail: [email protected]
ŽKoppenjan and Bashforth, 1993 was designed. to meet Naval Explosive Ordnance Division criteria for the detection of buried ordnance and has also been applied to many other areas in-cluding hazardous waste containers, site
charac-Ž .
terization Koppenjan and Martinez, 1994 , util-ity lines, tunnels, and fossilized dinosaur bones. The unit weighed 40 kg, required intimate ground contact for optimum performance, and
0926-9851r00r$ - see front matterq2000 Elsevier Science B.V. All rights reserved. Ž .
the coherent version with multi-frequency su-perposition and round-trip.
2. System hardware
2.1. System hardware description
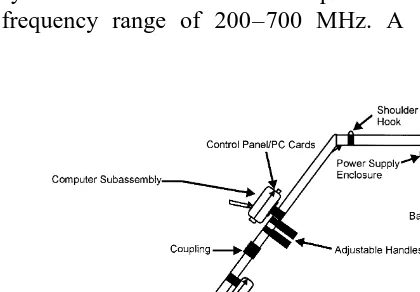
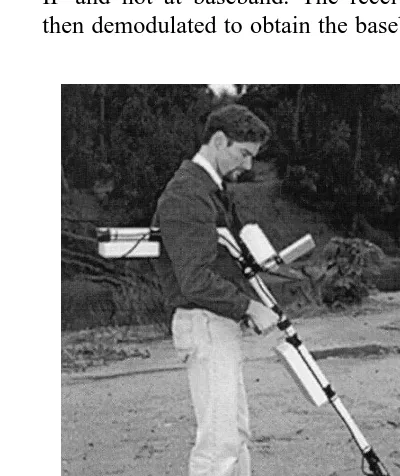
The GPR-X is a portable, self-contained unit that weighs 10 kg and consists of four sub-assemblies: the computer, radar, antenna, and power supply. The unit is illustrated in Fig. 1. It acquires, processes, and displays data in real-time at 30 sweeps per second. The core of the system is a FM-CW radar that operates over the frequency range of 200–700 MHz. A 16-bit
Fig. 1. GPR-X system diagram.
houses a PC104 bus-based computer, a
digital-Ž .
signal processing DSP board, a liquid crystal
Ž . Ž .
display LCD , a PC formerly PCMCIA card interface board, a user interface board, and a digital interface module. The PC operates the GPR software, which controls data acquisition, signal processing and depth profile display. This process is performed in parallel, and greatly increases the overall system speed. The DSP is an AT and T WE32DSP which operates at 50 MHz.
The LCD is a low-power, 640=480 resolu-tion screen with a 0.19 dot pitch. It is a super-twisted pneumatic type with transflective back-ing and can be viewed in direct sunlight. The video control board uses a polynomial-based frame rate control and a dithering algorithm to produce 64 gray shades. A split-screen display is implemented to allow scrolling of data at 30 Hz while maintaining a stable user interface display area. This high scroll rate is accom-plished by manipulating the screen home posi-tion as opposed to shifting video memory.
The PC card sockets accept flash memory cards for saving data. The user interface con-tains two encoders for display adjustments and a save button. The digital interface module con-trols the data transfers from the radar section,
Ž .
Fig. 2. GPR-X functional block diagram.
Ž .
access DMA of the digitized radar data with the computer.
2.3. Radar subassembly and system operation
The radar subassembly contains the RF elec-tronics and ADC circuitry, and is controlled by the digital interface board in the computer. The digital interface board initiates data acquisition by programming the PLL to step in frequency. The PLL with a crystal oscillator source and RF oscillators are used to synthesize the 200 to 700 MHz signal. The crystal oscillator also gener-ates system reference frequencies used by the timing board, the modulator, and the demodula-tor. The timing board generates the system clock signals and the 1.25 MHz intermediate
fre-Ž .
quency IF modulation signals.
Before the RF signal is transmitted, it is phase modulated at an intermediate frequency of 1.25 MHz. When a radar return signal is mixed directly to baseband and amplified, a phenomenon known as 1rf noise or flicker noise exists. This noise is also amplified and is
very prevalent at low frequencies. It is defined by the noise-temperature ratio of the receive mixer and varies inversely with frequency. Above approximately 500 kHz, the
noise-tem-perature ratio approaches a constant value ŽSkolnik, 1980 . To reduce the effects of 1. rf
noise, the transmitted RF signal is phase modu-lated at an intermediate frequency, 1.25 MHz in this case, and amplification takes place at this IF and not at baseband. The receive signal is then demodulated to obtain the baseband signal.
housing is constructed with carbon-fiber absorb-ing material that shields the antenna and attenu-ates the back lobes. The typical E-field beam-width, measured at the 3 dB point, is 1208 at
200 MHz and decreases to approximately 908 at
700 MHz. The H-field beamwidth is less than 908 over the 200 to 700 MHz frequency range.
Through the use of the absorbing material, the usable bandwidth is increased to a multi-octave range, 200 to 1000 MHz. The return loss is better than y15 dB.
2.5. Power supply subassembly
The power supply uses 14.4-V, 50-W,
rechargeable NiCad batteries. These are high quality, commercial off-the-shelf batteries.
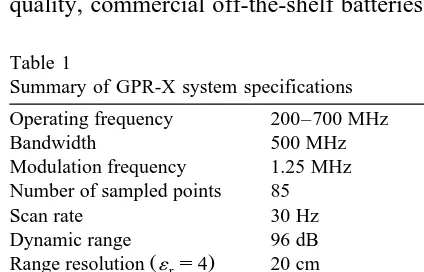
Typ-Table 1
Summary of GPR-X system specifications Operating frequency 200–700 MHz
Bandwidth 500 MHz
Modulation frequency 1.25 MHz Number of sampled points 85
Scan rate 30 Hz
Dynamic range 96 dB
Ž .
Range resolution ´s4 20 cm
r
Ž .
Depth penetration ´rs4 5 m
Antenna type Monostatic Bowtie
Weight 10 kg
Power source Rechargeable NiCad
Ž3 hr usage.
The GPR-X records complex, or sampled I and Q, data at 85 linear increments over the 200 to 700 MHz frequency band. This data is con-verted into its frequency domain representation Žtime-domain pulse response equivalent in or-. der to display the radar return as a depth profile. This is accomplished using a narrow-beam im-age reconstruction algorithm. This algorithm is a simple version of the two-dimensional SAR reconstruction algorithm developed in Section 4, and can be implemented as a FFT.
Real-time algorithms can be implemented on the data because of the system architecture and on-board DSP. Currently a 256-point complex FFT is performed on the radar data to obtain the
time-domain pulse response equivalent. A
Kaiser–Bessel window is applied to the raw data before the FFT. The GPR-X has a simple interface with only two radar adjustments: a linear ‘‘scale’’ and exponential ‘‘range gain.’’ Other signal processing algorithms, such as auto gain adjustment, are being developed. This will increase the system performance and target de-tection capability while maintaining minimal user interface, allowing operation by a novice user.
3.2. Data and display
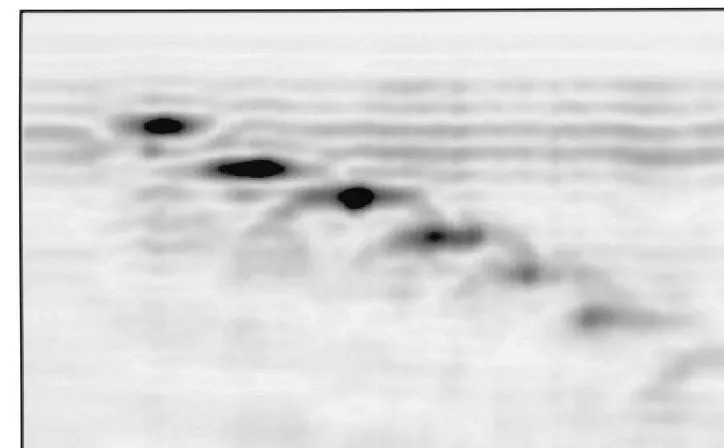
two-Fig. 4. Depth profile of metal plates using narrow-beam image reconstruction algorithm.
pixels wide by four-pixels high and equals 5 cm in range, assuming ´ s4. The strength of the
r
radar return is intensity mapped to a 64-level gray scale. A total of 80 FFT channels are displayed, which equates to a total range of 4 m. As shown in Fig. 4, the data quality of the GPR-X equals that of the original STL
ground-Ž
contact GPR as previously reported Koppenjan .
and Bashforth, 1993 . The data were acquired with an air gap of approximately 5 to 15 cm. The data clearly show the radar returns from seven metal plates buried linearly from 0.3 to 2.2 m deep in a test pit. The plates are 0.3=0.3 m square and spaced 0.3 m apart.
3.3. Image processing
The FM-CW GPR system described in this paper has been traditionally modeled as a point-by-point strip-mapping device. At each receiv-ing position, an FFT is taken to form the range profile of the subsurface target distribution. The multiple-frequency complex-wave data at each surface location was processed independently
and there was no procedure to compensate for diffraction in the cross-range direction.
In Section 4, a different modeling technique is presented. Instead of a simple FFT for range estimation, the system is now modeled as a synthetic-aperture multiple-frequency system operating in reflection mode. A sequence of 128 coherent backward-propagation procedures are conducted to form the composite image, which is the superposition of 128 holographic sub-images, each for every coherent frequency step. As a result, diffraction is fully compensated in both range and cross-range directions, and, hence, overall quality of the images is im-proved.
4. Synthetic aperture radar image recon-struction
4.1. Synthetic-aperture microwaÕe image
recon-struction algorithm
Traditional GPR systems operate largely in a localized mode, estimating the range informa-tion from the time delay of the illuminainforma-tion waveform at a particular location. The resultant image is typically the range profile of a subsur-face region over a survey area, a composite image formed by range profiles at various re-ceiving positions. This means the estimation process associated with image formation is ef-fective only in the range direction. If the illumi-nation hardware is a narrow-beam system, the image profile will be sufficiently accurate, since there is no correlation of information contents between data sets collected at different receiv-ing positions. However, most GPR systems op-erate with one receiving antenna instead of a large physical antenna array, so as a result the beam patterns have significant spread and the narrow-beam assumption is not valid. There-fore, image reconstruction algorithms need to be able to resolve in both range and cross-range directions.
Step FM-CW systems is an alternative to the classical CW-pulse or linear-chirp systems. It steps through a sequence of N frequencies dur-ing a so-called illumination period. Within each frequency step, it functions like a coherent CW system. And during the period of one frequency step, the data acquisition system produces the complex amplitude of the returned coherent waveform from the twin output channels.
wavelengths. Each coherent data set can be considered as a hologram over the aperture at that particular wavelength. Subsequently, a holographic reconstruction of the subsurface profile can be formed by a linear filtering pro-cess, known as backward propagation, with the transfer function in the form of
1 2
H f
Ž .
sexp j2pz(
yfŽ .
2x
ž
l2 x/
where fx is the spatial frequency in the x Ž direction, and z is the range distance
Good-.
man, 1968; Lee et al., 1982 . This operation is
the backward propagation process in the
spatial-frequency domain. It is a numerical fo-cusing procedure which corrects for the diffrac-tion effects in both range and cross-range direc-tions to form the holographic image. GPR sys-tems are classified as pulse-echo sensing de-vices. Thus, the range parameter needs to be scaled by a factor of two to correct for the round-trip effect.
Assuming the characteristics of the targets remains the same over the frequency span, we can reconstruct the overall image by superim-posing all N holographic sub-images.
s x , z
ˆ
Ž
.
sÝ
sˆ
lkŽ
x , z.
Ž .
3k
Step 1: Partition the data based on the fre-quency index and regroup the data into N spa-tial data sets. Each spaspa-tial data set is associated with one unique frequency index.
Step 2: Convert the index from frequency to operating wavelength.
Step 3: Fourier transform each spatial data set to represent the wavefield in the spatial-frequency domain.
Step 4: Apply the backward propagation fil-ter to the wavefield in the spatial-frequency domain. Since the formula of the backward propagation filter is wavelength dependent, each coherent spatial data set is processed by a unique backward propagation filter corresponding to its wavelength index. The wavefield gains an addi-tional dimension by backward propagating in the range direction. Note that the backward propagated wavefield is now in the space do-main in the range direction and in the spatial-frequency domain in cross-range directions.
Step 5: Superimpose N backward propagated wavefields.
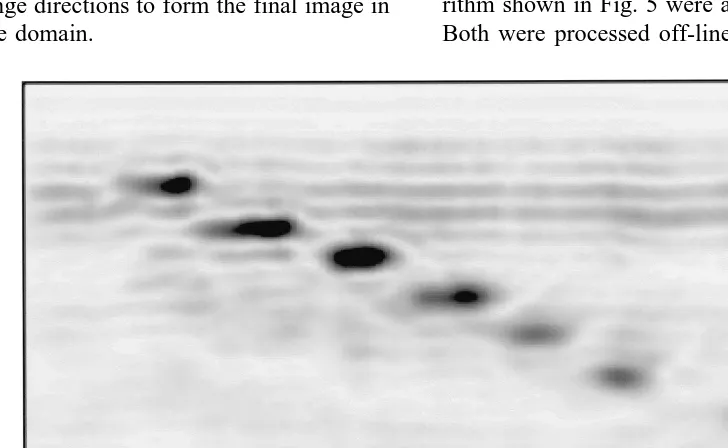
Step 6: Inverse Fourier transform in the cross-range directions to form the final image in the space domain.
The backward propagation technique is a lin-ear, space-invariant, and stable filtering proce-dure. It conducts image formation with consis-tent performance and resolving capability, and can be implemented in parallel form for high-speed processing. Therefore it has been utilized in a wide range of applications of various imag-ing configurations and modes. The resolution in the range direction is determined by the spectral bandwidth of the illumination waveforms. In the cross-range direction, the resolution is governed
Ž .
by the span of the aperture Chang et al., 1994 . The unit-magnitude all-phase backward propa-gation filter is based on the model of the ideal receiver. For data acquisition antennas of vari-ous size and shapes, the transfer function can be modified accordingly for optimal image forma-tion.
4.2. Results of the SAR algorithm
The narrow-beam reconstructive algorithm ŽFFT as previously shown in Fig. 4 and the. synthetic aperture image reconstruction algo-rithm shown in Fig. 5 were applied to raw data. Both were processed off-line as opposed to the
5. Conclusions
We have demonstrated the ability to acquire high-quality GPR data without intimate ground contact. The packaging allows the system to be quickly assembled, and by reducing the com-plex radar adjustments, the operation allows use by a novice operator. Operators have been trained in less than 1 h to successfully detect real-world targets. When operating in the point-by-point mapping mode, the step-frequency illu-mination scheme significantly reduces the com-plexity of the profiling process and the range estimation procedure is simplified down to a FFT operation. To develop the resolving capa-bility in both range and cross-range direction, we model the device as a multiple-frequency holographic data acquisition system operating in synthetic-aperture format and utilize backward propagation technique for multi-dimensional image reconstruction. With a combination of high-quality data acquisition hardware and high-resolution image formation technique, this system provides superior imaging capability for subsurface profiling. We are currently research-ing the implementation of real-time SAR algo-rithms to be incorporated onto the GPR.
References
Chang, M., Akiyama, I., Lee, H., 1994. Image reconstruc-tion and enhancement for subsurface radar imaging using wavefield statistics. Proceedings of the 28th An-nual Asilomar Conference on Signals, Systems, and Computers, pp. 1200–1204.
Goodman, J.W., 1968. Introduction to Fourier Optics. McGraw-Hill, New York.
Koppenjan, S.K., Bashforth, M.B., 1993. The Department
Ž .
of Energy’s Ground Penetrating Radar GPR , an
FM-Ž .
CW system. In: Del Grande, N.K. Ed. , Underground and Obscured Object Imaging and Detection. Proceed-ings SPIE 1942, pp. 44–55.
Koppenjan, S.K., Martinez, M.G., 1994. Site Characteriza-tion at the Rabbit Valley Geophysics Performance
Ž .
Evaluation Range. In: Bell, R.F. Ed. , Site Characteri-zation I: Techniques and Applications. Symposium on the Application of Geophysics to Engineering and
En-Ž .
vironmental Problems SAGEEP’94 , pp. 55–80. Koppenjan, S.K., Allen, C.M., Gardner, D., Wong, H.R.,
1998. A Lightweight Ground Penetrating Radar. Pro-ceedings Seventh International Conference on Ground Penetrating Radar, Vol. 2, pp. 771–773.
Lee, H., Wade, G., Noorbehesht, B., 1982. The transfer functions of electrostatics problems. IEEE Transactions
Ž .
on Education E 25 3 , 111–112.
Mast, J.E., Lee, H., Murtha, J.P., 1994. High-resolution microwave subsurface nondestructive evaluation for civil structures and materials. International Advances in Nondestructive Testing 17, 207–250.