Modeling the College Application Decision Process in a
Land-Grant University
Stephen L. DesJardins
a,*, Halil Dundar
b, Darwin D. Hendel
aaOffice of Planning and Analysis, University of Minnesota, 160 Morrill Hall, 100 Church Street S.E., Minneapolis, MN 55455,
USA
bFaculty of Education, Middle East Technical University, Ankara, Turkey
Received 21 May 1997; accepted 6 March 1998
Abstract
Over the past two decades as student recruitment has become increasingly important, numerous studies have examined the college choice process in an attempt to identify factors influencing students’ decision making. The findings from these studies are particularly helpful for college administrators in identifying a potential pool of desirable students and in implementing new recruitment techniques. In this study we used a logistic regression model to investigate the effects of variables relating student characteristics and institutional factors on the decision to apply to a large land-grant university. [JEL I21]1998 Elsevier Science Ltd. All rights reserved.
1. Introduction
Each year millions of high school graduates make decisions about whether to continue their education, and if so, where to apply and enroll. For some students the choice process is relatively simple because of the exist-ence of a particular academic program in a specific insti-tution, the proximity of an institution of higher edu-cation, or a host of other factors. For others the choice process is difficult as they attempt to find an institution that will match their educational goals, interests and fin-ancial constraints.
College choice decision making is important for the student and also has implications for institutional policy. A student’s college choice strongly influences his or her professional career, and there is evidence to indicate that the type of postsecondary education a student completes yields differential outcomes (Hossler et al., 1989). How-ever, these differential outcomes may be less pronounced when one controls for (possibly) confounding factors
* Corresponding author
0272-7757/98/$ - see front matter1998 Elsevier Science Ltd. All rights reserved. PII: S 0 2 7 2 - 7 7 5 7 ( 9 8 ) 0 0 0 2 3 - 5
such as individual characteristics and choice of academic major. An institution also has a vested interest in under-standing the factors that influence students’ application and enrollment decisions in order to attempt to increase the “fit” between students and the institution. If individ-uals’ goals and institutional factors are not congruent, recruitment may be ineffective and retention problems may ensue. Institutions can use the results of student col-lege choice modeling (a) to develop marketing strategies designed to attract sufficient numbers of students with the desired academic and nonacademic characteristics, and (b) to more effectively target limited financial aid resources.
importance of student recruitment (Paulsen, 1990). If used effectively, studies of college choice can provide valuable information in developing marketing, recruit-ment and retention strategies (Hossler, 1984).
Despite the importance of such information, the litera-ture on college choice is incomplete, particularly with respect to the examination of the factors affecting student choices at different types of institutions. Many insti-tutions have little information about the factors influenc-ing prospective students’ college choice processes. The purpose of this study is to extend the previous studies of college choice by examining the factors affecting stu-dents’ decisions to apply to a large land-grant institution. Some of the questions our research addresses are: What are the characteristics of students choosing to apply to a large land-grant university? How can factors under an institution’s control be used to affect a student’s decision to apply? How can institutions more effectively use available data to inform the enrollment management pro-cess?
This study differs from previous studies of student choice in several ways. First, the study estimates a model of student application probability and examines the fac-tors affecting students’ propensities to apply to a large research university. Using the student as the unit of analysis, the decision to apply is analyzed using logistic regression techniques. Second, we use unit record data compiled from the ACT Student Profile Questionnaire (a survey completed by students when they take the ACT college entrance exam) and institutional data on students who applied for admission to the study institution for a recent fall quarter. The findings of this study provide information about modeling the college application decision process to guide recruitment and marketing efforts at similar institutions and at institutions in gen-eral. Third, we also examine the effects of several vari-ables not typically included in previous college choice studies. These variables include information about a stu-dent’s probable major, his or her interest in nationally recognized programs at the institution, special edu-cational needs of potential students, out-of-class accomplishments of students, and a student’s work plans while in college. Fourth, we examine application behavior related to a large land-grant institution. The report “Returning to Our Roots: The Student Experi-ence” by the Kellogg Commission (1997) on the Future of State and Land-Grant Universities suggests the need for a set of seven principles to guide academic reform in state and land-grant institutions. One of the principles addresses the question of access and opportunity (i.e. maintaining the widest possible access to the benefits of a college education), and notes that two-thirds of the bachelor’s degrees awarded in the United States are awarded by land-grant institutions. Empirical analysis of application (and enrollment) behavior will undoubtedly
help these institutions identify policy issues related to accessibility.
The paper is divided into four sections. First, a brief review of the literature is provided, while in the second section the model and data are described. In the third section we detail the empirical results and in the final section we discuss the results and their implications.
2. Literature review
Several authors (e.g. Hossler et al., 1989; Paulsen, 1990) have examined the literature on student college choice. There are two distinct approaches to studying student college-going behavior. Student demand models explain enrollments as a function of measures charac-terizing the population of potential enrollees and the characteristics of a relevant set of existing schools (Hoenack and Weiler, 1979). Student college choice models predict student behavior in choosing a particular school as a function of students’ individual character-istics and preferences about the school (Fuller et al., 1982).
Many institutions engage in various forms of market-ing and recruitment activities and seek ways to make themselves more attractive than other institutions in the eyes of prospective students. An understanding of stud-ent choice decision-making has become a primary part of effective strategic enrollment management. Effective strategic enrollment management depends on a better understanding of the timing and nature of students’ search processes and knowledge about which student and institutional characteristics are most important in the student college choice process. For example, Paulsen (1990) noted that student college choice studies can pro-vide guidelines which permit institutions to better under-stand the effects of student characteristics and insti-tutional factors and how they relate to student college decision-making. A better understanding of the effects that student attributes have on college choice processes can be used to identify groups of students possessing characteristics similar to those who are likely to apply, be admitted and enroll at a particular college. Paulsen also noted that understanding the effects of institutional characteristics on how students make college choices can provide helpful information to develop the most appro-priate marketing mix of attractive programs, delivered at appropriate times and places, and at acceptable prices. Better information about how students and institutions interact can be helpful in designing effective marketing strategies, especially in high yield markets (Paulsen, 1990). As a consequence, college choice studies have become an increasingly important part of strategic enrollment management activities.
stage is the formation of college aspiration, which includes the factors and processes influencing and shap-ing a student’s educational aspirations. The formation of college aspirations can take place over a long period of time, from early childhood through high school and beyond. The second stage of college choice involves identification, selection of and application to a select number of colleges. During this stage potential students acquire information from various sources about colleges they are considering. The identification and selection process ends when a student applies to one or more insti-tutions. The final phase is admission, college enrollment and attendance. In this phase of the college choice pro-cess students choose to enroll in one of the institutions included in their “choice set” (Weiler, 1994; Paulsen, 1990). The choice set refers to the set of institutions that a student plans to apply to. Information on choice prefer-ences is typically obtained from the survey administered when college entrance tests are taken.
Over the past two decades numerous studies have examined the college choice behavior of undergraduate students at each stage of the college choice process (see, Kohn et al., 1976; Weiler, 1994). Several studies have reviewed the literature on student college choice (see, Manski and Wise, 1983; Hossler, 1984; Hossler et al., 1989; Paulsen, 1990). Studies on college choice vary greatly with respect to the data sources, models and fin-dings. Typical data sources of college choice studies include various types of information collected while completing the ACT or SAT tests used for admissions purposes. These tests provide profiles and “preferences of high school graduates who took these exams” (Weiler, 1994). To date, most studies of college choice have focused on undergraduates, but several recent studies have also examined the college choice decisions of graduate students (Hearn, 1987; Kallio, 1995). Logit, probit, ordinary least squares regression models or discri-minant statistical analyses are generally used to model student college choice behavior.
Studies of college choice behavior suggest that the characteristics of students (e.g. race, gender, marital status, family income, parents’ educational attainment and occupational status, academic ability and achievement), institutional characteristics (e.g. tuition, financial aid, home location, reputation, selectivity, spe-cial programs and curriculum); and contextual factors (e.g. parental encouragement, teacher encouragement and peers’ plans) influence students’ application decisions. Generally, these studies have found that as students’ family income, educational aspirations, aca-demic ability, achievement and parental education increase, students are more likely to choose high cost, highly selective, distant, private and four-year insti-tutions (Hossler et al., 1989; Paulsen, 1990).
Another important finding is that the college selection process is interactional, depending on both the attributes
of the student and the characteristics of the institution. Some interaction effects between student and insti-tutional characteristics are especially important in order to develop effective enrollment management policies. For example, Weiler (1994) found that the match between a student’s preferences and an institution’s characteristics is the most critical factor influencing the decision to apply. Weiler also found that geographic location and congruence between SAT scores of prospec-tive applicants and current enrollees are of particular importance in predicting college choice. College choice also appears to be influenced by the cost of attendance, family income and academic ability. For example, Man-ski and Wise (1983) found that student responsiveness to college cost is negatively related to income and academic ability. However, this negative relationship is signifi-cantly greater for students from lower income families and for students with lower academic ability.
Despite an increase in the number of studies examin-ing student college choice, there is still a dearth of infor-mation about the factors that influence a student’s decision to attend a particular postsecondary educational institution (Weiler, 1994). Each institution has its own unique characteristics that influence students’ college choice processes. Also, there are few studies based on a large sample of students representing diverse groups and interests. Thus, the existing literature remains limited in its ability to provide a broad and comprehensive under-standing of the college choice decisions of students desiring to attend large, public institutions like the insti-tution examined in this study.
3. Methodology
3.1. Data sources
Student Profile Questionnaire, which is administered when the ACT test is taken. This questionnaire provides information about: (a) educational plans, interests and needs; (b) special educational needs, interests and goals; (c) college majors and occupational choices; (d) college extracurricular plans; (e) financial aid needs and work plans; (f) demographic and background information; (g) factors influencing college choice; (h) high school infor-mation; (i) high school extracurricular activities; (j) out-of-class accomplishments; and (k) an evaluation of the high school experience. Since this data set is much more comprehensive than data sets used in most other studies, we expected to obtain a better understanding of the fac-tors that affect the student application process. The second data set consisted of application and enrollment information for the study institution’s fall 1995 freshman class, but only the results pertaining to application are presented here. Institutional information was extracted from in-house data sources and then matched (using social security number) with the ACT data to create the sample used in this study.
Initially, we attempted to analyze the full data set (all ACT test takers in the United States intending to enroll in 1995). However, we faced two problems in using the entire data set. First, statistical analysis of over a million cases was difficult (even on an IBM mainframe) because of the substantial computer memory and time require-ments of the statistical model. Second, an analysis of a number of subsets of the entire data set convinced us that relatively little information was gained by analyzing the full data set. Since 85% of applicants to the study institution come from within the state or from bordering states, and these students represent the applicant pool for the study institution, we focused only on ACT test-takers from these states. The effective sample included 110 491 students or roughly 10% of all national ACT test takers. The definitions of the variables used in the study are summarized in Table 1. The dependent variable in this study is a discrete variable (i.e. 1 if the student applied to the study institution and 0 otherwise). Most of the independent variables included are binary variables because the data were obtained from survey questions of a categorical nature; continuous measures were used when possible (descriptions of the reference categories are presented in Table 2). Independent variables hypo-thesized to affect application probabilities include stu-dents’ personal and background characteristics (marital status, gender, ethnicity, number of siblings, family income, home location, home town size); educational characteristics (degree aspirations, high school rank, col-lege preparatory courses, high school size, ACT scores); preferences about the college (maximum yearly tuition preferred, intended place of residence, size and control of preferred institution); and college intentions (work plans, educational needs and interests, intention to apply for financial aid, and prospective major).
3.2. The empirical model
The conceptual model used in this study is based on human capital theory (see Weiler, 1994). The human capital model states that a student’s college choice decision is based on the expected net benefits (utility) of attending a particular institution. In such a model, the students who take the ACT assessment test are assumed to face a set of educational and non-schooling options. That is, the first choice is between college attendance and the pursuit of non-college alternatives such as labor force participation, the military or homemaking. If the student decides to pursue postsecondary education, the next decision involves making a discrete choice between applying or not applying to a particular institution from a set of preferred colleges and universities (the “choice set”). Individuals are assumed to be utility maximizers in that they choose to apply to a particular institution when the perceived net benefits (the difference between the benefits and costs of application to a specific institution) from applying to this institution are positive. In other words, student i will decide to apply to insti-tution k when the utility of applying to k is greater than the utility of not applying. This decision process can be summarized by the application decision model (see, Weiler, 1994).
3.3. General model
Because of the dichotomous nature of the dependent variable (applied/did not apply), and because the mean of the dependent variable is in the extreme lower end of the probability distribution (mean probability of appli-cation 50.11), we applied a logistic regression model to the sample. However, when estimating models with dichotomous dependent variables, if the mean of the dependent variable is near 0.5, ordinary least squares regression will provide results similar to those produced by a logistic regression (or probit) model (Dey and Astin, 1993; Weiler, 1994). The logistic regression model is specified as
log Pi 12Pi
5a 1 biXi1diYi1giZi1ei (1)
Table 1
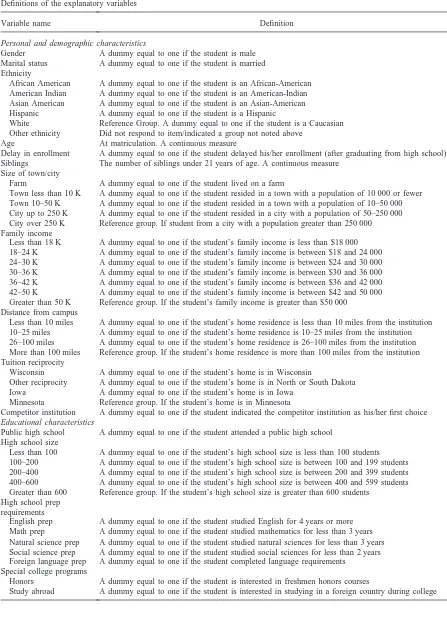
Definitions of the explanatory variables
Variable name Definition
Personal and demographic characteristics
Gender A dummy equal to one if the student is male Marital status A dummy equal to one if the student is married Ethnicity
African American A dummy equal to one if the student is an African-American American Indian A dummy equal to one if the student is an American-Indian Asian American A dummy equal to one if the student is an Asian-American Hispanic A dummy equal to one if the student is a Hispanic
White Reference Group. A dummy equal to one if the student is a Caucasian Other ethnicity Did not respond to item/indicated a group not noted above
Age At matriculation. A continuous measure
Delay in enrollment A dummy equal to one if the student delayed his/her enrollment (after graduating from high school) Siblings The number of siblings under 21 years of age. A continuous measure
Size of town/city
Farm A dummy equal to one if the student lived on a farm
Town less than 10 K A dummy equal to one if the student resided in a town with a population of 10 000 or fewer Town 10–50 K A dummy equal to one if the student resided in a town with a population of 10–50 000 City up to 250 K A dummy equal to one if the student resided in a city with a population of 50–250 000 City over 250 K Reference group. If student from a city with a population greater than 250 000 Family income
Less than 18 K A dummy equal to one if the student’s family income is less than $18 000 18–24 K A dummy equal to one if the student’s family income is between $18 and 24 000 24–30 K A dummy equal to one if the student’s family income is between $24 and 30 000 30–36 K A dummy equal to one if the student’s family income is between $30 and 36 000 36–42 K A dummy equal to one if the student’s family income is between $36 and 42 000 42–50 K A dummy equal to one if the student’s family income is between $42 and 50 000 Greater than 50 K Reference group. If the student’s family income is greater than $50 000
Distance from campus
Less than 10 miles A dummy equal to one if the student’s home residence is less than 10 miles from the institution 10–25 miles A dummy equal to one if the student’s home residence is 10–25 miles from the institution 26–100 miles A dummy equal to one if the student’s home residence is 26–100 miles from the institution More than 100 miles Reference group. If the student’s home residence is more than 100 miles from the institution Tuition reciprocity
Wisconsin A dummy equal to one if the student’s home is in Wisconsin
Other reciprocity A dummy equal to one if the student’s home is in North or South Dakota Iowa A dummy equal to one if the student’s home is in Iowa
Minnesota Reference group. If the student’s home is in Minnesota
Competitor institution A dummy equal to one if the student indicated the competitor institution as his/her first choice
Educational characteristics
Public high school A dummy equal to one if the student attended a public high school High school size
Less than 100 A dummy equal to one if the student’s high school size is less than 100 students 100–200 A dummy equal to one if the student’s high school size is between 100 and 199 students 200–400 A dummy equal to one if the student’s high school size is between 200 and 399 students 400–600 A dummy equal to one if the student’s high school size is between 400 and 599 students Greater than 600 Reference group. If the student’s high school size is greater than 600 students
High school prep requirements
English prep A dummy equal to one if the student studied English for 4 years or more Math prep A dummy equal to one if the student studied mathematics for less than 3 years Natural science prep A dummy equal to one if the student studied natural sciences for less than 3 years Social science prep A dummy equal to one if the student studied social sciences for less than 2 years Foreign language prep A dummy equal to one if the student completed language requirements
Special college programs
Honors A dummy equal to one if the student is interested in freshmen honors courses
Table 1 Continued
Variable name Definition
High school extracurricular activities
Varsity athletics A dummy equal to one if the student participated in varsity athletics Political campaign A dummy equal to one if the student participated in political campaigns Music A dummy equal to one if the student participated in musical activities Religion A dummy equal to one if the student participated in religious organizations Community service A dummy equal to one if the student participated in community services College prep A dummy equal to one if the student took any college preparatory courses
High ability A dummy equal to one if the student is ranked in the top quartile in his/her high school class ACT scores
Quartile 1 Reference group. If the student is ranked in the top quartile on ACT Composite test
Quartile 2 A dummy equal to one if the student is ranked in the second quartile on ACT Composite test Quartile 3 A dummy equal to one if the student is ranked in the third quartile on ACT Composite test Quartile 4 A dummy equal to one if the student is ranked in the fourth quartile on ACT Composite test
Preferences about the College
Tuition preference
Less than 2 K Reference group. If the student prefers tuition up to $2000
2–3 K A dummy equal to one if the student prefers tuition between $2 and 3000 4–5 K A dummy equal to one if the student prefers tuition between $4 and 5000 Greater than 5 K A dummy equal to one if the student prefers tuition greater than $5000 No tuition preference A dummy equal to one if the student indicates no preference about tuition Public college A dummy equal to one if the student prefers a public college or university Preferred residence
Residence hall A dummy equal to one if the student prefers to live in a residence hall
Off campus A dummy equal to one if the student prefers to live in a frat/sorority house, married housing or apartment
Parents’ house Reference group. If the student prefers to live at his/her parent’s house
Large college A dummy equal to one if the student prefers to attend a college with more than 20 000 students
College intentions
Work plans
Not work Reference group. If the student plans not to work
Up to 10 h A dummy equal to one if the student plans to work between 1 and 10 h per week 10–20 h A dummy equal to one if the student plans to work between 11 and 20 h per week 20–30 h A dummy equal to one if the student plans to work between 21 and 30 h per week More than 30 h A dummy equal to one if the student plans to work more than 30 h per week Apply for aid A dummy equal to one if the student intends to apply for financial aid Post baccalaureate degree A dummy equal to one if the student intends to get a post baccalaureate degree College major/occupational
choice
Chemical engineering A dummy equal to one if the student intends to study chemical engineering Economics A dummy equal to one if the student intends to study economics
Psychology A dummy equal to one if the student intends to study psychology Geography A dummy equal to one if the student intends to study geography
Mechanical engineering A dummy equal to one if the student intends to study mechanical engineering Math A dummy equal to one if the student intends to study mathematics
Chemistry A dummy equal to one if the student intends to study chemistry Ecology A dummy equal to one if the student intends to study ecology Geography A dummy equal to one if the student intends to study geology Political science A dummy equal to one if the student intends to study political science Electrical engineering A dummy equal to one if the student intends to study electrical engineering Pre law A dummy equal to one if the student intends to study pre-law
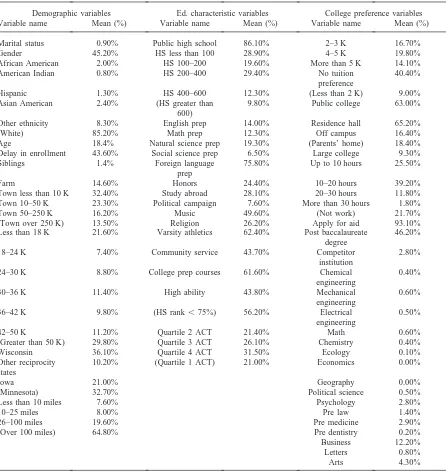
Table 2
Descriptive statistics
Demographic variables Ed. characteristic variables College preference variables
Variable name Mean (%) Variable name Mean (%) Variable name Mean (%)
Marital status 0.90% Public high school 86.10% 2–3 K 16.70%
Gender 45.20% HS less than 100 28.90% 4–5 K 19.80%
African American 2.00% HS 100–200 19.60% More than 5 K 14.10%
American Indian 0.80% HS 200–400 29.40% No tuition 40.40%
preference
Hispanic 1.30% HS 400–600 12.30% (Less than 2 K) 9.00%
Asian American 2.40% (HS greater than 9.80% Public college 63.00%
600)
Other ethnicity 8.30% English prep 14.00% Residence hall 65.20%
(White) 85.20% Math prep 12.30% Off campus 16.40%
Age 18.4% Natural science prep 19.30% (Parents’ home) 18.40%
Delay in enrollment 43.60% Social science prep 6.50% Large college 9.30%
Siblings 1.4% Foreign language 75.80% Up to 10 hours 25.50%
prep
Farm 14.60% Honors 24.40% 10–20 hours 39.20%
Town less than 10 K 32.40% Study abroad 28.10% 20–30 hours 11.80%
Town 10–50 K 23.30% Political campaign 7.60% More than 30 hours 1.80%
Town 50–250 K 16.20% Music 49.60% (Not work) 21.70%
(Town over 250 K) 13.50% Religion 26.20% Apply for aid 93.10%
Less than 18 K 21.60% Varsity athletics 62.40% Post baccalaureate 46.20% degree
18–24 K 7.40% Community service 43.70% Competitor 2.80%
institution
24–30 K 8.80% College prep courses 61.60% Chemical 0.40%
engineering
30–36 K 11.40% High ability 43.80% Mechanical 0.60%
engineering
36–42 K 9.80% (HS rank,75%) 56.20% Electrical 0.50%
engineering
42–50 K 11.20% Quartile 2 ACT 21.40% Math 0.60%
(Greater than 50 K) 29.80% Quartile 3 ACT 26.10% Chemistry 0.40%
Wisconsin 36.10% Quartile 4 ACT 31.50% Ecology 0.10%
Other reciprocity 10.20% (Quartile 1 ACT) 21.00% Economics 0.00%
states
Iowa 21.00% Geography 0.00%
(Minnesota) 32.70% Political science 0.50%
Less than 10 miles 7.60% Psychology 2.80%
10–25 miles 8.00% Pre law 1.40%
26–100 miles 19.60% Pre medicine 2.90%
(Over 100 miles) 64.80% Pre dentistry 0.20%
Business 12.20%
Letters 0.80%
Arts 4.30%
using a maximum-likelihood estimation (MLE) pro-cedure (PROC LOGIT, an option included in the SAS statistical package).
3.4. Limitations
As is true of all empirical studies, this study is limited in a number of ways. First, the choice process is difficult to study because it is complex, longitudinal, interactional
and cumulative (see, Hossler et al., 1989). Although the data being used are rich and help us better understand how students’ characteristics and institutional prefer-ences relate to the application decision, the model does not allow us to capture the longitudinal and cumulative influences on the decision making process.
that have been found to be significant in other studies (e.g. the education level of the students’ parents and vari-ables related to the influences of peers and family on their application decision). Other studies have found that parental education and the level of parental encourage-ment of students are positively associated with student college choice. As levels of parental education increase, students are likely to choose more selective institutions, ceteris paribus (Hossler et al., 1989). Hossler and col-leagues also noted that as the level of parental encour-agement increases, the likelihood that students will attend four year and more selective postsecondary edu-cation institutions rises. In a single-institution study, Welki and Navratil (1987) also found that parental pref-erence plays an important role in the decision to attend college. Unfortunately, no data were available for these variables so we were unable to examine their effects on students’ application decisions.
Third, there may be a statistical problem (selectivity bias) that limits the generalizability of the results. Stu-dents who prefer to study at institutions located on the East or West coasts of the United States are likely to take the SAT rather than the ACT test. However, stu-dents taking only the SAT are not included in our sam-ple. Since students taking the ACT are more likely to apply to colleges and universities in the Midwest, stu-dents likely to choose institutions in the Midwest are over-represented in the sample.
Finally, by using dichotomous independent variables to represent most of the ACT Student Profile information we may be losing some statistical precision. Using “dummy” or categorical independent variables does, however, make it easier to interpret the results of vari-ables hypothesized to affect application probabilities. Even though it is common practice to specify the explanatory variables in this fashion, some valuable information may be lost. At a later date we hope to esti-mate the model using interval measures to examine how sensitive the results are to our specification of the inde-pendent variables.
4. Results
Table 2 includes descriptive statistics of the sample. Tables 1A and 2A in Appendix A present the estimates produced by the restricted models and Table 3 (below) presents the results of the unrestricted model. The first restricted model estimated (Model 1) included personal and demographic factors only. In Model 2, the second restricted model estimated, we added students’ edu-cational characteristics that are hypothesized to affect the probability of applying to the study institution. The unre-stricted model (Model 3) includes all variables used in Model 2 plus the college preferences and intentions of students in the sample. Unless otherwise noted, the
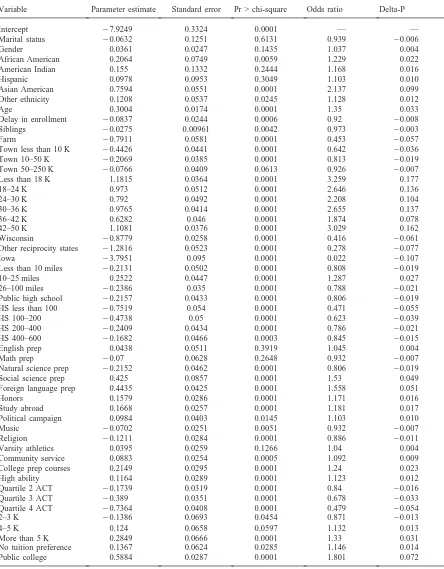
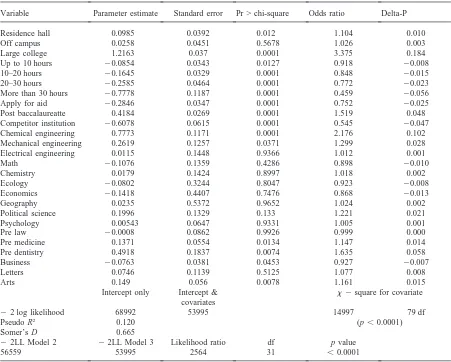
results discussed below will be based on the estimates obtained from Model 3 (preferred based on a Likelihood Ratio test of Model 2 versus Model 3; see Table 3). Each table of results includes individual parameter estimates, asymptotic standard errors, and the significance level, odds ratios (change in the odds of applying) and delta-P statistics (change in the probability of applying) of the estimates (see Peterson, 1984, for details about the delta-P statistic). Any discussion of the statistical significance of individual variables is conditional on controlling for other factors included in the model, and any reference to statistical significance is at the p, 0.01 level. This stringent level of significance was chosen because of the large sample size.
4.1. Personal and demographic characteristics
Less than 1% of the potential applicant population were married and the results indicate that married stu-dents have application propensities no different than unmarried students. With regard to gender, the Weiler (1994) study of applications to a private university found that women were significantly more likely to apply than men, but our results indicate no gender differences. We used a continuous measure to examine the effects of age on student application behavior and found that age and probability of application are positively related. Because of the potential financial burden on the family, we exam-ined how the number of siblings under 21 years of age affects application probabilities. The average number of siblings was 1.4 and this continuous measure was found to be negatively related to application. We also found that students who delayed their enrollment (after gradu-ating from high school) were slightly less likely to apply to the study institution than students who applied immediately after high school graduation.
Table 3
Unrestricted model (Model 3)
Variable Parameter estimate Standard error Pr > chi-square Odds ratio Delta-P
Intercept 27.9249 0.3324 0.0001 — —
Marital status 20.0632 0.1251 0.6131 0.939 20.006
Gender 0.0361 0.0247 0.1435 1.037 0.004
African American 0.2064 0.0749 0.0059 1.229 0.022
American Indian 0.155 0.1332 0.2444 1.168 0.016
Hispanic 0.0978 0.0953 0.3049 1.103 0.010
Asian American 0.7594 0.0551 0.0001 2.137 0.099
Other ethnicity 0.1208 0.0537 0.0245 1.128 0.012
Age 0.3004 0.0174 0.0001 1.35 0.033
Delay in enrollment 20.0837 0.0244 0.0006 0.92 20.008
Siblings 20.0275 0.00961 0.0042 0.973 20.003
Farm 20.7911 0.0581 0.0001 0.453 20.057
Town less than 10 K 20.4426 0.0441 0.0001 0.642 20.036
Town 10–50 K 20.2069 0.0385 0.0001 0.813 20.019
Town 50–250 K 20.0766 0.0409 0.0613 0.926 20.007
Less than 18 K 1.1815 0.0364 0.0001 3.259 0.177
18–24 K 0.973 0.0512 0.0001 2.646 0.136
24–30 K 0.792 0.0492 0.0001 2.208 0.104
30–36 K 0.9765 0.0414 0.0001 2.655 0.137
36–42 K 0.6282 0.046 0.0001 1.874 0.078
42–50 K 1.1081 0.0376 0.0001 3.029 0.162
Wisconsin 20.8779 0.0258 0.0001 0.416 20.061
Other reciprocity states 21.2816 0.0523 0.0001 0.278 20.077
Iowa 23.7951 0.095 0.0001 0.022 20.107
Less than 10 miles 20.2131 0.0502 0.0001 0.808 20.019
10–25 miles 0.2522 0.0447 0.0001 1.287 0.027
26–100 miles 20.2386 0.035 0.0001 0.788 20.021
Public high school 20.2157 0.0433 0.0001 0.806 20.019
HS less than 100 20.7519 0.054 0.0001 0.471 20.055
HS 100–200 20.4738 0.05 0.0001 0.623 20.039
HS 200–400 20.2409 0.0434 0.0001 0.786 20.021
HS 400–600 20.1682 0.0466 0.0003 0.845 20.015
English prep 0.0438 0.0511 0.3919 1.045 0.004
Math prep 20.07 0.0628 0.2648 0.932 20.007
Natural science prep 20.2152 0.0462 0.0001 0.806 20.019
Social science prep 0.425 0.0857 0.0001 1.53 0.049
Foreign language prep 0.4435 0.0425 0.0001 1.558 0.051
Honors 0.1579 0.0286 0.0001 1.171 0.016
Study abroad 0.1668 0.0257 0.0001 1.181 0.017
Political campaign 0.0984 0.0403 0.0145 1.103 0.010
Music 20.0702 0.0251 0.0051 0.932 20.007
Religion 20.1211 0.0284 0.0001 0.886 20.011
Varsity athletics 0.0395 0.0259 0.1266 1.04 0.004
Community service 0.0883 0.0254 0.0005 1.092 0.009
College prep courses 0.2149 0.0295 0.0001 1.24 0.023
High ability 0.1164 0.0289 0.0001 1.123 0.012
Quartile 2 ACT 20.1739 0.0319 0.0001 0.84 20.016
Quartile 3 ACT 20.389 0.0351 0.0001 0.678 20.033
Quartile 4 ACT 20.7364 0.0408 0.0001 0.479 20.054
2–3 K 20.1386 0.0693 0.0454 0.871 20.013
4–5 K 0.124 0.0658 0.0597 1.132 0.013
More than 5 K 0.2849 0.0666 0.0001 1.33 0.031
No tuition preference 0.1367 0.0624 0.0285 1.146 0.014
Table 3 Continued
Variable Parameter estimate Standard error Pr > chi-square Odds ratio Delta-P
Residence hall 0.0985 0.0392 0.012 1.104 0.010
Off campus 0.0258 0.0451 0.5678 1.026 0.003
Large college 1.2163 0.037 0.0001 3.375 0.184
Up to 10 hours 20.0854 0.0343 0.0127 0.918 20.008
10–20 hours 20.1645 0.0329 0.0001 0.848 20.015
20–30 hours 20.2585 0.0464 0.0001 0.772 20.023
More than 30 hours 20.7778 0.1187 0.0001 0.459 20.056
Apply for aid 20.2846 0.0347 0.0001 0.752 20.025
Post baccalaureatte 0.4184 0.0269 0.0001 1.519 0.048
Competitor institution 20.6078 0.0615 0.0001 0.545 20.047
Chemical engineering 0.7773 0.1171 0.0001 2.176 0.102
Mechanical engineering 0.2619 0.1257 0.0371 1.299 0.028
Electrical engineering 0.0115 0.1448 0.9366 1.012 0.001
Math 20.1076 0.1359 0.4286 0.898 20.010
Chemistry 0.0179 0.1424 0.8997 1.018 0.002
Ecology 20.0802 0.3244 0.8047 0.923 20.008
Economics 20.1418 0.4407 0.7476 0.868 20.013
Geography 0.0235 0.5372 0.9652 1.024 0.002
Political science 0.1996 0.1329 0.133 1.221 0.021
Psychology 0.00543 0.0647 0.9331 1.005 0.001
Pre law 20.0008 0.0862 0.9926 0.999 0.000
Pre medicine 0.1371 0.0554 0.0134 1.147 0.014
Pre dentistry 0.4918 0.1837 0.0074 1.635 0.058
Business 20.0763 0.0381 0.0453 0.927 20.007
Letters 0.0746 0.1139 0.5125 1.077 0.008
Arts 0.149 0.056 0.0078 1.161 0.015
Intercept only Intercept & x 2square for covariate covariates
22 log likelihood 68992 53995 14997 79 df
Pseudo R2 0.120 (p,0.0001)
Somer’s D 0.665
22LL Model 2 22LL Model 3 Likelihood ratio df p value
56559 53995 2564 31 ,0.0001
differences in application behavior. We found that Asian American students are more than twice as likely to apply as white students but other ethnic groups did not apply at significantly different rates than white students.
Previous research on student college choice has found that family income affects student college choice. Stu-dents from high socioeconomic families are more likely to apply to and attend out-of-state and selective postsec-ondary institutions (see, Hossler et al., 1989; Weiler, 1994). Weiler (1994), for example, found that students who are from high income families are more likely to apply to a private, selective institution, and the prob-ability of application increases as the level of family income rises. We included seven family income categor-ies to estimate the effects of a student’s financial situ-ation on the college applicsitu-ation decision. We found that students from families with incomes less than $18 000 and students with family incomes in the $42–50 000 ranges were more than three times as likely to apply than
students from families with incomes above $50 000 (the reference category). The results associated with the $42– 50 000 group are especially interesting as they indicate a divergence from the general pattern of declining odds ratios with increases in income.
reduc-ing the probability that any sreduc-ingle institution will be chosen. Fourth, many students feel less comfortable in unfamiliar, distant places making them more likely to choose a school near their home. Fifth, students are likely to go to colleges where their friends or parents attend(ed), since they will be familiar with those insti-tutions. It should be noted, however, that there are stud-ies indicating that distance from home has no effect on student application decisions. For example, Chapman (1979) found that distance was not related to the decision to apply to a private university.
After controlling for possible confounding factors, our results indicate that students who live within 10 miles of the study institution are less likely to apply than students who live more than 100 miles away from the university (the reference group). Students who live between 10 and 25 miles from the institution, however, are about 29%
more likely to apply than students from the reference
group. However, when only demographic factors were included in the model (Model 1) these students were sig-nificantly less likely to apply. This sign reversal indicates the sensitivity of this variable to inclusion of factors related to a student’s educational background. Students who originally resided 26–100 miles from the institution are also less likely to apply than students from the refer-ence group.
How does the size of the community a potential appli-cant comes from affect their chances of applying? This question was addressed by including dummy variables that categorized hometown size (see Table 1 for definitions). We found a positive relationship between application probability and home town size. For instance, students from farms are about half as likely to apply to the study institution as students from cities with more than 250 000 people (the reference group). Students from cities with between 50 and 250 000 people are not stat-istically different than the reference group. Generally, students from hometowns of less than 10 000 inhabitants have application probabilities of about 64% of students from the reference group, while students from towns with 10–50 000 persons have probabilities of about 80% of the reference group.
Since the state of Minnesota has tuition reciprocity agreements with bordering states, we decided to test whether these policies help to draw applicants to the institution. We included a variable indicating whether a student is from Wisconsin since these students pay the tuition rate of their home state’s large research university at the study institution. We also created an indicator vari-able for students from North or South Dakota. Minneso-ta’s agreement with these two states is not as generous as the Wisconsin agreement but students from the Dako-ta’s still pay less than nonresident tuition rates. An indi-cator variable was also included indicating whether a student is from Iowa. There is a very limited agreement between small institutions in Northern Iowa and
South-ern Minnesota but most Iowa students attending the study institution pay nonresident tuition. The reference group includes Minnesota residents.
We found that Wisconsin residents, who are covered by the most generous reciprocity agreement, are more likely to apply to the study institution than residents of the other states bordering Minnesota. We also found that North and South Dakota residents apply at greater rates than students from Iowa. Since the model controls for many of the factors that could confound these results, we believe Minnesota’s tuition reciprocity agreements draw applicants to the study institution.
4.2. Effects of educational characteristics
Existing research suggests that student ability affects the college choice process. High ability students are more likely to select out-of-state and more selective institutions (Hossler et al., 1989). We used two measures of ability (i.e. high school rank percentile and ACT Com-posite score) in the model to test the effect of student ability on application decision making. Students who ranked in the top quartile of their high school class are more likely to apply to the study institution than for their lower high school rank counterparts (the reference group). As indicated by the odds ratios and delta-P stat-istics, students from the top quartile of their high school class are over 12% more likely to apply than students from the reference group. Because we were unable to obtain actual ACT test scores for all students, we used categories that approximate quartiles (the reference group is the top quartile). The odds ratios for the second, third and fourth quartiles are all less than one and decline by quartile indicating that application probabilities and ACT composite scores are positively related. For instance, students who score in the fourth quartile on the ACT test are about half as likely to apply as students scoring in the top quartile.
A single dummy variable was included to test whether taking college preparatory course work in high school had a significant effect on application probabilities. As expected, the results indicate that students who took col-lege preparatory courses in high school are more likely (1.24 times) to apply to the study institution than stu-dents who did not take college preparatory courses.
The effect of student involvement in a number of high school extracurricular activities was also tested. Students who indicated involvement in music or religion were less likely to apply than the general population and students who participated in varsity athletics in high school had application probabilities no different from the general population.
smaller graduating classes. For instance, students who graduated in classes of less than 100 are roughly half as likely to apply than students who graduated from classes with more than 600 students. We also tested whether high school control (public versus private) affected stu-dents’ application decisions and found that students graduating from public high schools are less likely to apply than students who attended private high schools. Further examination of this result is certainly warranted, but it may be that the reputation of the institution or the broad array of disciplines offered differentially affects the choices of students who attended private high schools.
A few years ago the institution implemented high school preparation requirements for enrollment. All applicants are expected to have completed 4 years of English, 3 years of mathematics, 3 years of science, 2 years of a (single) second language, and 2 years of social studies. The ACT questionnaire provides infor-mation on the number of years students have (or will have) studied various subjects by the time they graduate. We found that students who did not meet the English and mathematics requirements had application prob-abilities no different than students who complied, whereas students who did not fulfill the natural science requirement were less likely to apply than students who had. Students who had 2 years of a foreign language were 56% more likely to apply than students who had not fulfilled this requirement. Inexplicably, students who did not meet the social science requirement were more likely to apply than students who met the requirement.
4.3. College preference effects
Institutional attributes may have an impact on the student college choice process. In a review of the litera-ture on the effects of institutional attributes on college choice, Hossler et al. (1989) identified the following attributes as having an impact on students’ decisions to apply to or attend a college or university: tuition, finan-cial aid availability, spefinan-cial academic programs, aca-demic reputation (or institutional quality or institutional selectivity), size of institution, institutional control (public versus private) and social atmosphere.
The institution under study is a large land-grant insti-tution and student preferences regarding instiinsti-tutional control (public versus private) may have an effect on their college choice calculus. Our findings indicate that students who prefer to attend a public college or univer-sity are 1.8 times more likely to apply to the institution than students who prefer a private institution. Also, stu-dents who prefer to attend a college or university with more than 20 000 students were found to be about 3.4 times more likely to apply to the study institution than students who indicated an intention to enroll in a smaller institution.
We also found that students who intend to continue their education beyond the baccalaureate level are about 1.5 times more likely to apply than students who did not indicate a desire to pursue an advanced degree. Also, where a student intends to reside during college (residence hall, off-campus, at their parents’ house) did not significantly affect application probabilities after controlling for other (possibly) confounding factors. We also tested whether students expressing a desire to take honors courses in college or who intend to study abroad had application probabilities different than students not desiring to pursue these options. Students who indicated a desire to enroll in honors courses and students who indicated a desire to study abroad were 17–18% more likely to apply to the study institution than students who did not indicate an interest in these programs.
An institution in a neighboring state is viewed as a popular alternative for students considering the study institution. Thus, we developed an indicator variable that allowed us to test whether students who had the other institution first in their choice set were more or less likely to apply to the study institution. We found that individuals who had the other institution as their first choice, ceteribus paribus, were about half as likely to apply to the study institution as students who did not have the competitor as their first choice.
Although there is sufficient evidence in the literature that students consider costs when selecting a college, we were interested in examining whether the preferred yearly tuition levels have an impact on the probability that students apply to the study institution. We included four preferred maximum yearly tuition variables and found that only students who prefer to pay more than $5000 in tuition are more likely to apply than students who prefer tuition rates below $2000. Specifically, stu-dents who preferred tuition levels above $5000 per year were about 1.3 times more likely to apply as students preferring tuition rates less than $2000 per year.
4.4. Effects of college intentions
impact of the reputational rank of a program on students’ college application decision making is important given the growing use of such rankings by students. There is a debate in higher education regarding the effect of repu-tation of a program on a student’s choice of a college or program. To test the effect of the study institution’s ranked programs, we entered dummy variables for a var-iety of programs. These programs are highly ranked by the National Research Council (1982 and 1995 reports) doctoral programs ratings. Although the literature on col-lege choice is replete with findings about student charac-teristics and institutional factors that affect student choice, no studies could be located that indicated whether or not the presence or absence of disciplinary programs of high reputation or quality affect undergrad-uates’ selection of particular institutions. Analyses of the recent rankings of graduate programs by the NRC sug-gest that the number of highly ranked programs has a “halo effect” relative to the institution’s overall ranking (Fairweather, 1988; Toutkoushian et al., in press). We realize that the NRC studies evaluate doctoral programs, however, students making college application decisions are probably less likely to distinguish between the repu-tation of a doctoral program and that of an undergrad-uate program.
Our results indicate that students who intend to study Chemical Engineering, the top ranked program in the country, are about 2.2 times more likely to apply to the study institution than the general population. Given that the study institution has a law, medical and dental school, we also tested the application effects of these programs. The results indicate that students interested in dentistry were more likely to apply than other students but no statistically significant effects were found for the law or medical programs. We also found that students interested in studying the arts (which accounts for over 4% of the sample) were 16% more likely to apply than the general population.
5. Discussion and conclusion
A logistic regression model was estimated to deter-mine the factors that influence a students’ application to a large land-grant institution. This model included sev-eral important variables that should be considered by institutional decision-makers. First, students’ test scores and high school rank percentile, age, proximity to the institution, whether the student postponed their initial college enrollment, congruence between the student’s preferred institution type and size and that of the study institution, and family income are all important variables in determining students’ application decisions. Second, we found that a highly reputed program has a positive effect on students’ college application decisions. Honors programs and study abroad options also positively
influ-ence applications to this institution. Third, we did not find any statistically significant effects of marital status or gender, but did find that African and Asian American students are more likely to apply than white students. The finding is welcome news given the institution’s com-mitment to racial and ethnic diversity.
This analysis has several important implications. First, the estimated effects of the personal and demographic, high school and college preference characteristics are generally consistent with the findings of previous college choice studies. However, there are some institution-spe-cific results of interest. We found that students from Iowa, a state without a general tuition reciprocity agree-ment with Minnesota are much less likely to apply to the study institution than students from states with tuition reciprocity agreements. Our finding that the high school preparation requirements are (generally) not a deterrent to application. This is welcome news given a concern among some quarters that these requirements would adversely impact access to this institution. We also found that there are specific academic programs that seem to draw applications and that students who have the main competition of the study institution as their first choice school are highly unlikely to apply. The ability to deter-mine and more closely exadeter-mine general and institution-specific relationships should better enable us to inform recruitment policies at the study institution.
Using data on a substantial proportion of the potential pool of applicants to an institution is an improvement over studies that use only students who send their test scores to the institution. Using the latter limits one’s ability to adequately explain the factors that influence college choice decisions since students who did not report their scores are excluded from the sample (see, Weiler, 1994).
If they are not already doing so, institutions should begin to use the information collected by ACT and SAT more effectively. In an era in which higher education institutions are increasingly accountable for costs and quality, it is important for institutions to devote resources to those activities that are most likely to have the desired impact. The ACT Student Profile Questionnaire is a rich source of information, which can be used to craft insti-tutional policies and practices in admissions and reten-tion. Targeting recruitment strategies to increase the probability of students with certain characteristics apply-ing to a particular institution is a very practical outcome of this research strategy. Extending this strategy to the enrollment decision and beyond to students’ retention and graduation behavior could enable institutions to think more wholistically about the recruitment-through-graduation process.
explore how nested choice models could be used to jointly model applicant and enrollment behavior (see Greene, 1993). Also, since the college choice process takes place over time, researchers should look for ways to apply longitudinal models like event history methods to the study of college choice.
Large universities must balance their multiple mis-sion-related activities, but often do not have empirical research to demonstrate how their graduate and pro-fessional programs affect their undergraduate programs,
Appendix A
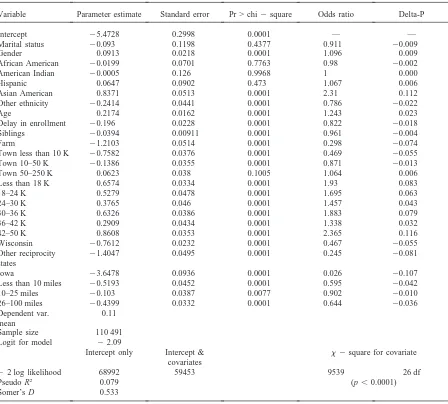
Tables 1A and 2A given below show data from the demographics model (Model 1) and the demographics and educational characteristics model (Model 2) as mentioned earlier in this paper.
Table 1A
Demographics model (Model 1)
Variable Parameter estimate Standard error Pr > chi2square Odds ratio Delta-P
Intercept 25.4728 0.2998 0.0001 — —
Marital status 20.093 0.1198 0.4377 0.911 20.009
Gender 0.0913 0.0218 0.0001 1.096 0.009
African American 20.0199 0.0701 0.7763 0.98 20.002
American Indian 20.0005 0.126 0.9968 1 0.000
Hispanic 0.0647 0.0902 0.473 1.067 0.006
Asian American 0.8371 0.0513 0.0001 2.31 0.112
Other ethnicity 20.2414 0.0441 0.0001 0.786 20.022
Age 0.2174 0.0162 0.0001 1.243 0.023
Delay in enrollment 20.196 0.0228 0.0001 0.822 20.018
Siblings 20.0394 0.00911 0.0001 0.961 20.004
Farm 21.2103 0.0514 0.0001 0.298 20.074
Town less than 10 K 20.7582 0.0376 0.0001 0.469 20.055
Town 10–50 K 20.1386 0.0355 0.0001 0.871 20.013
Town 50–250 K 0.0623 0.038 0.1005 1.064 0.006
Less than 18 K 0.6574 0.0334 0.0001 1.93 0.083
18–24 K 0.5279 0.0478 0.0001 1.695 0.063
24–30 K 0.3765 0.046 0.0001 1.457 0.043
30–36 K 0.6326 0.0386 0.0001 1.883 0.079
36–42 K 0.2909 0.0434 0.0001 1.338 0.032
42–50 K 0.8608 0.0353 0.0001 2.365 0.116
Wisconsin 20.7612 0.0232 0.0001 0.467 20.055
Other reciprocity 21.4047 0.0495 0.0001 0.245 20.081
states
Iowa 23.6478 0.0936 0.0001 0.026 20.107
Less than 10 miles 20.5193 0.0452 0.0001 0.595 20.042
10–25 miles 20.103 0.0387 0.0077 0.902 20.010
26–100 miles 20.4399 0.0332 0.0001 0.644 20.036
Dependent var. 0.11
mean
Sample size 110 491
Logit for model 22.09
Intercept only Intercept & x 2square for covariate
covariates
22 log likelihood 68992 59453 9539 26 df
Pseudo R2 0.079 (p,0.0001)
Somer’s D 0.533
and how their research activities affect their educational mission, and vice versa. Findings in this study suggest that an institution’s highly ranked doctoral programs may positively influence the application process of pro-spective undergraduates.
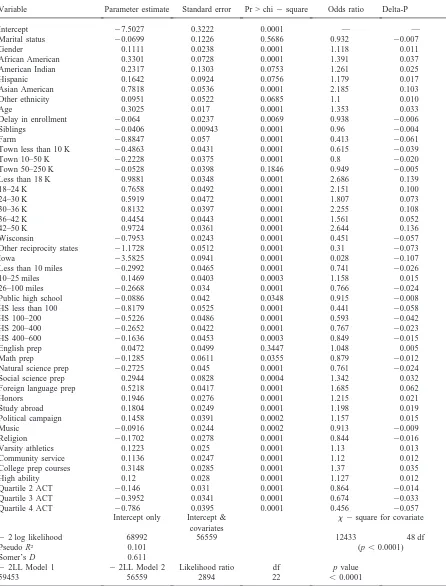
Table 2A
Demographics and educational characteristics model (Model 2)
Variable Parameter estimate Standard error Pr > chi2square Odds ratio Delta-P
Intercept 27.5027 0.3222 0.0001 — —
Marital status 20.0699 0.1226 0.5686 0.932 20.007
Gender 0.1111 0.0238 0.0001 1.118 0.011
African American 0.3301 0.0728 0.0001 1.391 0.037
American Indian 0.2317 0.1303 0.0753 1.261 0.025
Hispanic 0.1642 0.0924 0.0756 1.179 0.017
Asian American 0.7818 0.0536 0.0001 2.185 0.103
Other ethnicity 0.0951 0.0522 0.0685 1.1 0.010
Age 0.3025 0.017 0.0001 1.353 0.033
Delay in enrollment 20.064 0.0237 0.0069 0.938 20.006
Siblings 20.0406 0.00943 0.0001 0.96 20.004
Farm 20.8847 0.057 0.0001 0.413 20.061
Town less than 10 K 20.4863 0.0431 0.0001 0.615 20.039
Town 10–50 K 20.2228 0.0375 0.0001 0.8 20.020
Town 50–250 K 20.0528 0.0398 0.1846 0.949 20.005
Less than 18 K 0.9881 0.0348 0.0001 2.686 0.139
18–24 K 0.7658 0.0492 0.0001 2.151 0.100
24–30 K 0.5919 0.0472 0.0001 1.807 0.073
30–36 K 0.8132 0.0397 0.0001 2.255 0.108
36–42 K 0.4454 0.0443 0.0001 1.561 0.052
42–50 K 0.9724 0.0361 0.0001 2.644 0.136
Wisconsin 20.7953 0.0243 0.0001 0.451 20.057
Other reciprocity states 21.1728 0.0512 0.0001 0.31 20.073
Iowa 23.5825 0.0941 0.0001 0.028 20.107
Less than 10 miles 20.2992 0.0465 0.0001 0.741 20.026
10–25 miles 0.1469 0.0403 0.0003 1.158 0.015
26–100 miles 20.2668 0.034 0.0001 0.766 20.024
Public high school 20.0886 0.042 0.0348 0.915 20.008
HS less than 100 20.8179 0.0525 0.0001 0.441 20.058
HS 100–200 20.5226 0.0486 0.0001 0.593 20.042
HS 200–400 20.2652 0.0422 0.0001 0.767 20.023
HS 400–600 20.1636 0.0453 0.0003 0.849 20.015
English prep 0.0472 0.0499 0.3447 1.048 0.005
Math prep 20.1285 0.0611 0.0355 0.879 20.012
Natural science prep 20.2725 0.045 0.0001 0.761 20.024
Social science prep 0.2944 0.0828 0.0004 1.342 0.032
Foreign language prep 0.5218 0.0417 0.0001 1.685 0.062
Honors 0.1946 0.0276 0.0001 1.215 0.021
Study abroad 0.1804 0.0249 0.0001 1.198 0.019
Political campaign 0.1458 0.0391 0.0002 1.157 0.015
Music 20.0916 0.0244 0.0002 0.913 20.009
Religion 20.1702 0.0278 0.0001 0.844 20.016
Varsity athletics 0.1223 0.025 0.0001 1.13 0.013
Community service 0.1136 0.0247 0.0001 1.12 0.012
College prep courses 0.3148 0.0285 0.0001 1.37 0.035
High ability 0.12 0.028 0.0001 1.127 0.012
Quartile 2 ACT 20.146 0.031 0.0001 0.864 20.014
Quartile 3 ACT 20.3952 0.0341 0.0001 0.674 20.033
Quartile 4 ACT 20.786 0.0395 0.0001 0.456 20.057
Intercept only Intercept & x 2square for covariate covariates
22 log likelihood 68992 56559 12433 48 df
Pseudo R2 0.101 (p,0.0001)
Somer’s D 0.611
22LL Model 1 22LL Model 2 Likelihood ratio df p value
programs. In particular, our results indicate that the insti-tution is more likely to attract high ability students and students from within under-represented populations, both of which are elements of the institution’s strategic plan-ning initiative. In a period in which some institutional functions (like admissions) are evaluated based on spe-cific numeric targets, broad-based research strategies can provide evidence of the linkages between prospective student activities and the furtherance of an institution’s strategic planning goals. Our observation is that there is a paucity of research that serves to link institutional poli-cies and students’ behavior in the college application and enrollment arenas. We hope this study will serve as a catalyst for similar analyses to be conducted at other uni-versities and on national data sets.
Acknowledgements
The authors would like to thank the generous assist-ance of ACT for supplying some of the data used in this study.
References
Chapman, R.C., 1979. Pricing policy and the college choice process. Research in Higher Education 10, 37–57. Dey, E.L., Astin, A.W., 1993. Statistical alternatives for
study-ing college student retention: a comparative analysis of logit, probit, and linear regression. Research in Higher Edu-cation 34 (5), 569–581.
Fairweather, J.S., 1988. Reputational quality of academic pro-grams: the institutional halo. Research in Higher Education 28 (4), 345–354.
Fuller, W.C., Manski, C.F., Wise, D.A., 1982. New evidence on the economic determinants of postsecondary school choice. Journal of Human Resources 17 (Fall), 477–498.
Greene, W. (1993) Econometric Analysis. New York: Macmil-lan Publishing Company.
Hearn, J.C., 1987. Impacts of undergraduate experiences on
aspirations and plans for graduate and professional edu-cation. Research in Higher Education 27 (2), 119–141. Hoenack, S.A., Weiler, W.C., 1979. The demand for higher
education and institutional enrollment forecasting. Econ-omic Inquiry 17, 89–113.
Hossler, D. (1984) Enrollment Management: An Integrated
Approach. New York: College Entrance Examination
Board.
Hossler, D., Braxton, J. and Coppersmith, G. (1989) Under-standing student college choice. In Higher Education:
Handbook of Theory and Research (Edited by J. C. Smart),
Vol. 5, pp. 231–288. New York: Agathon Press.
Kallio, R.E., 1995. Factors influencing the college choice decisions of graduate students. Research in Higher Edu-cation 36 (1), 109–124.
Kellogg Commission on the Future of State and Land-Grant Universities (1997) Returning to our roots: the student experience: an open letter to the Presidents and Chancellors of state universities and land-grant colleges.
Kohn, M.G., Manski, C.F., Mundel, D.S., 1976. An empirical investigation of factors which influence college-going behavior. Annals of Economics and Social Measurement 5 (4), 391–419.
Leppel, K., 1993. Logit estimation of a gravity model of the college enrollment decision. Research in Higher Education 34 (3), 387–398.
Manski, C. F. and Wise, A. D. (1983) College Choice in
Amer-ica. Cambridge, MA: Harvard University Press.
Paulsen, M. B. (1990) College Choice: Understanding Student Enrollment Behavior. ASHE-ERIC Higher Education Report 90-6. Washington, DC: The George Washington University.
Peterson, T., 1984. A comment on presenting the results of logit and probit models. American Sociological Review 50 (1), 130–131.
Toutkoushian, R. K., Dundar, H. and Becker, W. E. (in press) The National Research Council graduate program ratings: what are they measuring?
Weiler, W.C., 1994. Transition from consideration of college to the decision to apply. Research in Higher Education 35 (6), 631–646.