OSCILLATION OF THE MEASUREMENT ACCURACY OF
THE CENTER LOCATION OF AN ELLIPSE ON A DIGITAL IMAGE
R. Matsuoka a, b a
Research and Development Division, Kokusai Kogyo Co., Ltd., 2-24-1 Harumi-cho, Fuchu, Tokyo 183-0057, JAPAN [email protected]
b
Tokai University Research & Information Center, 2-28-4 Tomigaya, Shibuya-ku, Tokyo 151-0063, JAPAN [email protected]
Commission III, WG III/1
KEY WORDS: Experiment, Accuracy, Measurement, Digital, Image, Target
ABSTRACT:
Circular targets are often utilized in photogrammetry and a circle on a plane is projected as an ellipse onto an oblique image. This paper reports an experiment conducted to investigate whether the measurement accuracy of the center location of an ellipse on a digital image oscillates as its dimension increases. The experiment was executed by the Monte Carlo simulation using 1024 synthesized images of which the centers were randomly distributed in one pixel for each ellipse. We investigated four typical measurement methods: intensity-weighted centroid method, non-iterative ellipse fitting, iterative ellipse fitting with the star operator, and least-squares matching. Three flattenings 0.00, 0.25, 0.50, and three rotation angles 0.0°, 22.5°, 45.0° were investigated in the experiment. The experiment results clearly show that the measurement accuracy by all the investigated methods would oscillate as the dimension of an ellipse increases. The measurement accuracy by the intensity-weighted centroid method and the non-iterative ellipse fitting would oscillate smoothly, while that by the least-squares matching would oscillate considerably roughly. It would be impossible to determine the cycle of the oscillation except the measurement accuracy by the intensity-weighted centroid method and the non-iterative ellipse fitting when the rotation angle of an ellipse is 0.0° and 45.0°. The experiment results indicate that the flattening and the rotation angle of an ellipse would affect the cycle of the oscillation as well.
1. INTRODUCTION
Circular targets on a plane are often utilized in photogrammetry, particularly in close range photogrammetry. Since a circle is radially symmetrical, circular targets are well suited for photogrammetric use such as camera calibration and 3D measurement. It is said that determination of the center of a circular target by digital image processing techniques is rotation-invariant and scale-invariant over a wide range of image resolutions. The center of a circular target can be estimated by centroid methods, by analytical determination of the circle, or by matching with a reference pattern (Luhmann et al., 2006).
We reported an experiment conducted in order to evaluate measurement methods of the center location of a circle by using synthesized images of various sizes of circles (Matsuoka et al., 2009b). We investigated two centroid methods: intensity-weighted centroid method, and unintensity-weighted centroid method using a binary image created by thresholding, and least-squares matching in the experiment. We made the experiment by the Monte Carlo simulation using 1024 synthesized images of which the centers were randomly distributed in one pixel for each circle. The radius of a circle was examined at 0.1 pixel intervals from 2 to 40 pixels. The variances of measurement errors by both centroid methods in the experiment appeared to oscillate in an approximately 0.5 pixel cycle in radius, even though the formula to estimate the center of a circle by each centroid method does not seem to produce such cyclic measurement errors.
In photogrammetry some papers on the precision and accuracy of measurement methods of the center location of a circle have been presented (Trinder, 1989, Trinder et al., 1995, Shortis et al., 1995). However, these papers reported experiments using limited sizes of the target and did not indicate that the measurement accuracy by centroid methods may oscillate in an approximately 0.5 pixel cycle in radius.
On the other hand, in computer vision Bose and Amir (1990) reported the investigation of the effect of the shape and size of a square, a diamond, and a circle on the measurement accuracy of its center location by the unweighted centroid method using a binarized image. They conducted the analysis of the measurement accuracy of the center location of a square and showed the standard deviations of the measurement errors of the center location of a square derived from the variances of the measurement errors of the center location of a line segment. However, we confirmed that their study would be incomplete and the measurement accuracy of the center location of a square from 2 to 22 pixels in side shown in their paper is that when one side of a rectangle is infinite and the other side is from 2 to 22 pixels. Moreover, they executed the simulation on the measurement accuracy of the center location of a circle. In their simulation, 400 binarized circles were placed at 0.05 pixel intervals covering a range of one pixel in x and y direction, and the radius of a circle was examined at merely 0.25 pixel intervals. Consequently, there was no mention of finding cyclic measurement errors of the center location of a circle in their paper.
Our previous paper (Matsuoka et al., 2010) reported an analysis of the effect of sampling in creating a digital image on the measurement accuracy of the center location of a line segment, a square and a circle by two centroid methods: intensity-weighted centroid method and unintensity-weighted centroid method using a binary image created by thresholding. The study was conducted on the assumption that images were sampled but not quantized in digitization. We succeeded in obtaining general formulae representing the variance of measurement errors of the center location of a line segment by both methods, and the variance of measurement errors of the center location of a square by the intensity-weighted centroid method. The obtained formulae show that the variance of measurement errors oscillates in a one-pixel cycle in length as to a line segment and in a one-pixel cycle in side as to a square. Moreover, the formulae indicate that the oscillation of the measurement accuracy is produced by sampling in creating a digital image. As for a circle, although general expressions representing the measurement accuracy by both methods are unable to be obtained analytically, we succeeded in obtaining the variances of measurement errors by numerical integration and the effective approximation formulae of those. From the results, we concluded that sampling in creating a digital image would cause the measurement accuracy of the center location of a circle by both methods to oscillate in an approximate one-pixel cycle in diameter.
Furthermore, we investigated the effect of quantization in creating a digital image on the measurement accuracy of the center location of a circle by the intensity-weighted centroid method (Matsuoka et al., 2011). We obtained the variances of measurement errors for 39 quantization levels ranging from two to infinity by numerical integration. The results showed that the variances of measurement errors would oscillate in an approximate one-pixel cycle in diameter for any quantization level and decrease as a quantization level increases. The differences of the variances among the different quantization levels would be negligible when the quantization level is equal to or greater than 64.
However, a circle on a plane is projected as an ellipse onto an oblique image. Centroid methods, structural measuring methods, and image matching methods are utilized to estimate the center location of an ellipse similarly to the estimation of the center location of a circle. On the other hand, there is a disparity on an oblique image between the center of the projected ellipse and the projected location of the center of a circle. We succeeded in obtaining a general formula calculating the disparity using the size and the location of a circle, the focal length, the position and the attitude of a camera (Matsuoka et al., 2009a). By using the obtained formula, we can estimate the center of the circle under perspective projection from the measured center of the projected ellipse.
Therefore we intended to conduct an experiment to investigate whether the measurement accuracy of the center location of an ellipse on a digital image by some typical measurement methods oscillates as its dimension increases. We made the experiment by the Monte Carlo simulation using 1024 synthesized images of which the centers were randomly distributed in one pixel for each ellipse. Since the aim of our study is to investigate the basic characteristics of the measurement method on the oscillation of the measurement accuracy, the synthesized images utilized in the experiment were assumed free from noise.
2. OUTLINE OF EXPERIMENT
2.1 Investigated measurement methods
We investigated four typical measurement methods: intensity-weighted centroid method, non-iterative ellipse fitting, iterative ellipse fitting with the star operator, and least-squares matching, which are called CM, EF, SO, and LM for short in the paper respectively.
2.1.1 Intensity-weighted centroid method CM: Centroid methods are relatively simple and theoretically independent of the image resolution. Furthermore, centroid methods do not require a template dependent on the image resolution. Accordingly, centroid methods are often utilized in measurement of the target location in photogrammetry.
The intensity-weighted centroid method CM in the study estimates the center location (xC, yC) of an ellipse by using the experiment was calculated by using the following equation:
O grey levels of an ellipse and a background respectively.
2.1.2 Non-iterative ellipse fitting EF: Ellipses may be represented algebraically by the following equation:
2 2, 2 2 2 0
f x y Ax BxyCy Dx Ey F (3)
Once six parameters from A to F in Equation (3) are determined, the center location (xC, yC) of the ellipse can be easily obtained by using the following equation:
2
Five parameters out of the six ellipse parameters from A to F are independent, and can be estimated by least-squares fitting. If the origin (0, 0) is not located on the boundary of an ellipse, F can be set 1.
We adopted the square of the gradient of an image as the weight in the least-squares fitting as Förstner and Gülch (1987) proposed in order to avoid the detection of edge points. The
weight wij in the least-squares fitting was calculated by using
2.1.3 Iterative ellipse fitting with the star operator SO: The center of an ellipse is determined iteratively in the following steps:
Step 1: Define a search window based on a given approximate position.
Step 2: Extract edge points (ellipse boundary). Step 3: Estimate ellipse parameters.
Step 4: Correct the approximate position. Step 5: Return to Step 2.
Luhmann (1986) proposed the star operator that determines points on the ellipse by edge detection along search lines radiating from an approximate position inside the ellipse. Figure 1 shows the principle of the star operator. The search lines intersect the ellipse at favourable angles and pixel values must be appropriately interpolated along the lines at the star operator. The coordinates of the extracted edge points are subsequently utilized to estimate the six parameters from A to F in Equation (3). We extracted edge points by using zero-crossing of the second-order image derivatives, and the weight in the least-squares fitting was the square of the gradient calculated by using Equation (5).
Figure 1. Principle of the star operator (Luhmann et al., 2006)
2.1.4 Least-squares matching SO: The method of least-squares matching employs an iterative geometric and radiometric transformation between reference image and search image in order to minimize the sum of the squares of pixel value differences between the images (Förstner, 1982, Ackermann, 1983, Gruen, 1985). For a known pixel value structure, the reference image can be generated synthetically and used as a template for all similar points in the search image.
We adopted an affine transformation as geometric transformation and a linear pixel value transformation as radiometric transformation in the experiment.
2.2 Synthesized images
An ellipse with a semi-major axis a and a semi-minor axis b may be represented by the following equation:
2 2 semi-minor axis b is expressed in the following equation:
a b f
a
(7)
The general expressions representing the measurement accuracy by all the investigated methods are unable to be obtained analytically. The variances of measurement errors by SO and LM can hardly be obtained by numerical integration owing to their iterative process. Therefore we made the experiment by the Monte Carlo simulation using 1024 synthesized images of which the centers were randomly distributed in one pixel for each ellipse.
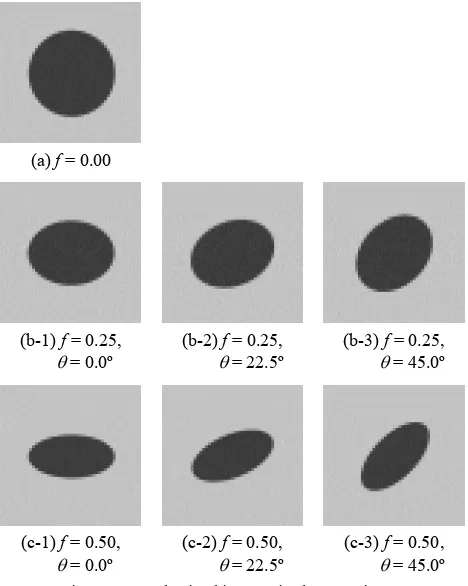
We assumed that normal and oblique images shooting a black filled circle on a white sheet. Each acquired image was assumed free from noise and its quantization level was eight bits. The grey levels of the ellipse and the background sheet were assumed 192 and 64 respectively. Three flattenings f: 0.00 (circle, b = a), 0.25 (b = 0.75×a), and 0.50 (b = 0.50×a) were investigated. Three rotation angles : 0.0°, 22.5°, and 45.0° were investigated as well. Figure 2 shows synthesized ellipse images utilized in the experiment.
(a) f = 0.00 Figure 2. Synthesized images in the experiment
2.3 Measurement accuracy
Measurement accuracy was measured by a root mean squares of errors (RMSE) in estimation of the center positions of 1024 measuring images for each ellipse.
3. RESULTS AND DISCUSSION
3.1 Measurement accuracy of a circle
Figure 3 shows the RMSEs of the center location measurement of a circle against the radius r of a circle. The radius r was examined at 1/20 (= 0.05) pixel intervals from 2 to 30 pixels. The vertical axis of Figure 3 is expressed on a logarithmic scale.
Figure 3 shows that the RMSEs by all the investigated measurement methods show a tendency to decrease gradually as the radius increases. Figure 3 clearly indicates that the RMSEs by all the methods oscillate as well. The amplitude of the oscillation of the RMSE by CM decreases gradually as the radius increases, while those by EF, SO, and LM do not decrease obviously as the radius increases.
Figure 4 shows the RMSEs of the center location measurement of a circle with the radius r from 12 to 18 pixels. The radius r was examined at 1/64 (= 0.015625) pixel intervals. The vertical axis of Figure 4 is expressed on a linear scale.
Figure 4 demonstrates that the measurement accuracy by CM and EF would oscillate in an approximately 0.5 pixel cycle in radius. The phase of the oscillation of the measurement accuracy by EF would be in inverse relation to that by CM. On the other hand, Figure 4 shows that the measurement accuracy by SO would oscillate and have two local maxima and two local minima in an approximately 0.5 pixel cycle in radius. However, the intervals between the adjacent local maxima were not uniform. Therefore we were unable to determine the cycle of the oscillation of the measurement accuracy by SO. Figure 4 indicates that the RMSE by LM might oscillate in an approximately 1 pixel cycle in radius. The oscillation of the RMSE by LM is not as smooth as that by CM and EF.
Figure 3. RMSE of the center location measurement of a circle (2 pixels r 30 pixels)
Figure 4. RMSE of the center location measurement of a circle (12 pixels r 18 pixels)
3.2 Measurement accuracy of an ellipse
3.2.1 Rotation angle = 0º: Figure 5 and Figure 6 show the RMSEs of the center location measurement of an ellipse with the flattening f = 0.25 and f = 0.50 when = 0.0º respectively. The semi-major axis a of an ellipse was examined at 1/64 (= 0.015625) pixel intervals from 12 to 18 pixels. The vertical axes of Figure 5 and Figure 6 are expressed on a linear scale.
Figure 5 and Figure 6 indicate that the measurement accuracy by CM and EF would oscillate smoothly. The phase of the oscillation of the measurement accuracy by EF would be in inverse relation to that by CM similarly to the center location measurement of a circle. On the other hand, the cycles of the oscillation shown in Figure 5 and Figure 6 are different. Figure 5 shows that the measurement accuracy by CM and EF has 9 local maxima and 9 local minima in the range {12 pixels a 18 pixels}, while Figure 6 shows that the measurement accuracy by CM and EF has 6 local maxima and 6 local minima in the same range. In the meanwhile, Figure 4 shows that the measurement accuracy of the center location of a circle by CM and EF has 12 local maxima and 12 local minima in the range
of the radius r from 12 to 18 pixels. We guessed that the measurement accuracy of the center location of an ellipse by CM and EF might oscillate in an approximately 0.5 pixel cycle in semi-minor axis b when = 0.0º.
Figure 4 Figure 5 Figure 6
flattening f 0.00 0.25 0.50
semi-minor axis b 1.00 × a 0.75 × a 0.50 × a
local maxima 12 9 6
local minima 12 9 6
Table 1. Number of local maxima and local minima of the measurement accuracy by CM and EF
(12 pixels a 18 pixels, = 0.0º)
Figure 5 indicates that the measurement accuracy by SO would oscillate and have 18 local maxima and 18 local minima in the range {12 pixels a 18 pixels}, while Figure 6 indicates that the measurement accuracy by SO has 6 local maxima and 6 local minima in the same range. The intervals between the adjacent local maxima in Figure 5 were not uniform similarly to the measurement accuracy of the center location of a circle by Figure 5. RMSE of the center location measurement of an ellipse (12 pixels a 18 pixels, f = 0.25, = 0.0º)
Figure 6. RMSE of the center location measurement of an ellipse (12 pixels a 18 pixels, f = 0.50, = 0.0º)
SO shown in Figure 4. On the other hand, Figure 6 suggests that the measurement accuracy of the center location of an ellipse with f = 0.50 by SO might oscillate in an approximately 1.0 pixel cycle in semi-major axis a.
The experiment results shown in Figure 5 and Figure 6 indicate that the measurement accuracy by LM would oscillate as the dimension of an ellipse increases in the same way as the center location measurement of a circle shown in Figure 4. However, the cycle of the oscillation would be unable to be determined.
3.2.2 Rotation angle = 22.5º: Figure 7 and Figure 8 show the RMSEs of the center location measurement of an ellipse with the flattening f = 0.25 and f = 0.50 when = 22.5º respectively. The semi-major axis a of an ellipse was examined at 1/64 (= 0.015625) pixel intervals from 12 to 18 pixels. The vertical axes of Figure 7 and Figure 8 are expressed on a linear scale.
Figure 7 and Figure 8 show that the measurement accuracy by CM and EF would oscillate rather smoothly. The phase of the oscillation of the measurement accuracy by EF would be in
inverse relation to that by CM in the same way as = 0.0º. The cycles of the oscillation shown in Figure 7 and Figure 8 are different as well. Figure 7 indicates that the measurement accuracy by CM has 9 local maxima and 10 local minima in the range {12 pixels a 18 pixels}, while Figure 8 indicates that the measurement accuracy by CM and EF has 7 local maxima and 7 local minima in the same range. The cycle of the oscillation increases as f increases. The intervals between the adjacent local maxima in Figure 7 and Figure 8 were not uniform.
Figure 4 Figure 7 Figure 8
flattening f 0.00 0.25 0.50
semi-minor axis b 1.00 × a 0.75 × a 0.50 × a
local maxima 12 9 7
local minima 12 10 7
Table 2. Number of local maxima and local minima of the measurement accuracy by CM
(12 pixels a 18 pixels, = 22.5º) Figure 7. RMSE of the center location measurement of an ellipse (12 pixels a 18 pixels, f = 0.25, =22.5º)
Figure 8. RMSE of the center location measurement of an ellipse (12 pixels a 18 pixels, f = 0.50, =22.5º)
Figure 7 and Figure 8 show that the measurement accuracy by SO would oscillate. The cycle of the oscillation would be unable to be determined.
The experiment results shown in Figure 7 and Figure 8 indicate that the measurement accuracy by LM would oscillate as the dimension of an ellipse increases in the same way as a circle shown in Figure 4. However, the cycle of the oscillation would be unable to be determined.
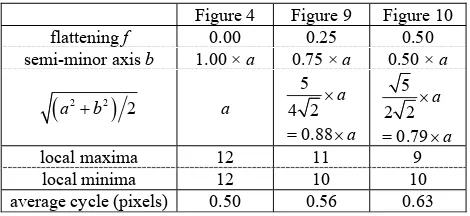
3.2.3 Rotation angle = 45º: Figure 9 and Figure 10 show the RMSEs of the center location measurement of an ellipse with the flattening f = 0.25 and f = 0.50 when = 45.0º respectively. The semi-major axis a of an ellipse was examined at 1/64 (= 0.015625) pixel intervals from 12 to 18 pixels. The vertical axes of Figure 9 and Figure 10 are expressed on a linear scale.
Figure 9 and Figure 10 indicate that the measurement accuracy by CM and EF would oscillate smoothly. The phase of the oscillation of the measurement accuracy by EF would be in inverse relation to that by CM similarly in the same way as =
0.0º and = 22.5º. The cycles of the oscillation shown in Figure 9 and Figure 10 are different as well. Figure 9 indicates that the measurement accuracy by CM has 11 local maxima and 10 local minima in the range {12 pixels a 18 pixels}, while Figure 10 indicates that the measurement accuracy by CM and EF has 9 local maxima and 10 local minima in the same range. The cycle of the oscillation increases as f increases. The intervals between the adjacent local maxima were not uniform in Figure 9 and Figure 10.
The average cycle of the measurement accuracy by CM and EF may be approximately 0.56 pixel in semi-major axis a as to f = 0.25, and approximately 0.63 pixel in semi-major axis a as to f = 0.50. We guessed that the measurement accuracy of the center location of an ellipse by CM and EF might oscillate in an approximately 0.5 pixel cycle in
2 2
2
a b when = 45.0º. Figure 9. RMSE of the center location measurement of an ellipse (12 pixels a 18 pixels, f = 0.25, = 45.0º)
Figure 10. RMSE of the center location measurement of an ellipse (12 pixels a 18 pixels, f = 0.50, = 45.0º)
Figure 4 Figure 9 Figure 10
Table 3. Number of local maxima and local minima, and the average cycle of the oscillation
of the measurement accuracy by CM (12 pixels a 18 pixels, = 45.0º)
The experiment results shown in Figure 9 and Figure 10 indicate that the measurement accuracy by SO and LM would oscillate as the dimension of an ellipse increases in the same way as a circle shown in Figure 4. However, the cycles of the oscillations would be unable to be determined.
4. CONCLUSIONS
The experiment results clearly show that the measurement accuracy by all the investigated measurement methods would oscillate as the dimension of an ellipse increases. The measurement accuracy by CM and EF would oscillate smoothly, while that by LM would oscillate considerably roughly. The approximate cycles of the oscillation of the measurement accuracy by CM and EF were determined when = 0.0º and = 45.0º. As for the other cases it would be difficult to determine the cycle of the oscillation.
On the other hand, the results indicate that the flattening f and the rotation angle of an ellipse would affect the cycle of the oscillation. The results demonstrate that the cycle of the oscillation of the measurement accuracy by CM and EF increases as the flatting increases, and decreases as the rotation angle increases.
In order to investigate the influence of the flatting and the rotation angle of an ellipse on the cycle of the oscillation of the measurement accuracy by CM and EF, we are conducting an experiment by numerical integration as to a wider range of the semi-major axis, more various flattenings, and more various rotation angles. Moreover we are now planning to investigate the effect of image noise on the oscillation of the measurement accuracy.
REFERENCES
Ackermann, F., 1983. High Precision Digital Image Correlation, Proceedings of the 39th Photogrammetric Week, Stuttgart, Germany, pp. 231-243.
Bose, C. B., Amir, I., 1990. Design of Fiducials for Accurate Registration Using Machine Vision, IEEE Transactions on Pattern Analysis and Machine Intelligence, 12(12), pp. 1196-1200.
Förstner, W., 1982. On the Geometric Precision of Digital Correlation, The International Archives of Photogrammetry and Remote Sensing, Helsinki, Finland, Vol. XXIV, Part 3, pp. 176-189.
Förstner, W., Gülch, E., 1987. A Fast Operator for Detection and Precise Location of Distinct Points, Corners and Centres of Circular Features, Proceedings of ISPRS Intercommission Workshop on Fast Processing of Photogrammetric Data, Interlaken, Switzerland, pp. 281-305.
Gruen, A., 1985. Adaptive Least Squares Correlation – a Powerful Image Matching Technique, South African Journal of Photogrammetry, Remote Sensing and Cartography, 14(3), pp. 175-187.
Luhmann, T., 1986. Automatic Point Determination in a Réseau-Scanning System, The International Archives of the Photogrammetry and Remote Sensing, Ottawa, Canada, Vol. XXVI, Part 5, pp. 400-408.
Luhmann, T., Robson, S., Kyle, S., Harley, I., 2006. Close Range Photogrammetry, Whittles Publishing, Caithness, UK, pp. 114-129, pp. 364-376.
Matsuoka, R., Sone, M., Sudo, N., Yokotsuka, H., Shirai, N., 2009a. A Study on Location Measurement of Circular Target on Oblique Image, Optical 3-D Measurement Techniques IX, Vienna, Austria, Vol. I, pp. 312-317.
Matsuoka, R., Sone, M., Sudo, N., Yokotsuka, H., Shirai, N., 2009b. Comparison of Measuring Methods of Circular Target Location, Journal of the Japan Society of Photogrammetry and Remote Sensing, 48(3), pp. 154-170.
Matsuoka, R., Sone, M., Sudo, N., Yokotsuka, H., Shirai, N., 2010. Effect of Sampling in Creating a Digital Image on Measurement Accuracy of Center Location of a Circle, The International Archives of the Photogrammetry, Remote Sensing and Spatial Information Sciences, Paris, France, Vol. XXXVIII, Part 3A, pp. 31-36.
Matsuoka, R., Shirai, N., Asonuma, K., Sone, M., Sudo, N., Yokotsuka, H., 2011. Measurement Accuracy of Center Location of a Circle by Centroid Method, Photogrammetric Image Analysis, LNCS Volume 6952, Springer-Verlag, Heidelberg, Germany, pp. 297-308.
Shortis, M. R., Clarke, T. A. and Robson, S., 1995. Practical Testing of the Precision and Accuracy of Target Image Centring Algorithms. Videometrics IV, SPIE Vol. 2598, pp. 65-76.
Trinder, J. C., 1989. Precision of Digital Target Location, Photogrammetric Engineering and Remote Sensing, 55(6), pp. 883-886.
Trinder, J. C., Jansa, J., Huang, Y., 1995. An Assessment of the Precision and Accuracy of Methods of Digital Target Location, ISPRS Journal of Photogrammetry and Remote Sensing, 50(2), pp. 12-20.