INTEGRATING THE UAS IN UNDERGRADUATE TEACHING AND RESEARCH
–
OPPORTUNITIES AND CHALLENGES AT THE UNIVERSITY OF NORTH GEORGIA
J.B. Sharma, D.Hulsey
Institute for Environmental Spatial Analysis, University of North Georgia, Gainesville, GA 30504, USA – [email protected]
KEY WORDS: UAS, High Spatial Resolution, GEOBIA, LiDAR, Segmentation, DSM
ABSTRACT:
The University of North Georgia (UNG) has begun to evaluate both fixed and rotary UAS platforms across the departments to evaluate their potential for furthering both student learning experiences and undergraduate research. A research project of the Institute for Spatial Analysis (IESA) at UNG has acquired the fixed wing eBee UAS and is currently piloting its integration into the undergraduate geospatial science curriculum. Limited very low altitude, line of sight calibration runs within areas of our campus have help us understand the capabilities that this technology brings to learning and research opportunities at UNG. In our pilot area of study on the UNG Gainesville Campus, we will collect overlapping imagery and generate 3-D models. These models will be compared with models based on LiDAR data. Geographic Object Based Image Analysis (GEOBIA) methods are essential to the analysis of voluminous high resolution UAS data and the associated computational and regulatory issues are discussed. Several future interdisciplinary projects are envisaged with the eBee UAS and this project helps establish their viability.
1. INTRODUCTION
The advent of increasingly sophisticated and affordable Unmanned Aerial Systems (UAS) is rapidly opening up novel possibilities for high spatial resolution remote sensing. This capability is rapidly opening the door to a whole host of urban, environmental and engineering high resolution mapping applications. The rapid growth of UAS deployment will continue to be propelled by a greater confluence of both data collection and computation capability. This raises several imperatives for higher education including workforce development, novel curriculum, technology management, legal regulations and public safety. In the United States, the Federal Aviation Administration (FAA) is in the process of developing a process by which academic and commercial entities can get a Certificate of Authorization (COA) to conduct remote sensing flights. The FAA will have a finalized regulatory framework in place by late 2015 and this holds the promise of ushering in a new era of UAS acquired remotely sensed data and their applications. This also gives impetus to the further implementation of Geographic Object Based Image Analysis (GEOBIA) techniques which are essential for the analysis of both the spectral and spatial data collected by a UAS.
1.1 UAS – The eBee UAS by Sensefly
The University of North Georgia (UNG) is a public comprehensive university that has the Institute of Environmental Spatial Analysis (IESA) that is dedicated to research and teaching in geospatial science and technology. An eBee Sensefly UAS (Sensefly, 2014) has been acquired to experiment with how it can be optimally integrated into the remote sensing curriculum and research projects. The eBee is a hand launched drone with a blended wing airframe design and an electric motor driven pusher propeller. It has a 96 cm (38 inch) wingspan and when fully loaded for flight (with camera and battery installed) it has a mass of 0.69 Kg (1.5 pounds), making it one of the lightest mapping drones on the market. The airframe is constructed of dense foam and composite materials.
The maximum flight time is around 45 minutes and when carrying out a mapping mission it cruises at about 5 to 10 meters/sec (10 to 20 knots) while powered by a rechargeable Lithium-polymer battery. The eBee is designed with a modular camera system that allows the user to easily switch out cameras to allow for the use of different sensor capabilities. It is capable of mapping up to 12 km2 (4.6 miles2) and spatial resolution of up to 1.5 cm (0.6 in) , at the maximum height of 975 m (3195 ft) Above Ground Level (AGL).
It uses Canon 16 MP still cameras that are capable of imaging in the visible band (R-G-B) or in the Near Infra-Red (NIR) Band (NIR-R-G). Furthermore, if the image acquisition is done with a significant overlap between the imagery, a 3D high resolution Digital Surface Model (DSM) can be created, which provides spatial characteristics of the study area along with the spectral information in the orthoimagery. Both the spatial and the spectral data obtained can be processed with GEOBIA techniques (Blaschke 2014) into very accurate land cover maps by utilizing eCognition software.
1.2 The Study Area
The current FAA regulations allow educational institutions to conduct UAS flights to conduct academic research on their campus only while maintaining an altitude from ground of less than 122 m (400 feet) if they are at least 5 miles or further away from an airport (FAA-UAS, 2014). Hobbyists flying radio controlled aircraft are allowed flights at an altitude less than 122 m (400 feet) in unrestricted air space. The eBee flights conducted were solely line of sight autonomous test flights at an altitude of 84 m (275) feet around the Science Building of the University of North Georgia Gainesville campus. The planimetric footprint of the Science Building is about 2500 m2 (27000 ft2). The manager of the Gainesville Airport was informed of these test flights and the kml file of a typical flight around the Science Building was shared with him. A formal COA is being developed for submission to the FAA to conduct academic research flights on all of the UNG campuses. The International Archives of the Photogrammetry, Remote Sensing and Spatial Information Sciences, Volume XL-1, 2014
ISPRS Technical Commission I Symposium, 17 – 20 November 2014, Denver, Colorado, USA
This contribution has been peer-reviewed.
2. COLLECTING AND ANALYZING THE DATA
The primary intent of these test flights was to evaluate the flight planning, control and data processing systems for suitability as a high performance research tool. In addition the feasibility of integrating this technology in the undergraduate geospatial science and technology curriculum was also evaluated. This includes safety, ease of use, accuracy of data, portability, sensor flexibility and robustness of the software.
2.1 Flight Planning
The eBee Sensefly UAS comes with eMotion software for flight planning and transferring the flight plan to the aircraft. The software allows for interactive mission planning in which the flying height is a function of the size of the ground pixel desired and the type of a camera being used. Forward and sideways overlaps in the imagery can be set and are typically maximized for the most detailed 3D model. The flight take-off and landing corridors are carefully chosen to allow a clear unobstructed path. Once the flight plan is loaded on the eBee, the flight is totally autonomous and the flight avionics and telemetry can be tracked on a laptop. The operator can intervene and take control of the eBee if needed and the fight can be automatically aborted as well in which it returns back along the planned landing path. The wireless modem connected to the laptop can communicate with the eBee for up to 3 Km (1.84 miles).
2.2 Data Collection
The UNG Gainesville Science Building was imaged with two mutually perpendicular sets of flight lines that allowed for 90% forward overlap and 75% side overlap so as to generate as accurate a 3D point cloud and model of the building as possible. The flight height at 84.0 m (275 feet) resulted in a 3 cm image pixel on the ground. Imagery was captured using the Canon RGB and NIR cameras. The imagery mosaic of the building is shown in Figure 1 and has an area of about 10400 m2 (112000 ft2). The eBee has a GPS unit that collects its position and an inertial navigation system that collects the camera orientation angular parameters that are both necessary for proper image re-projection. A barometric altimeter measures the eBee altitude and a ground sensor allows for crash avoidance while landing.
2.3 Data Processing
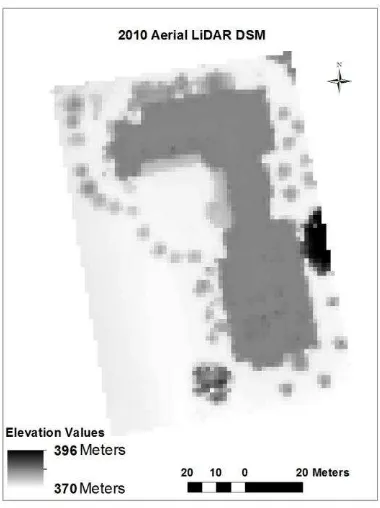
The eBee UAS also comes with the Postflight Terra 3D software to process the collected imagery into a seamless orthomosaic and generate a point cloud from which a 3D model of the terrain can be created. The 3D point cloud had to be geo-rectified with at least 3 Ground Control Points (GCP’s) which were collected by a survey grade Trimble GPS unit. The Terra 3D software allows for a quick pre-processing of the data in the field to determine if the captured data is satisfactory. The orthophoto mosaic is shown in Figure 1. The Digital Surface Model (DSM) was generated as a point cloud with a high point density of about 970 points/m2 and has a pixel resolution of 3.0 cm (1.2 in). A planimetric rendering of the eBee DSM is shown in Figure 2. This data was collected in Fall 2014 and will be compared with a 2010 aerial LiDAR derived DSM of the science building. The aerial LiDAR has a point density of about 10 points/m2 and a pixel resolution of 1.5 m (4.9 ft). This aerial DSM is shown in Figure 3.
Since the aerial LiDAR was taken at an earlier time, it is noteworthy that a large Oak tree on the left of the building is missing in the later eBee acquired DSM in Figure 2.
Also the trees on the left are smaller in the aerial LiDAR DSM and have grown four years later in the eBee DSM. This will have implications in the analysis of the difference DSM raster.
Figure 1. eBee Science Building Mosaic
Figure 2. eBee Imagery Derived DSM
The International Archives of the Photogrammetry, Remote Sensing and Spatial Information Sciences, Volume XL-1, 2014 ISPRS Technical Commission I Symposium, 17 – 20 November 2014, Denver, Colorado, USA
This contribution has been peer-reviewed.
2.4 Data Analysis
The 2014 eBee DSM was subtracted from the 2010 aerial LiDAR In order to ascertain the differences between the elevation contained in the two DSM rasters, the 2014 eBee DSM was subtracted from the coarser 2010 aerial LiDAR data. The difference raster is shown in Figure 3.
The average difference between the two raster’s is about 1.7 cm. The growth of the trees around the building that has occurred between 2010 and 2014 is apparent by the negative values for height differences. The lack of an Oak tree that was removed when the 2014 imagery was taken is evident to the large negative values on the right side of the building. The aerial LiDAR DSM has near-vertical surfaces smoothly interpolated through the rapid elevation changes and along these edges the difference raster shows positive values. This is because the pixel size of the aerial LiDAR DSM has a 1.5 m pixel which is subtracting the 3 cm pixels of the eBee generated DSM. This ‘overhang’ of the coarser LiDAR DSM pixel shows a large positive difference with the more accurate eBee DSM at the edges of the building.
Figure 3. Aerial LiDAR 2010 based DSM
2.5 GEOBIA Based Land Cover Classification
The eBee derived RGB image mosaic and DSM were loaded on to the eCognition software and parsed into objects using the quadtree, multiresolution and spectral difference segmentation (Baatz 2000, Blaschke 2004). A rule-set was then developed on eCognition software to classify the data into a land cover map.
This process revealed several challenges in the object based classification of this ultra-high spatial resolution data. The scaling parameters used in the segmentation process were much larger than the numbers used for aerial and satellite imagery. The extreme detail on the imagery parses it into many different objects each with varying spectral, morphological and proximity characteristics. With such extreme spectral inhomogeneity in the image, the development of a rule-set that accurately
classifies the entire image is a challenging task. The shadows and the small differences in the lighting conditions are a problematic issue that will need to be resolved in subsequent research projects. This will involve invoking many advanced features in the eCognition software and will be the central research thrust once the COA’s are obtained from the FAA for research flights on our campus. A rule-set was developed on eCognition to come up with a land cover map which is shown in Figure 5. There are several errors on this map that need to be corrected in subsequent rule-set development, among the most obvious being the mixing of the trees on the left of the building with the grass.
Figure 4. Difference in LiDAR and eBee DSM
Figure 5. GEOBIA Based Land Cover
The International Archives of the Photogrammetry, Remote Sensing and Spatial Information Sciences, Volume XL-1, 2014 ISPRS Technical Commission I Symposium, 17 – 20 November 2014, Denver, Colorado, USA
This contribution has been peer-reviewed.
3. CONCLUSIONS
The eBee Sensefly UAS has proven itself to be a very safe, reliable and versatile technology that needs to be systematically integrated into the undergraduate remote sensing and image processing curriculum. It is also a very capable tool for exploring research questions by being able to provide very accurate and precise spectral information as orthoimagery and surface heights as a DSM. This gives impetus to GEOBIA literacy as this is the only viable methodology for simultaneously processing the spatial and spectral data in an automated manner with rule-sets to produce land cover maps. The classification challenges that arose from the ultra-high resolution of the data point to the need for development of more sophisticated GEOBIA methodologies and rule-sets. This will be pursued as future research projects.
These test flights also became demonstrations of this technology to UNG students eliciting both excitement and interest in science. Upon receiving a formal approval for research flights on the UNG campuses, the eBee UAS will be used for K12 outreach, energy audits by thermal imaging, accurate 3D models of UNG and tree species identification are just a few of the possible undergraduate research projects are planned. The next step in this UAS calibration project will be to ascertain if there is any measurable distortion in the 3D models by comparison with a grid of accurate GPS measurements. These future research directions will add to the student engagement and learning experiences while developing pathways for optimal methods for the processing of the eBee UAS data into land cover maps.
ACKNOWLEDGEMENTS
Thanks to the UNG Foundation for a grant to acquire the eBee Sensefly UAS
Thanks to Jacob Hickenbottom for his help and participation in this project.
REFERENCES
Blaschke, T., Hay, G.J., Kelly, M., Lang, S., Hofmann, P., Addink, E., Feitosa, R.Q., van der Meer, F., van der Werff, H., van Coillie, F., Tiede, D., 2014. Geographic Object-Based Image Analysis-Towards a new paradigm. ISPRS J. Photogramm. Remote Sens. 87, pp. 180–191.
Baatz, M. and Schäpe, M., 2000. Multiresolution segmentation - An optimization approach for high quality multi-scale image segmentation. In: J. Strobl, T. Blaschke and G. Griesebner, (Eds.), Angewandte Geographische Informations-Verarbeitung XII, Wichmann Verlag, Karlsruhe, pp. 12-23.
Blaschke, T., Burnett, C., Pekkarinen, A., 2004. Image Segmentation Methods for Object-Based Analysis and Classification. In Remote Sensing Image Analysis: Including the Spatial Domain; Springer: Berlin, Germany, pp. 211–236.
eBee 2014, Extended User Manual,2010 – 2014 Sensefly, Ltd.
FAA-UAS 2014, Fact Sheet-Unmanned Aircraft Systems,
http://www.faa.gov/news/fact_sheets/news_story.cfm?newsId=1 4153 (Oct 10, 2014)
Sensefly, 2014, http://www.sensefly.com (Oct 16, 2014) The International Archives of the Photogrammetry, Remote Sensing and Spatial Information Sciences, Volume XL-1, 2014
ISPRS Technical Commission I Symposium, 17 – 20 November 2014, Denver, Colorado, USA
This contribution has been peer-reviewed.