MULTISPECTRAL CALIBRATION TO ENHANCE THE METROLOGY
PERFORMANCE OF C-MOUNT CAMERA SYSTEMS
Stuart Robson a, Lindsay MacDonald a, Stephen Kyle a and Mark Shortis b
a
Dept. of Civil, Environmental & Geomatic Engineering, UCL, London.
b
School of Mathematical and Geospatial Sciences, RMIT University, Melbourne.
[email protected] Commission V
KEY WORDS: metrology, camera calibration, photogrammetry, multispectral imaging, chromatic aberration
ABSTRACT:
Low cost monochrome camera systems based on CMOS sensors and C-mount lenses have been successfully applied to a wide variety of metrology tasks. For high accuracy work such cameras are typically equipped with ring lights to image retro-reflective targets as high contrast image features. Whilst algorithms for target image measurement and lens modelling are highly advanced, including separate RGB channel lens distortion correction, target image circularity compensation and a wide variety of detection and centroiding approaches, less effort has been directed towards optimising physical target image quality by considering optical performance in narrow wavelength bands. This paper describes an initial investigation to assess the effect of wavelength on camera calibration parameters for two different camera bodies and the same ‘C-mount’ wide angle lens. Results demonstrate the expected strong influence on principal distance, radial and tangential distortion, and also highlight possible trends in principal point, orthogonality and affinity parameters which are close to the parameter estimation noise level from the strong convergent self-calibrating image networks.
1. BACKGROUND
Photogrammetric camera calibration is a heavily researched area building on a long history (Clarke and Fryer, 1998). Commencing with a physical appreciation of geometric lens modelling (Brown, 1971), through purpose-built lens design to minimise geometric image distortions (Mark, 1993), to today’s almost ubiquitous self-calibrating bundle adjustment, the success of established methods transcends many imaging disciplines. As discussed in Fraser (2012), one of the less appreciated aspects of the camera calibration process is the correction and modelling of geometric image discrepancies caused by variations in the wavelength of the imaging light. These discrepancies, broadly referred to as chromatic aberrations, are present to differing extents in all lens designs from basic ‘C-mount’ systems to the most advanced lenses for large format professional photography.
The widespread use of digital camera systems equipped with either RGB mosaic (Bayer) filters, or separate filtered sensors, able to deliver three-channel colour images have prompted several camera calibration investigations. Reported work has concentrated on the modelling and correction of distortions in the three available colour channels and then recombining the images (e.g. Mallon & Whelan, 2007) or working through an extended RGB photogrammetric camera model (e.g. Luhmann et al, 2006; Cronk et al, 2006) to provide image coordinate corrections. In these cases the approaches were limited by the broad spectral imaging properties of the sensors with their three band outputs.
2. EXPERIMENTAL WORK
The paper represents one starting point of a five year research project directed at enhancing the metrology capability of real-time photogrammetry with low-cost camera systems. This first paper seeks to improve our understanding of the optical capabilities of low cost sensors and lenses by imaging retro-target networks over a series of discrete wavelength ranges covering much of the spectral sensitivity of silicon. The aim is to
investigate the performance of low-cost cameras for photogrammetry, not only in the visible portion of the spectrum but extending beyond into the near UV and IR regions where the illumination of targets by narrow-band light sources invisible to the human eye can have significant advantages.
The reported method supports characterisation of the wavelength dependence of camera system for both chromatic aberration and photogrammetric parameters. Characterisation is achieved through multispectral imaging with 21 narrow‐band filters applied to the light source whilst keeping the camera lens and unfiltered CMOS sensor arrangement constant. Each narrow band illuminant is used to capture a network of convergent images of a 3D retro-target test array in what is otherwise a conventional photogrammetric camera calibration process.
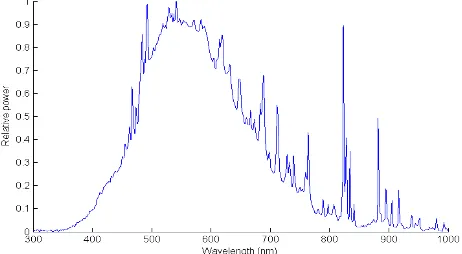
Figure 1. Spectral power distribution of studio flash light.
A Balcar studio flash lamp was used as the light source, fitted with a softbox to diffuse the emitted light over a wide angle. Xenon arc flash has a broad continuous spectral power distribution, with significant power over the full imaging range of 400-950 nm. The spectral power distribution of this flash light was measured with an Ocean Optics HR2000 spectrometer at intervals of 0.5nm (Fig. 1).
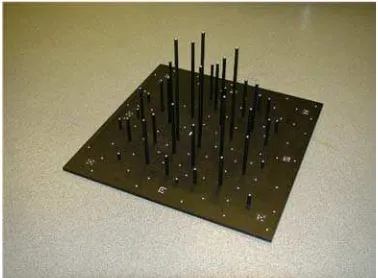
The 3D test object (‘Manhattan’) consists of a 550x550 mm aluminium baseplate of thickness 10 mm, on which are affixed 39 anodized aluminium rods of diameter 8 mm and lengths varying from 20 to 305 mm, all perpendicular to the base.
Figure 2. 3D test object illuminated by flash light, showing the distribution of retro-reflective targets and target codes.
Approximately 100 circular retro reflective targets of 2.5 mm diameter are distributed over the baseplate and on the top of each rod. The targets form a rigid array of points in a 3D coordinate space. Under flash illumination the targets are visible in the image from any viewpoint (Figure 2). Eight machine-readable codes are also fixed onto the baseplate to facilitate orientation of the target array in image processing. The 21 dichroic glass filters consist of 16 in the visible range 400–700nm at 20nm intervals, plus five in the near-infrared range 750–950nm at 50nm intervals (Figure 3), mounted in 52mm rings and manually screwed into an adapter fitted to the flash tube. The same filters were previously used in a camera-mounted mode for multispectral analysis of degraded parchment (MacDonald et al, 2013).
Figure 3. Transmittance factors as a function of wavelength for 21 dichroic filters in the visible and NIR spectrum.
An IDS UI 5480CP-M-GL camera (hereafter called uEye) was used in these tests following proven performance in other real-time photogrammetric and industrial applications carried out at UCL. The body takes ‘C-mount’ lenses and has a monochrome CMOS sensor of dimensions 5.6x4.2 mm with pixel dimension of 2.2 microns, producing an image of 2560x1920 pixels in 4:3 aspect ratio with 12 bits per pixel. The M-GL version of the camera has no Bayer mask or infra-red cut-off filter, and each pixel is sensitive to the whole spectral range of silicon 400–1100 nm. It weighs only 61g and can be powered through an Ethernet cable. For these tests, the unit was fitted with an unbranded 5mm 1:2.8 lens (Fig. 4).
Figure 4. uEye camera fitted with the ‘nobrand’ 5mm lens.
The filters were mounted at the narrow end of a customised snoot, an opaque aluminium enclosure into which the flash lamp fitted snugly. Taping around the join prevented white flash light from escaping into the room. The only light emitted was through the filter at front, with a beam angle of ~20°. Two datasets were acquired at different times with the same lens but with two different camera bodies, to test for repeatability: (1) 12 images for each of the 21 filters; (2) 16 images for each of a subset of 12 filters, consisting of seven at 60nm intervals from 400 to 700nm, and five at 50nm intervals from 750 to 950nm. Although the flash light source was the same in each case, the light was diffused by different means: (1) a sheet of opal perspex was placed in front of the filter; (2) the light assembly was fitted inside a photographic ‘softbox’ (Fig. 5).
Figure 5. Flash light inside custom snoot with filter: (left) with perspex diffuser; (right) inside softbox.
The Manhattan target was placed on a rotating platform with the centre approximately 0.5m from the camera so that it filled the field of view (Fig. 5 right). The lens was set to a focus distance of 0.5m and aperture of f/8 to ensure sufficient depth of field. The softbox diffuser on the flash was positioned close behind the camera on a tripod, so that light from the filtered flash reached the targets from angles all around the optical axis. This arrangement approximated a ring light. For each filter, a series of 12 or 16 images was taken with systematic changes of orientation and rotation of the Manhattan object relative to the camera.
The monochrome images were captured as 12-bit files in PNG format. The sets of images of the test object and its illuminated targets were analysed by Vision Measurement System (VMS) software (Version 7.6). In order to maximise the target contrast, the grey values of each image were scaled independently, and linearly, by finding percentile points at 10% and 99.95% in the histogram and mapping them to 10% of the 8-bit output range for black and 75% for white. This method allows the grey value mapping to accommodate a wide range of image illumination attributable to the different filter attenuation, output power of the xenon arc flash and spectral sensitivity of the uEye CMOS array to each wavelength group (Fig. 6).
0
350 450 550 650 750 850 950 1050
T
Figure 6. Spectral sensitivity curve for the UI 5480CP-M-GL sensor from manufacturer’s data.
The VMS software determined circular target image centres using a weighted centroid method with a dynamic threshold. It also detected machine readable targets to provide camera position and orientation estimates. These data along with the known geometry of the Manhattan target array were processed with a self-calibrating bundle adjustment to produce sets of lens parameters at each filter wavelength. The method of ‘inner constraints’ allowed 3D target coordinate data from the test object to be treated as initial estimates within the adjustment process to produce a common minimum constraints network for each set. In all cases the camera model included principal distance, principal point, radial and tangential distortion, affinity and orthogonality for a total of 10 interior parameters (Shortis et al, 1996, Ogleby et al, 1999).
3. RESULTS
The focus of this investigation was to ascertain any wavelength-dependent trends in calibration parameters. In the following figures, the camera calibration data output from the bundle adjustment (performed independently for the image set from each filter) are collated by lens type and wavelength. The graphs are arranged in all cases with Dataset1 above and Dataset2 below. Note that the first bar in the latter results is for white light (unfiltered), and so represents the results of bundle adjustment for the integrated sensor response to the full wavelengths range.
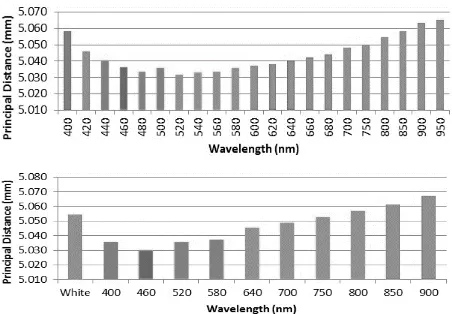
Figure 7. Variation in Principal Distance with Wavelength.
Principal distance for both cases follows a clear ‘parabolic’ trend. This is to be expected for an optical design that is corrected over the range of visible wavelengths to minimise variation in principal distance. The bulk variations seen will be characterised by a change in image magnification with wavelength which is normally supported in photogrammetry through the separate processing of R,B,G channels.
In both cases it is also clear that the lens design is balanced for visible light, as the infra-red end of the spectrum shows an increasing principal distance. Analysis of bundle adjustment output statistics demonstrated that principal distance parameters were estimated to a standard deviation of 0.006 mm, corresponding to half a vertical axis division in each of the graphs in Figure 7.
Figure 8. Variation in Principal Point (X) with Wavelength.
Principal point variations show a clear difference between the two sensors with offsets varying by some 26 pixels in the X direction and 22 pixels in the Y direction (Fig. 8 top and Fig. 9 top). However in all cases the uncertainty (standard deviation) of the estimated parameters is of the order of 0.006mm (about 3 pixels), which for Dataset2 with its additional roll angle imagery, encompasses the majority of the estimated parameter spread. Principal point, corresponding to the optical axis in an ideal lens would not be expected to be affected by variations in refraction. However if the offset is caused by physical misalignment of lens elements and the sensor cover glass, refraction could be expected to give rise to small systematic variations.
Figure 9. Variation in Principal Point (Y) with Wavelength.
Other trends are observed for both orthogonality (Fig. 10) and affinity (Fig. 11). In common with principal point, but with typical standard deviations of the order of 2x10⁻⁵ in this case, variations in the estimated parameters are of the same order as the observed differences between localised wavelengths. This suggests that whilst the sensors may be offset between the different camera bodies, their alignment to the image plane is consistent.
Figure 10. Variation in Orthogonality with Wavelength.
Figure 11. Variation in Affinity with Wavelength.
Both radial and tangential (decentring) lens distortions exhibit patterns that follow a clear trend attributable to changing refraction with wavelength (Figs. 12 and 13). Radial distortion increases as a function of radius, as is well known, but it is greatest at wavelengths around 480-500nm and less for both lower and higher wavelengths. The radial distortion curves are very similar between both datasets, whereas the tangential curves show more variation, particularly in the spread evident in Dataset1.
Figure 12. Variation in Radial Distortion with Wavelength.
Since there is no physical attribute that might give rise to greater variation, it is likely that the absence of optical axis image rolls between viewpoints in the first dataset has limited the capability of the bundle adjustment to estimate these parameters independently. This limitation is exposed on checking parameter correlations which in the worst cases approach 0.92 for the first tangential parameter and the principal point in X and 0.83 for the second tangential parameter and the principal point in Y. The tighter spread of curves in Dataset2 is promoted by the presence of additional roll images and has helped to decouple internal correlations between principal point and tangential distortion parameters, however correlations between these parameters remain high.
Figure 13. Variation in Tangential Distortion with Wavelength.
The difference between first and second tests highlights the care needed with all camera calibration processes to ensure that the target image distribution covers the complete image format. This can be difficult to achieve where there is conflict between a combination of target image diameter, depth of field, angle of view, test object dimensions and 3D complexity. The result of not achieving full coverage can be seen in three of the Dataset1 calibrations where the radial and tangential distortion curves stop at a radius of 3mm because target images were not visible at the extremes of the image format for these networks due to subtle variations in exterior orientation geometry and fewer images in the network in Dataset1 than in Dataset2.
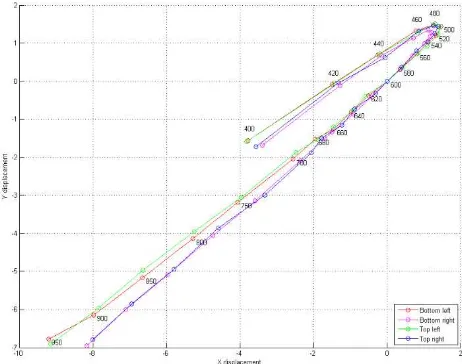
Figure 14. Trajectory of four target centroids in the image plane, showing effect of chromatic aberration in the lens. The International Archives of the Photogrammetry, Remote Sensing and Spatial Information Sciences, Volume XL-5, 2014
A useful way of representing chromatic lens aberration is by considering the way in which a target centroid is displaced in the image with changing wavelength (Ray, 2002). Taking the 600nm position as the reference, the displacement of the centroids of the furthest four targets in the corners of the field of view of the lens are plotted in Fig. 14. These data demonstrate that their position in the image plane in both x and y directions as a function of wavelength is non-monotonic, with a turning point between 480 and 500nm. The total displacement of the centroid from 500 to 900 nm is approximately 10 pixels, or about 20 microns. Such a degree of movement can be considered as the photogrammetric effect of chromatic aberration and highlights the need to achieve good target image coverage across the full image format.
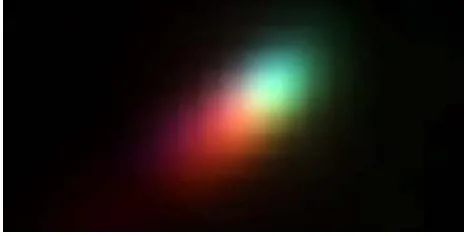
Figure 15. Superimposed images of 21 target centroids.
All 21 images of one target in the lower left of the image field were superimposed and rendered in colour, by using the intensity in each monochrome image to modulate the sRGB triplet derived from the responses of the CIE colorimetric 2° observer for the corresponding filter wavelength. The resulting colour composite (Fig. 15) shows the comet-like distribution typical of chromatic aberration in most lenses. What is interesting is that the reversal of direction of the trajectory around 500nm is not obvious from this image; it looks rather as if the displacement is monotonic from cyan to red.
4. SUMMARY
Self-calibrating network adjustments comprising geometrically strong networks of narrow spectral band imagery have demonstrated trends in the estimated camera calibration parameters with wavelength that are worthy of further investigation. At the more obvious level, the consistency and wavelength dependence of principal distance and radial distortion as a function of lens optical design can be exploited. Results particularly highlight the known requirement for camera roll angles about the optical axis within the network to decouple parameters in the camera model. Other variations, representing the next level down in the chain of variables, are less expected from published literature where only the standard broadband R,G,B channels have been investigated.
Whilst the change in camera unit, albeit maintaining the same physical lens, highlights expected differences in the computed principal point offsets, localised trends against wavelength are of similar magnitude. Similarly the improvement in geometric network strength with more camera rolls has not given rise to an improvement in our ability to discern clear trends that would be expected to be present from a physical standpoint. At this level improvements in target image quality will be attainable through narrow waveband imaging, combined with many more views to support hyper redundancy and better regularity to achieve more uniform target image distribution.
This experimental work is ongoing and currently being repeated for evaluation at a deeper level, including parameter correlation and model variation for an extended range of lenses. The objective is twofold: to gain better understanding of photogrammetric lens performance and to develop a robust and automated method for the spectral characterisation of photogrammetric lens parameters that can be used reliably to calibrate a large number of cameras. This activity will improve the capability of off-the-shelf ‘C-mount’ camera systems for engineering measurement, where it is uniquely possible to design an imaging system for a dedicated set of tasks.
All of this points towards new procedures of robotic camera and test object handling during calibration, along with careful monitoring of target image quality and distribution across the image format. These are objectives of the sponsoring EPSRC Project ‘Light Controlled Factory’.
ACKNOWLEDGEMENT
This investigation was supported by the EPSRC Grant EP/K018124/1 ‘The Light Controlled Factory’.
REFERENCES
Brown, D.C., 1971. Close-Range Camera Calibration. Photogrammetric Engineering, 37(8): 855-866.
Clarke, T.A. and Fryer, J.G., 1998: The development of camera calibration methods and models. Photogrammetric Record, Vol. 16(91), pp. 51-66
Cronk, S., Fraser, C.S. and Hanley, H.B., 2006. Automatic Calibration of Colour Digital Cameras. Photogrammetric Record, 21(116): 355-372.
Fraser, C. (2012). Automatic camera calibration in close-range photogrammetry. Proc. ASPRS 2012 Annual Conf., Sacramento.
Luhmann, T., Hastedt, H., Tecklenburg, W., 2006. Modelling of Chromatic Aberration for High Precision Photogrammetry. Intl. Archives of Photogrammetry, Remote Sensing and Spatial Information Sciences, Vol. XXXVI, Part 5: 173-178.
MacDonald, L.W., Giacometti, A. Campagnolo, A., Robson, S., Terras, M. and Gibson, A., 2013. Multispectral Imaging of Degraded Parchment. Proc. Computational Color Imaging Workshop (CCIW), Chiba, Japan, March 2013. In Computational Color Imaging, ed S. Tominaga, Berlin: Springer, pp. 143-157.
Mallon, J. and Whelan P.F. 2007. Calibration and removal of lateral chromatic aberration in images. Pattern Recognition Letters, pp. 125-135.
Mark, R.‐P. 1993. The Carl Zeiss Jena Range of Photogrammetric Instruments. Photogrammetric Record 14(81):425 - 430.
Ogleby, C. L., Papadaki, H., Robson, S. and Shortis, M. R., 1999. Comparative camera calibrations of some "off the shelf" digital cameras suited to archaeological purposes. Intl. Archives of Photogrammetry and Remote Sensing, 32 (B5) pp. 69-75.
Ray, S., 2002. Applied Photographic Optics: Lenses and Optical Systems for Photography, Film, Video and Digital Imaging, Focal Press, pp. 112-121.
Shortis, M.R., Robson, S. and Short, T., 1996. Multiple focus calibration of a still video camera. Intl Archives of Photogrammetry and Remote Sensing, 31(5): 534-539.