ECOLOGICAL NICHE MODELING USING SATELLITE DATA FOR ASSESSING DISTRIBUTION OF THREATENED SPECIES CEROPEGIA BULBOSA ROXB.
Suresh Kumara*, Kulloli R. Na., J. C. Tewaria, J. P. Singha, Akath Singha aCentral Arid Zone Research Institute,
Jodhpur-342003, Rajasthan, India.
([email protected], [email protected], [email protected], [email protected], [email protected])
KEYWORDS: Ceropegia bulbosa, Density, Endemic, GIS, Remote sensing
ABSTRACT:
Ceropegia bulbosa Roxb. is a narrow endemic, tuberous twiner of Asclepiadaceae family. It is medicinally important: tubers are nutritive and edible, leaves are digestive and a cure for dysentery and diarrhea. Exploitation for its tubers and poor regeneration of this species has shrunk its distribution. In order to know its present status, we report here the results of its appraisal in Rajasthan, using remote sensing and ground truthing in the past five years (2009-14). A base map of C. bulbosa was prepared using Geographical Information System (GIS), open source software Quantum GIS, SAGA. The Landsat Enhanced Thematic Mapper (ETM) +Advanced Spaceborne Thermal Emission and Reflection Radiometer (ASTER), Global Digital Elevation Model (GDEM) Satellite Data were used in this study. ASTER and GDEM Data was clipped with district boundary and provided color range to get elevation information. A digital elevation model of Rajasthan physiography was developed from ASTER GDEM of 30-m resolution. GIS layers of Area of occurrences for C. bulbosa plant and elevation were created. This map along with topographic sheets of 1:50000 were used for field traversing and ground truthing as per GPS location inferred from map. Its geographic distribution was assessed using MaxEnt distribution modelling algorithm that employed 12 presence locality data, 19 bioclimatic variables, and elevation data. Results of this modelling predicted occurrence of C. bulbosa in the districts of Sirohi, Jalore, Barmer, Pali, Ajmer, Jhalawar, Dungarpur, Banswara, Baran, Kota, Bundi and Chittorgarh. Ground validation in these districts revealed its presence only at four places in three districts confirming its rarity. Analysis of dominance at their sites of occurrence revealed their poor populations and sub dominant status (RIV= 20-32) and very low density (2-12 plants per tenth ha).
*Corresponding author
1. Introduction
Prior knowledge of variety and variability in flora
and fauna is essential for planning any conservation
program (Lubchenco et al., 1991). This is essential in view
of immense economic, ethical and aesthetical benefits of
biodiversity besides its value in ecosystem function and
stability (Tilman, 2000). Though various aspects of
biodiversity are yet to be understood its accelerated loss is
widely agreed, especially by habitat loss and fragmentation
as well as by environmental degradation (Thomson et al.,
2007).It is in this context that modern tools of GIS may be
used to provide, handle and analyze spatial data sets needed
to understand and prioritize a range of conservation and
management tasks (Best et al., 2007).These tasks of
conservation activities can be carried out using satellite
data at a range of scales (Kiage et al., 2007).
Remotely sensed data in conjunction with
geographic information systems have been successfully
utilized to quantify biodiversity loss as well as its
fragmentation (Jha et al., 2005). Numerous mathematical
techniques have also been developed to predict the
geographical distribution of given species (Soberon &
Peterson, 2005). Combined with GIS tools, the models
generate maps of the habitats having similarity with those
housing a particular threatened species. Among such
models, MaxEnt (maximum entropy algorithm modeling
programme) has been widely used in recent studies (Elith et
al., 2006, Philips et al., 2006). Such attempts to map the
spatial distribution of threatened plants of India at a
sufficiently large scale with or without remote sensing are
few (Yang, 2013; Adhikari et al., 2012; Barik & Adhikari,
2011). We are not aware of any such study especially in
respect of threatened plants of arid zone of India. It is in
rupicolous, bulbous arid species was taken in this study. It
is medicinally important: tubers are nutritive and edible;
leaves are digestive and a cure for dysentery and diarrhea.
Its flowers are botanical marvels. Extraction of its tubers at
accelerated pace in past quarter century coupled with poor
regeneration has declined its density and shrunk its extent
so much so that it now stands threatened. Knowing its
extent and distribution shall inter-alia also help in locating
potential areas of its distribution. Hence an attempt has
been made here for Ecological Niche Modeling (ENM)
using satellite data to assess population status of C. bulbosa
in Rajasthan.
2. Methodology
2.1 Study Area
The study was carried out in Rajasthan state of India.
Average annual rainfall shows a gradient of 200 mm in
Jaisalmer in the west to 550 mm in Sirohi in the east.Rains
are erratic, uneven and variable across the year; coefficient
of variability being over 55%. Extremes of temperatures
like 50 oc in summer and -2 oc in winters results in hot winds and frosts, respectively. High wind speed (20-40
km/hr), high evapotranspiration (1500-2000 mm/ year),
poor soil fertility, low water retention capacity as well as
deep brackish ground water make plant survival and growth
very difficult (CAZRI, 2007). Consequently , arid
landscape has poor tree cover and dominance of sparsely
located shrubs. Some 6.4% of plant species of a total of 682
species in Indian arid zone are endemic. One such species
is Ceropegia bulbosa Roxb. of family Asclepiadaceae.
Occurrence records of C. bulbosa collected from previously
published research papers, floras and herbarium revealed its
reported occurrence on hilly areas in high rainfall
receiving, wetter margin of arid Rajasthan.
2.2 Satellite data
The Landsat ETM+ and ASTER GDEM Satellite Data
were used in this study. ERDAS Imagine 9.1 and Arc GIS
9.2 software were used for digital image processing and
spatial database handling respectively. Aster GDEM Data
with District boundary was clipped. A digital elevation
model of Rajasthan physiography was developed from
ASTER (Advanced Spaceborne Thermal Emission and
Reflection Radiometer) GDEM (Global Digital Elevation
Model) Data of 30-m resolution. GIS layers of area of
occurrences for Ceropegia plant and elevation were
created. This map along with Survey of India (S.O.I)
topographic sheets of 1:50000 were used for field
traversing and ground truthing as per GPS location.
Figure 1. Study area of Ceropegia bulbosa in Rajasthan.
2.3 MaxEnt model
MaxEnt is a general purpose model that assesses
environmental layers based on the training data location
and then selects the probability of occurrence of species in
the whole study area (Buehler & Ungar, 2001). It is based
on maximum entropy algorithm and can be downloaded
from the website:
http://www.cs.princeton.edu/~schapire/maxent/ (Phillips et
al., 2006). This was employed in the present study.
2.4 Environmental variables
Two types of environmental variables viz. bioclimatic
variables and elevation were used in this study (Table 1).
Nineteen bioclimatic variables (Hijmans et al., 2005) with 1
website (http://www.worldclim.org.). This has a set of
climate layers representing bioclimatic variables, derived
from monthly temperatures and rainfall recorded
worldwide (Graham & Hijmans, 2006). The
multicollinearity test was conducted by using Pearson
Correlation Coefficient to examine the cross-correlation.
The variables with cross- correlation coefficient value of
over 0.8 were excluded. Elevation (Digital Elevation
Model-DEM) data were also obtained from the WorldClim
website. All these variables are taken from mean value over
10 years from 2003 to 2013. Presence data of 12 sites was
used in modeling. The prediction year was 2013.
2.5 Modeling Procedure
C. bulbosa occurrence point data was divided into training
data (75% of occurrence point data used for model
prediction) and test data (25% occurrence point data used
for model validation). Then we evaluated the resulting
model with the Receiver Operating Curves (ROC)
calculating the area under curve (AUC). Higher AUC score
indicates better prediction by model regarding species
presence/absence. It also indicated those environmental
variables that are highly correlated with the predicted
distribution of species. The AUC values of 0.8-0.9 or
0.9-1.0 show good or excellent predictions respectively (Swets,
1988).
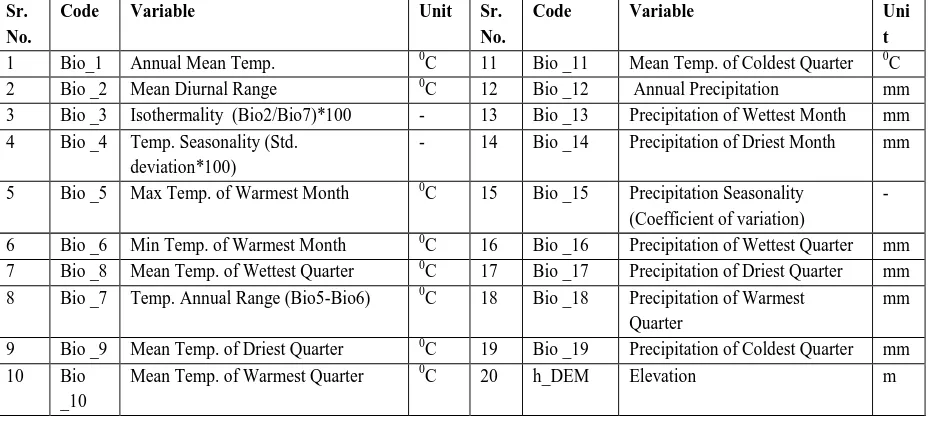
Table 1. List of Bioclimatic variables and elevation used in the model (Hijmans et al., 2005)
2.6 Field sampling and data analysis
Using locations inferred from DEM map, and
potential area predicted by model were visited for ground
truthing. Those having absence of Ceropegia were recorded
accordingly. Those sites having Ceropegia were sampled in
5 to 10 quadrats of 10 m X 10 m placed beside each other.
Presence and density of Ceropegia and all associated
species were recorded. The vegetation data were
quantitatively analyzed for frequency, density and
dominance and relativized following Misra (1968).
Dominant, co-dominant and main associate species based
on RIV (Relative Importance Value) were recognized
(Muller-Dombois & Ellenberg, 1974).
3. Results and Discussion
3.1 MaxEnt Modeling Analysis
Regions of occurrence of C. bulbosa predicted by MaxEnt
model are shown in figure 2. Statistical evaluation of the
MaxEnt model indicated that the model provided useful
prediction. The AUC was above 0.9 for all variables
indicating very high accuracy (Swets, 1988). The model
that included all variables had the highest AUC. Relatively
indication of the predictive power of the model. Finally,
MaxEnt tests the null hypothesis that the test points are
predicting no better than a random prediction using various
thresholds (Phillips et al. 2006). Further the MaxEnt model
also allows for performing an internal jack-knife test to
quantify the importance of the variables in influencing the
distribution of C. bulbosa (Fig. 3).
Figure 2. Predicted potential distribution of C. bulbosa in Rajasthan.
Figure 3. Results of Jackknife evaluations of relative importance of predictor variables for C. bulbosa Maxent model.
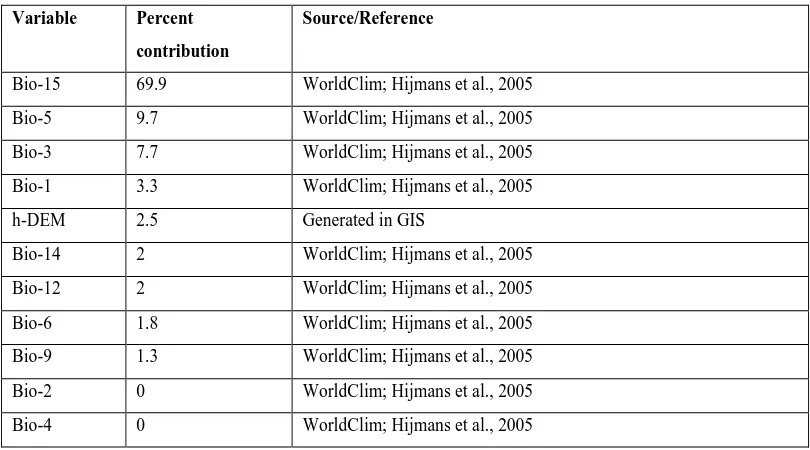
3.2 Contribution of the variables to the model
Variables like precipitation of wettest quarter (Bio-15),
maximum temperature of warmest month (Bio-5) and
Isothermality (Bio-3) contributed most to the model. Their
individual contribution was 69.9%, 9.7% and 3.3%
respectively. Elevation (h-DEM) has contributed only 2.5%
Variable Percent
contribution
Source/Reference
Bio-15 69.9 WorldClim; Hijmans et al., 2005
Bio-5 9.7 WorldClim; Hijmans et al., 2005
Bio-3 7.7 WorldClim; Hijmans et al., 2005
Bio-1 3.3 WorldClim; Hijmans et al., 2005
h-DEM 2.5 Generated in GIS
Bio-14 2 WorldClim; Hijmans et al., 2005
Bio-12 2 WorldClim; Hijmans et al., 2005
Bio-6 1.8 WorldClim; Hijmans et al., 2005
Bio-9 1.3 WorldClim; Hijmans et al., 2005
Bio-2 0 WorldClim; Hijmans et al., 2005
Bio-4 0 WorldClim; Hijmans et al., 2005
Table 2. Relative contribution of variables to the MaxEnt Model.
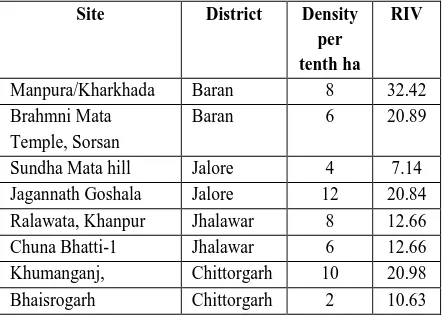
3.3 Ground truthing
A perusal of Fig 2 revealed that MaxEnt
modeling predicted occurrence of C. bulbosa in the districts
of Sirohi, Jalore, Barmer, Pali, Ajmer, Jhalawar,
Dungarpur, Banswara, Baran, Kota, Bundi and Chittorgarh.
Survey of predicted region revealed that it was not found in
eight out of twelve districts. Four districts recording its
presence are Jalore, Baran, Jhalawar and Chittorgarh,
wherein it was present at eight sites (Table 3). It occurred at
sites having altitude of 846 ft to 1849 m, thus preferring
hills. Its habitat had loamy soils. Most common associates
included Capparis decidua, Prosopis juliflora, Butea
monosperma, Anogeissus pendula, Ziziphus nummularia,
Capparis sepiaria, Acacia leucophloea, and Maytenus
emarginata. Its density was low, 2-12 plants per tenth ha
while ecologically it was subdominant at all sites (Table 3).
Of its earlier reported occurrences at Jhunjhunun and
Jodhpur it has not been found, mainly because of large
scale degradation of habitat due to mining, habitat
fragmentation and extraction of its bulbs. These are also the
reasons for its absence in other eight districts. Many
researchers using MaxEnt modeling have reported that
potential distribution areas predicted by model was almost
always overestimated compared to realized niche of the
species (Yang et al., 2013; Pearson, 2007; Murienne et al.,
2009; Kumar & Stohlgren, 2009). They ascribed it to the
fact that niche based presence data in MaxEnt modeling
results in predicting fundamental niche rather than realized
niche and hence its absence in many (eight districts) of the
predicted areas. Adverse anthropological factors stated
earlier have further contributed to limiting its spread and
distribution across districts; these insularised its
populations. C. bulbosahas been recorded up to ≈ 1850 ft
elevations indicating that it is narrowly endemic.
Irfan-Ullahet al., (2006), while mapping geographic distribution
of Agalia bourdillonii using ENM in Western Ghats also
concluded its narrowly endemic distribution that enabled
them to identify key zones for additional protection.
Narrowly endemic species have specific requirements
which often make them vulnerable due to narrow
ecological tolerances. That these environmental factors
such as climate, geology and soil affect vegetation indices
in time and space was also concluded by Soleimani et al.,
(2008). Precipitation of wettest quarter contributed
maximum (69.9%) to model prediction. Any decline in
precipitation due to climatic change will make C. bulbosa
increasingly vulnerable enhancing risk to its survival. Such
estimates however need to be refined with finer scale
climatic variables because bioclimatic variables based on
interpolations of global climatic data have coarse resolution
Site District Density per tenth ha
RIV
Manpura/Kharkhada Baran 8 32.42
Brahmni Mata
Khumanganj, Chittorgarh 10 20.98
Bhaisrogarh Chittorgarh 2 10.63
Table 3. Density and dominance of C. bulbosa found at different locations in Rajasthan.
Conclusion
It can be concluded that Maxent modeling has successfully predicted its occurrence even on the basis of limited data set. Precipitation of wettest quarter emerged as a major factor in determining the distribution of potential habitats of C. bulbosa in Rajasthan. Potential habitats of C. bulbosa are predicted in the districts of Baran, Jhalawar, Kota, Chittorgarh, Ajmer, Tonk and Sirohi, partially in Jalore, Sirohi, Nagaur and Karauli.
Acknowledgments
We are grateful to Director, CAZRI for providing
necessary facilities for this work. The authors thank
Department of Biotechnology, Govt. of India, New Delhi
for financial support. Also we would like to thank Prof. S.
K. Barik and Dr. Dibyendu Adhikari for necessary
guidance in carrying out Ecological Niche Modeling.
References
Abbitt, R.J.F., Scott, J.M., Wilcove, D.S. 2000. The geography of vulnerability: incorporating species geography and human development patters into conservation planning. Biological Conservation 96: 169-175.
Adhikari, D., Barik, S.K., Upadhaya, K. 2012. Habitat distribution modelling for reintroduction of Ilex khasiana Purk., a critically endangered tree species of northeastern India. Ecological Engineering40: 37-43.
Barik, S.K., Adhikari. D. 2011. Predicting geographic distribution of an invasive species Chromolaena odorata L (King) & H. E. Robins in Indian subcontinent under climate change scenarios.
In: Bhatt, J.R., Singh, J.S., Tripathi, R.S., Singh, S.P., Kohli, R.K. (Eds.), Invasive Alien Plants- An Ecological Appraisal for the Indian Subcontinent. CABI, Oxfordshire, UK.
Best, B.D., Halpin, P.N., Fujioka, E., Read, A.J., Qian, S.S., Hazen, L.J. and Schick, R.S. 2007: Geospatial web services within a scientific workflow: predicting marine mammal habitats in a dynamic environment. Ecological Informatics. 2: 210–23.
Buehler, E.C., Ungar, L.H. 2001. Maximum Entropy Methods for Biological Sequence Modeling. BIOKDD 60-64.
CAZRI. 2007. CAZRI Perspective Plan: Vision-2025. Central Arid Zone Research Institute, Jodhpur, p. 94.
Elith, J., Graham, C.H., Anderson, R.P., Dudik, M., Ferrier, S., Guisan, A., Hijmans, R.J., Huettmann, F., Leathwick, J.R., Lehmann, A., Li, J., Lohmann, L.G., Loiselle, B.A., Manion, G., Moritz, C., Nakamura, M., Nakazawa, Y., Overton, J.M., Peterson, A.T., Phillips, S.J., Richardson, K., Scachetti-Pereira, R., Schapire, R.E., Soberón, J., Williams, S.E., Wisz, M.S., Zimmermann, N.E. 2006. Novel methods improve prediction of species’ distributions from occurrence data. Ecography 29: 129–151.
Graham, C.H., Hijmans, R.J. 2006. A comparison of methods for mapping species ranges and species richness. Global Ecology and Biogeography 15: 578-587.
Hijmans, R.J., Cameron, S.E., Parra, J.L., Jones, P.G., Jarvis, A. 2005. A very high resolution interpolated climate surface for global land areas. Int. J. Climatol. 25:1965-2198.
Irfan-Ullah, M., Amarnath, G., Murthy, M.S.R., Peterson, A.T. 2006. Mapping the geographic distribution of Aglaia bourdillonii Gamble (Meliaceae), an endemic and threatened plant, using ecological niche modeling. Biodiversity Conservation. 16: 1917-1925.
Jha, C.S., Goparaju, L., Tripathi, A., Gharai, B., Raghubanshi, A.S., Singh, J.S. 2005. Forest fragmentation and its impact on species diversity: an analysis using remote sensing and GIS. Biodiversity and Conservation. 14: 1681-1698.
Kumar, S., Stohlgren, T.J. 2009. Maxent modeling for predicting suitable habitat for threatened and endangered tree Canacomyrica monticola in New Caledonia. J. Ecol.. Nat. Envoron. 1:94-98.
Lubchenco, J., A.M. Olson, L.B. Brubaker, S.R. Carpenter, M.M. Holland, S.P. Hubbell, S.A. Levin, J.A. Macmahon, P.A. Matson, J.M. Melillo, H.A. Mooney, C.H. Peterson, H.R. Pulliam, L.A. Real, P.J. Regal & P.G. Risser. 1991. The sustainable biosphere initiative: an ecological research agenda. Ecology 72: 371-412.
Misra, R. 1968. Ecology Work Book. pp. 235. Oxford and IBH Publishing Co., New Delhi.
Mueller-Dombois, D. Ellenberg, H. 1974. Aims and methods of vegetation ecology. pp. 525. John Wiley and Sons, New York.
Murienne, J., Gulbert, E., Grandcolas, P.. 2009. Species diversity in the New Caledonian endemic genera Cephalidiosus and Nobarnus Insecta: Heteroptera: Tingidae, an approach using phylogeny and species distribution modeling. Bot. J. Linn. Soc. 97:177-184.
Pearman, P.B., Penskar, M.R., Schools, E.H., Enander, H.D. 2000. Identifying potential indicators of conservation value using natural heritage occurrence data. Ecological Applications 16: 186-201.
Pearson, R.G. 2007. Species distribution modelling for conservation educators and practitioners. Synthesis. American Museum of Natural History. http://ncep.amnh.org
Phillips, S.J., Anderson, R.P., Schapire, R.E. 2006. Maximum entropy modeling of species geographic distributions. Ecological Modeling. 190: 231-259.
Singh, M. 2013. Predictive modelling of the distribution of two critically endangered Dipterocarp trees: Implications for conservation of riparian forests in Borneo. J. Ecol.Nat.Enviro. 5(9): 254-259.
Soberon, J., Peterson, A.T. 2005. Interpretation of models of fundamental ecological niches and species distributional areas. Biodi. Info. 2:1-10.
Soleimani, K., Kordsavadkooh. T., Muosavi, S.R. 2008. The effect of environmental factors on vegetation changes using GIS (Case Study: Cherat Catchment, Iran). World Applied Science Journal. 3: 95–100.
Swets, J.A. 1988. Measuring the accuracy of diagnostic systems. Science. 240:1285-1293.
Thomson, A.G., Manchester, S.J., Swetnam, R.D., Smith, G.M., Wadsworth, R.A., Tilman, D. 2000. Causes, consequences and ethics of biodiversity. Nature. 405: 208-211.