MORPHOLOGICAL FILLING OF DIGITAL ELEVATION MODELS
Thomas Krauß, Pablo d’Angelo
German Aerospace Center (DLR), Remote Sensing Technology Institute, D-82234 Weßling, Germany E-Mail: Thomas.Krauss@dlr.de
Commission I/4
KEY WORDS:VHR satellite data, stereo images, digital surface models, filling, morphology
ABSTRACT:
In this paper a new approach for a more detailed post processing and filling of digital elevation models (DEMs) in urban areas is presented. To reach the required specifications in a first step the errors in digital surface models (DSMs) generated by dense stereo algorithms are analyzed and methods for detection and classification of the different types of errors are implemented. Subsequently the classified erroneous areas are handled in separate manner to eliminate outliers and fill the DSM properly. The errors which can be detected in DSMs range from outliers – single pixels or small areas containing extremely high or low values – over noise from mismatches, single small holes to occlusions, where large areas are not visible in one of the images of the stereo pair. To validate the presented method artificial DSMs are generated and superimposed with all different kinds of described errors like noise (small holes cut in), outliers (small areas moved up/down), occlusions (larger areas beneath steep walls) and so on. The method is subsequently applied to the artificial DSMs and the resulting filled DSMs are compared to the original artificial DSMs without the introduced errors. Also the method is applied to stereo satellite generated DSMs from the ISPRS Comission 1 WG4 benchmark dataset and the results are checked with the also provided first pulse laser DSM data. Finally the results are discussed, strengths and weaknesses of the approach are shown and suggestions for application and optimization are given.
1 INTRODUCTION
Digital elevation models (DEMs) are often the base for applica-tions needing geospatial information. More and more also very high resolution DEMs in urban areas are needed for planning, monitoring and visualization. Beneath the acquisition of DEMs – which are mostly digital surface models (DSMs) – via laser scan-ning also the DSM generation from very high resolution (VHR) satellite stereo imagery becomes increasingly important, espe-cially in remote areas like developing countries.
Also new methods for the generation of dense high resolution DSMs from such imagery are becoming more mature and find their way from research to standard image processing software. These methods like graph based algorithms as maximum-flow/mi-nimum-cut or the DLR developed semi global matching (SGM) generate very dense DSMs from epipolar imagery in the same or-der of resolution as the input imagery (dAngelo et al., 2008). But these DSMs sometimes contain many errors, outliers, noise and holes, especially if just two viewing directions are available. To eliminate these errors and outliers the DSMs normally undergo some post processing steps in which the outliers are removed and holes get filled.
These post processing steps yield normally DSMs of a reduced resolution of about 1/3 to 1/10 of the original resolution. But es-pecially in urban areas and using satellites with ground sampling distances of about one meter an additional reduction of the reso-lution of the generated DSMs to about three to ten meters provide the user with DSMs too coarse for the possibility of detecting ob-jects of smaller size. Therefore an approach is needed for a more sophisticated post processing of the DSMs to preserve the reso-lution of the original imagery also for the resulting DSM. In the following we propose an approach for classification and distinct handling of different error types in DSMs. The modus operandi will be:
• analyzing the different types of errors
• classifying these errors
• deriving methods for different handling of errors • applying the methods to artificial imagery
• evaluating the results against the original, error free data • applying the methods to the Terrassa benchmark data • evaluating the results against existing ground truth 1.1 Preliminary work
Almost much work was done in post-processing of DSMs. Since the best quality DSMs are generated by laser scanning most of the approaches start with such LIDAR point clouds (see for an exhaustive literature list Gruen and Akca (2005)). But the errors in laser scanning data are nearly neglectible compared to errors originating from DSM generation methods operating on satellite stereo imagery. Such very high resolution (VHR) stereo images come with ground sampling distances (GSD) for the PAN chan-nel in the range from 0.5 m for WorldView I and II or GeoEye over the older QuickBird with 0.6 m to Ikonos with 0.8 to 1 m. The multispectral channels (blue, green, red and near infrared) possess four time the GSD, except for WorldView I which only has a PAN channel. Additionally WorldView II has four more multispectral channels: coastal (shorter wavelength than blue), yellow (between green and red), red-edge (between red and near infrared) and an additionally second near infrared channel ex-tending to longer wavelengths (WorldView II, 2011).
The first step is always the derivation of the digital surface model from the satellite stereo imagery. One of the best methods proofed in the last years for this job is the “semi global matching”. This method (Hirschm¨uller, 2005) is a so called “dense stereo match-ing” method in contrast to the classical methods.
Classical methods as implemented still in most commercial soft-ware packages search characteristic (interest) points in both im-ages by image correlation for creation of a sparse object point cloud by forward intersection using the sensor model (Lehner and Gill, 1992). Different region growing methods (Otto and Chau, International Archives of the Photogrammetry, Remote Sensing and Spatial Information Sciences, Volume XXXVIII-4/W19, 2011
Figure 1: Typical errors occuring in DSMs from dense stereo (left: DSM, right: ortho image, units in meters, urban area near the Akropolis in Athens): 1: warp errors (single 1-pixel-holes), 2: occlusions, 3: court yards, 4: narrow roads, 5: too homogeneous surface, 6: moving traffic, 7: forest
1989) starting at the interest points try to generate a more dense point cloud.
In contrast the dense stereo algorithms originating from computer vision try to correlate each point in the stereo pair (Scharstein and Szeliski, 2002; Hirschm¨uller, 2005; Krauß et al., 2005; dAngelo et al., 2008). For this the images first have to be transformed to epipolar images for correlating these line by line and pixel by pixel. The result is a disparity map fitting exactly on one of the epipolar images containing the distance of each pixel to its com-panion pixel in the other stereo image in epipolar direction. A DSM generated with the classical method is so a relatively sparse point cloud whereas a DSM generated using a dense stereo algorithm has only a few holes but also blunders and other types of errors where the dense correlation fails. The generated DSMs from such VHR satellite stereo images deliver so either a rather good DSM of relative coarse resolution of about 1/3 to 1/10 of the original ground sampling distance (Lehner et al., 2007) or a high resolution DSM with many mismatches and blunders (Xu et al., 2008).
Methods for refining and correcting the DSM data are often based for example on statistical approaches (Vincent, 1993) or on DSM segmentation and extraction of rectangular buildings (Arefi et al., 2009). Haala et al. (1998) proposed a method reconstruct-ing buildreconstruct-ing rooftops usreconstruct-ing surface normals extracted from DSM data. They assumed that building boundaries are detected previ-ously. But most of these methods work only with high resolution and reliable LIDAR DSMs which in general do not suffer from noise, outliers and smoothing effects like stereographic generated DSMs (Schickler and Thorpe, 2001). Also the reconstruction of 3D building structures by hierarchical fitting of minimum bound-ary rectangles (MBR) and RANSAC based algorithms for line
or surface reconstruction are quite common (Arefi et al., 2008). An other approach fusioning the original imagery with the in-termediate generated disparity map of dense stereo methods was proposed by Krauß and Reinartz (2010).
In this paper we propose a much simpler approach by classifying different types of typical DSM errors introduced by dense stereo methods and handling these errors individually. We rely on the stereo method for already detecting erroneous areas and mark-ing them as background for example in occcluded areas or for removing outliers.
1.2 Typical errors occuring in DSMs from dense stereo meth-ods
Fig. 1 shows typical errors occuring in DSMs generated by opti-cal dense stereo methods like SGM (semi global matching). The figure contains a DSM of a small urban part near the Akropolis in Athens on the left side and the corresponding ortho image on the right side. The DSM generation was based on an Ikonos stereo pair (Summer 2004) with a ground sampling distance of one me-ter. The typical errors (black areas in the DSM) can be classified as follows:
1. “warp errors” are small, normally only one pixel holes origi-nating from small scale differences in the two stereo images which lead to errors in forward-bacckward-correlation 2. “occlusions” occur at areas which are not visible
3. “court yards” are also a type of occlusion, but are surrounded on all sides with high DSM values not corresponding to the real height of the yard
4. “narrow roads” are a third type of occlusion, surrounded mostly by high DSM values but also single lower values at connecting roads or places
5. “too homogeneous surface” also results in forward-backward-matching errors due to non existing “glue dots” for correct correlation, these areas are hardly to ditinguish from court yards in the DSM
6. “moving traffic” between the two images of the stereo pair causes also mismatches and typical holes on streets 7. “forest” looks mostly very different if the stereo pair is
ac-quired with large stereo angles (unfortunately the standard configuration for most satellite operators) and leads also of-ten to holes in the DSM
For eliminating these errors we propose the following approaches:
1. “warp errors”: detect small holes and fill simply by taking the median of the surrounding DSM
2. “occlusions”: may be filled by the ground value nearby 3. “court yards”: should also be filled by a ground value of this
area
4. “narrow roads”: should also gain ground values connecting correctly at the ends to other roads
5. “too homogeneous surface”: should be interpolated from the boundaries
6. “moving traffic”: can be replaced by the surrounding road values, also interpolation from the boundaries
7. “forest”: may be handled best by simple interpolation since too much mismatches from the crown areas mix with real occlusions
Following this scheme we have to detect following classes for different handling:
• small holes about 1–2 pixels: median filling from neigh-bours
• court yards, streets, occlusions: filling from ground • homogeneous areas, traffic, forest: interpolating
The classification of the first one will be no problem. But separat-ing for example homogeneous areas on roofs (5) from real court yards (3) may become very tricky.
2 BASIC CONSIDERATIONS
2.1 Digital terrain model – DTM
Since we want to fill some erroneous areas from the ground like court yards or occlusions we need first to extract a digital terrain model (DTM) representing the ground without any elevated ob-jects like buildings or trees. For this we try three different meth-ods as described in Krauß et al. (2011):
• The Classical morphological approach (Weidner and F¨orstner, 1995)
• Geodesic dilation (Arefi et al., 2007)
• Steep edge detection (Krauß and Reinartz, 2010)
For synthetic urban DSMs the third method performs best, but for real DSMs like the benchmark data, the first two algorithms are more suitable. So a fusion of the three methods as proposed in Krauß et al. (2011) will be used for generating the DTMs and subsequent filling the detected ground areas.
2.2 Generation of synthetic DSMs
For the generation of synthetical DSMs we need a special method for joining a DTM (the ground) with some objects like buildings (represented by a so called normalized digital elevation model, nDEM) to the DSM we have to analyze with our proposed method. Normally for the nDEM simply holdsnDEM =DSM−DT M which does not work for DTMs changing significantly over the size of a building. If we use the inverseDSM = DT M +
nDEM to generate the synthetical DSMs we will gain houses with roofs reflecting the ground variations (fig. 2, left).
Figure 2: Synthetically generated DSM composed from urban blocks (nDEM) and a rolling ground (DTM) – left: simple DTM+nDEM, right: correctly added nDEM to min(DTM) in each building area
Therefore we need to use an object based ground detection to detect the lowest point in the footprint of a nDEM objectiand remove this minimum value as constant DTM from the whole objecti(Krauß et al., 2011):
nDEMi=DSM−min i DT Mi
The objectsiare now put on these locally flattenedDT Miparts, to generate the correct DSM.
2.3 Synthetic DSMs
For the tests on synthetic DSMs we first generate a DTMsin(x)·
sin(y)with one period per512×512image and heights of 2 to 21 m. All images simulate Ikonos-image generated DSMs with a GSD of 1 m. Also three types of nDEMs are generated:
• buildings as rectangular blocks of 32 m×32 m with a height of 20 m
• industry buildings as rectangular blocks of 112 m×112 m with a height of 20 m
• urban blocks consisting of5×7alternating blocks of 16 m ×16 m with heights of 20, 25 and 30 m
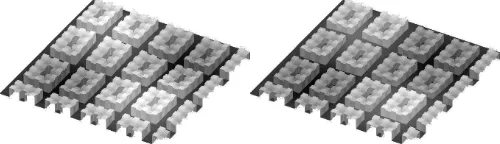
Figure 3: Synthetical DSMs, top: 3D view, bottom DSM; left: rectangular buildings (32 m), center: industry buildings (112 m), right: urban blocks (80 m×112 m, each block 16 m); all streets between buildings 32 m
In fig. 3 the nDEMs combined with the DTM using the method described in 2.2 are shown.
2.4 Generating synthetic occlusions
Occlusions occur in areas of a DSM which are not visible in one of the images of the stereo pair. To simulate occlusions with the synthetic images the azimuth and elevation for the two ste-reo image acquisitions are set to typical values of 20◦and 60◦
for the first (northern) and 200◦and 60◦for the second (southern
view) stereo image respectively. For each of the views a raytrac-ing method gives the areas occluded by higher areas in the DSM. Joining the two occlusion masks give the occlusion for the whole DSM as shown in fig. 4. The occlusions originating from an el-evation angle of 45◦from houses of 20 m height meet often not
in the 32-m-streets because the height of the houses is measured from the lowest point of the DTM as described in 2.2 and so the wall at the street is normally much lower than 20 m (see also fig. 5).
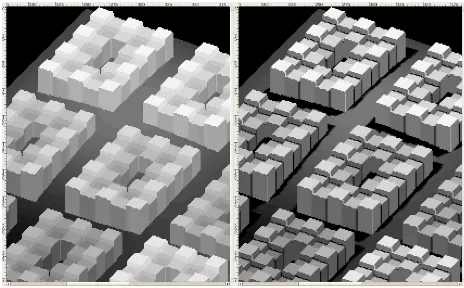
Figure 4: Synthetical DSMs with occlusions, top: occlusions at elevation 60◦, bottom: occlusions at elevation 45◦
Figure 5: Synthetical DSMs, detail of occluded urban area DSM in 3D view, left DSM, right DSM with occlusions (elevation 60◦)
2.5 Generating other DSM errors
Other errors like warp errors are additionally added to the oc-cluded DSMs using randomly distributed background values. Fig. 6 shows occluded images with increasing hole probabilities. Holes are set to “no value” (background) if a random variablerndfor a pixel holdsrnd > phwith the hole probabilityph(all values in percent ranging from 0 to 100).
3 METHOD
3.1 Classification of Errors
The typical errors are classified as followed:
Figure 6: Synthetical DSMs, occluded (elevation 60◦), increasing
hole probability 10 %, 20 %, 40 %, 80 % (l.t.r.),
• “small holes” with sizes of about 1–2 pixels are masked by generating a mask of non-background, do a morphological closing on this mask using a structuring element of radius one and afterwards subtracting the original non-background mask from the one-pixel-closed mask
• “occlusions” will be classified as larger background areas in the DSM containing border values with larger height vari-ances, typically larger lower and higher parts
• “homogeneous areas” on roof-tops may be found in larger background areas with small variances in the height of bor-der pixels
• “small court yards” and “small streets” may not have any connection on the border to any lower DSM area. So they will appear like the previous homogeneous areas. Such ar-eas may only be detected using also the ortho image and looking on the homogeneity of the occluded/homogeneous area.
• “traffic”: “homogeneous areas” and “court yards” show small height variances on the border heights but all well above any ground whereas ground-stuck objects like traffic will have also small height variances on the border but at ground level • “forest” and “homogeneous grass land” may be detected also using the multispectral ortho image by calculating the N DV I(normalized difference vegetation index, defined as
(n−r)/(n+r)using the red and near-infrared channelsr andn). AN DV I > tvwithtv≈0.1shows vivid vegeta-tion.
• “water” may be detected addionally by also using theN DV I but withN DV I <−twwithtw≈0.1
The last two classifications will work neither with the synthetic generated DSMs nor with the Terrassa test data from the ISPRS benchmarking dataset since for both no multispectral imagery was available.
3.2 Handling of Errors
These classified areas should be handled in different manners:
• “small holes” will simply get filled by applying a median with a radius of 1 and filling only the masked pixels • “occlusions” may be filled by the lowest values of the
sur-rounding border values
• “homogeneous areas” get simply interpolated from the bor-der using the inverse distance weighted interpolation (IDW) • “small court yards” and “small streets” in contrast should be
filled from the derived DTM
• “traffic” will also be simply filled from the surrounding DTM • “forest” and “homogeneous grass land” will be interpolated
using IDW
Before filling areas with ground (DTM) values the DTM has to be extracted. But for applying the DTM extraction methods already a filled DSM will be needed. For this purpose we choose to fill the small holes as described above and the large holes using the lowest value of the border height.
4 APPLICATION TO SYNTHETIC DSMS
Figure 7: Occluded urban DSM with 40 % holes (left) and hole mask
From the synthetic DSMs shown in fig. 3 in a first step different levels of occluded and error containing versions like the examples in fig. 6 are generated (see fig. 7). Afterwards the DSM correction algorithm described in 3 – not using the NDVI part due to missing multispectral imagery – and a standard inverse distance weighted interpolation (IDW) is applied as shown in fig. 8.
Figure 8: Filled DSM with described approach (left), reference (center), and DSM filled with inverse distance weighted interpo-lation (right)
The resulting filled DSMs are compared to the original DSMs from fig. 8, center – checking only the values in the erroneous areas (using the mask generated directlly from the DSM in fig. 7).
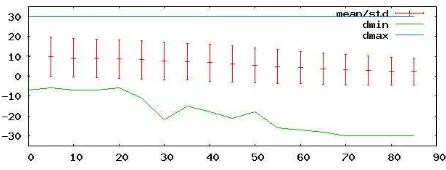
Figure 9: Statistics of errors using described approach on syn-thetical urban DSMs, occluded (elevation 60◦) with increasing
hole probability from 0 % to 85 %, minimum (green), maximum (blue) deviation and mean and standard deviation (red) to original reference DSM
The results plotted against the hole probability of the input DSM are shown in fig. 9 for the proposed method and in fig. 10 for the inverse distance weighted interpolation. The difference is calcu-lated asDSMcalc−DSMref. So values greater than zero denote areas in which the filled DSM is higher than the reference. As can be seen in fig. 9 the method breaks above about 60 % hole probability due to too large connected erroneous areas. But the mean offset of the filled DSM compared to the reference DSM stays nearly at zero with an increasing standard deviation at in-creasing error sizes.
Figure 10: Statistics of errors using inverse distance weighted in-terpolation on synthetical urban DSMs, occluded (elevation 60◦)
with increasing hole probability from 0 % to 85 %, minimum (green), maximum (blue) deviation and mean and standard devi-ation (red) to original reference DSM
The mean offset of the simple fill as shown in fig. 10 keeps al-ways high with high error but the method delivers in contrast to the proposed method also reasonable results with extremely sparse DSMs. This is due to the simple interpolation of occlu-sions which should be at ground level but are raising from ground to the height of the building in the interpolated DSM.
5 APPLICATION TO TEST DATA
The test data consists of a WorldView-I stereo image pair of the test area “Terrassa” from the ISPRS-benchmarking dataset of Com-mission I, working group 4 (http://www.commission1.isprs. org/wg4/) as shown in fig. 11.
Figure 11: Overview on the Terrassa testsite, 4 km×4 km, cen-ter at 2◦1.99’E, 41◦34.64’N, left DSM (ranging from 210 m to
390 m), right ortho image
Fig. 12 shows a 3D view of the area (north to the top right) and a 1 km×1 km detail view starting at top, 1 km from the left of fig. 11.
Figure 12: Overview on the Terrassa testsite, 3D views, left full 4 km×4 km, right detail 1 km×1 km
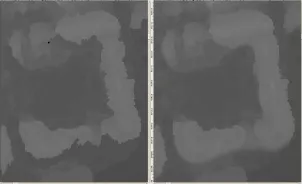
Fig. 13 shows the ortho image and the reference laser DSM from a 1 km×1 km detail of the benchmarking test site. Fig. 14 shows the DSM and the occlusion mask whereas fig. 15 shows the filled DSMs using the proposed method and a simple inverse distance weighted interpolation respectively.
Figure 13: Detail of Terrassa testsite 1 km×1 km, left ortho image, right reference laser DSM points
For the ISPRS benchmarking test also a reference laser DSM was provided by the ICC (Institut Cartogr`afic de Catalunya,http:// www.icc.cat/) which can be used for evaluation of the filling of the DSMs. First the DSM generated by the semi global matching algorithm is filtered for the small holes as described above and the remaining large holes are masked as shown in fig. 14.
Figure 14: Detail of Terrassa testsite 1 km×1 km, left DSM with small holes filled, right occlusion mask
These remaining large holes are subsequently classified to the classes given in 3.1. The classified erroneous areas are then filled following the steps described in 3.2 without the classifications needing the NDVI. This restriction is necessary since the base im-agery used for the DSM generation are WorldView-I stereo data with only one PAN channel and no additional multispectral in-formation. The DSM filled following these method is shown in fig. 15, left, whereas a simple inverse distance weighted interpo-lation is shown in the same figure on the right hand side.
Figure 15: Detail of Terrassa testsite 1 km×1 km, left DSM filled with proposed method, right DSM filled using inverse dis-tance weighted interpolation
Figs. 16 and 17 show the variation of the same statistical parame-ters as used already with the synthetical DSMs in fig. 9 but for different areas of the whole Terrassa test area. Since the test area contains much urban structured areas in the north contin-ually changing to completely mountainous forestry area in the south (cf. fig. 11) the statistics is calculated for horizontal strips
of a height of 200 m and plotted starting with the topmost strip (mostly urban area) on the left and ranging to the southernmost strip (nearly complete moutaineous and forest area) on the right hand side.
Figure 16: Statistics of whole Terrassa area from north (left) to south (right) for proposed method
The statistics shown in fig. 16 shows the mean, standard devi-ation and the maximum and minimum devidevi-ations of the filled DSM vs. the reference DSM from north (left) to south (right). As can be seen is the mean in contrast to the experiments using synthetical DSMs generally significantly below zero. The calcu-latedDSMf illed−DSMrefmeans that the filled DSM is below the reference laser points. In contrast the statistics for the simple IDW filled DSM in fig. 17 shows much better mean values around zero. But in this case the higher standard deviation and also much more outliers for the minimum and maximum deviations can be found.
Figure 17: Statistics of whole Terrassa area from north (left) to south (right) for idw
In the left part of fig. 16 (top edge of the DSM until about 1.2 km from the top) there exist outliers with about 20 m too high and about 60 m too low filled DSM. This and the much worse mean values in comparison to the synthetical DSMs can be explained with an additional type of DSM error which was not modeled as shown in fig. 18.
Figure 18: Detail of filled DSM (left) and IDW interpolated DSM (right)
distance in meters to the top left corner of the DSM). Here can be seen, that in the bottom wing of the building a large part of the southern edge of the building was missing in the DSM. So the detected occlusion is only half a real occlusion but also half occupying a missing part of the building. Simple interpolation is therefore more appropriate to fill half building and half ground (which delivers in best case a mean of zero if both parts of the oc-clusion are of the same size) than only filling with ground values (which gives for half of the occlusion a too low value and there-fore a negative mean). Such kinds of errors should be modeled and handled additionally in future to gain better results.
But compared over all the proposed method also works better for the test site data in most regions.
6 DISCUSSION
Filling missing parts in DSMs generated from very high reso-lution satellite stereo imagery should be done depending on the different types of errors. For this the errors in the generated DSM has to be classified and handled individually. Using individual handling of different classes of errors yield significantly better results compared to a given reference than only interpolating the DSMs.
Also the approach simulating DSMs and afterward incorporating them with different types of errors is a convincing approach. In this case always a perfect reference remains and it can be tried to restore the error loaded DSM using different methods. Compar-ing the results to the original synthetical DSM varyCompar-ing the sim-ulated errors will give more insight to the behaviour of the algo-rithms implemented. But the method used for simulating errors in the perfect synthetical DSM has to be choosen carefully and also the types of errors which may occur have to be understood and analyzed previously in detail.
One of the main challenges is the detection of court yards with no detected ground points inside. Such a situation can be seen in fig. 1 e.g. between numbers 2 and 4, but fortunately not occurs in the test datasets. These areas should be filled from the DTM with values outside of the building whereas homogeneous areas or roof structures should only be interpolated.
Court yards show in general much more texture than homoge-neous roof structures. These two can be discriminated by using some kind of structure parameter like a thresholded standard de-viation of the ortho image inside the occlusion. But more often in real DSMs also strongly textured roof structures may lead to occlusions which are nearly not distinguishable from court yard structures.
One possible solution may be the usage of the occlusion algo-rithm described in 2.4 for the generation of synthetic DSMs. This algorithm can also be used with the sun azimuth and elevation to generate synthetic shadows. In an iterative method occluded ar-eas may be segmented to shadowed and non shadowed parts and shadows for these segments simulated using different heights of the occluded segments. By afterward comparing the simulated shadow with the shadow of the ortho image the correct height may be extracted. But if the ortho image was generated using a wrong DSM there will be distortions that will also lead to wrong results.
7 CONCLUSION AND OUTLOOK
Digital surface models (DSMs) generated from very high reso-lution (VHR) satellite stereo imagery with ground sampling dis-tances (GSD) of about one meter using dense stereo methods like
the semiglobal matching (SGM) contain different classes of er-rors. In the presented approach these errors are analyzed and classified. Afterwards different classes of errors are handled in special manners to generate a “best of” filled DSM. Using syn-thetical generated DSMs with a broad range of different errors allow the analysis of the performance of the algorithm. These analysis shows that the method is only usable for relatively dense DSMs with noise generated holes below 60 % of the area and single larger occluded areas.
In conclusion we can state that a detection and classification of different types of errors in DSMs and the individual handling of each type of error gains much better results than only using one method for filling DSMs.
In the future the classification of court yards to fill from DTM areas outside the building and the detection of small roads has to be implemented and also better approaches for the generation of DTMs from noisy DSMs has to be analyzed.
References
Arefi, H., dAngelo, P., Mayer, H. and Reinartz, P., 2009. Auto-matic generation of digital terrain models from cartosat-1 ste-reo images.
Arefi, H., Engels, J., Hahn, M. and Mayer, H., 2007. Automatic DTM generation from laser-scanning data in residential hilly area.
Arefi, H., Engels, J., Hahn, M. and Mayer, H., 2008. Levels of de-tail in 3d building reconstruction from lidar data. Proceedings of the International Archieves if the Photogrammetry, Remote Sensing, and Spatial Information Sciences 37, pp. 485–490. dAngelo, P., Lehner, M., Krauß, T., Hoja, D. and Reinartz, P.,
2008. Towards automated dem generation from high resolution stereo satellite images. Vol. 37, pp. 1137–1142.
Gruen, A. and Akca, D., 2005. Least squares 3D surface and curve matching. ISPRS Journal of Photogrammetry and Re-mote Sensing 59, pp. 151–174.
Haala, N., Brenner, C. and Anders, K., 1998. 3d urban gis from laser altimeter and 2d map data. Proceedings of International Archives of Photogrammetry, Remote Sensing, and Spatial In-formation Sciences 32, pp. 339–346.
Hirschm¨uller, H., 2005. Accurate and efficient stereo process-ing by semi-global matchprocess-ing and mutual information. In: IEEE Conference on Computer Vision and Pattern Recogni-tion (CVPR).
Krauß, T. and Reinartz, P., 2010. Urban object detection using a fusion approach of dense urban digital surface models and VHR optical satellite stereo data. In: ISPRS Istanbul Work-shop 2010, WG I/4 Modeling of optical airborne and space borne sensors, Vol. 39.
Krauß, T., Arefi, H. and Reinartz, P., 2011. Evaluation of se-lected methods for extracting digital terrain models from satel-lite born digital surface models in urban areas. In: Interna-tional Conference on Sensors and Models in Photogrammetry and Remote Sensing (SMPR 2011).
Krauß, T., Reinartz, P., Lehner, M., Schroeder, M. and Stilla, U., 2005. Dem generation from very high resolution stereo satel-lite data in urban areas using dynamic programming. In: IS-PRS Workshop, Hannover, Vol. 36 (1/W3).
Lehner, M. and Gill, R., 1992. Semi-automatic derivation of digi-tal elevation models from stereoscopic 3-line scanner data. IS-PRS 29 (B4), pp. 68–75.
Lehner, M., M¨uller, R. and Reinartz, P., 2007. Stereo evaluation of cartosat-1 data for various test sites.
Otto, G. and Chau, T., 1989. Region growing algorithm for matching of terrain images. Image and vision computing (7) 2, pp. 83–94.
Scharstein, D. and Szeliski, R., 2002. A taxonomy and evaluation of dense two-frame stereo correspondence algorithms. Interna-tional Journal of Computer Vision (IJCV) 47(1/2/3), pp. 7–42. Schickler, W. and Thorpe, A., 2001. Surface estimation based on
LIDAR. Proceedings of the ASPRS.
Vincent, L., 1993. Morphological grayscale reconstruction in im-age analysis: applications and efficient algorithms. IEEE Trans Image Process. 1993(2(2)), pp. 176–201.
Weidner, U. and F¨orstner, W., 1995. Towards automatic build-ing extraction from high resolution digital elevation models. ISPRS 50 (4), pp. 38–49.
WorldView II, 2011. http://www.satimagingcorp.com/satellite-sensors/worldview-2.html. (accessed 4/2011).