Short communication
The impact of forest structure on near-ground temperatures
during two years of contrasting temperature extremes
Brian E. Potter
a,∗, Ronald M. Teclaw
b, John C. Zasada
caUSDA Forest Service, North Central Research Station, 1407 S. Harrison Rd, Suite 220, East Lansing, MI 48823, USA bUSDA Forest Service, North Central Research Station, 5985 Highway K, Rhinelander, Wisconsin 54501, USA cUSDA Forest Service, North Central Research Station, 1831 Highway 169 E., Grand Rapids, MN 55744, USA
Received 14 March 2000; received in revised form 10 September 2000; accepted 15 September 2000
Abstract
The thermal environment of clear-cut, partially cut, and uncut forest sites in northern Wisconsin are examined for a warm year and a cool year. Temperatures at 0.5 m above and 0.05 m below ground, as well as base 5◦C heat sums are computed
for each site between May and September and differences between cut and uncut sites compared for the 2 years. Differences in average and minimum air temperature and soil temperature are less than instrumental error,ε =0.3◦C. Maximum air
temperature differences between the clear-cut and uncut sites drop from 5.7◦C in the cool year to 4.7◦C in the warm year,
while the difference for the partial cut drops from 3.2 to 2.7◦C. The results suggest that studies of tree growth or forest
development and climate change should consider the effects of forest structure on changes in daily extreme temperatures. Published by Elsevier Science B.V.
Keywords:Forest structure; Cut and uncut sites; Microclimate factors
1. Introduction
Development of silvicultural systems requires knowledge of the effects proposed treatments have on microclimate factors, which in turn determine the ability of the forest to reach a desired future condition. The effects of silvicultural treatment are immediate and their duration depends on the magnitude of the disturbance due to the treatment and the resulting for-est structure, the rate of development of the forfor-est, and weather conditions following the treatment. Because prolonged extreme weather conditions can determine
∗Corresponding author. Fax:+1-517-355-5121. E-mail addresses:[email protected] (B.E. Potter),
[email protected] (R.M. Teclaw), [email protected] (J.C. Zasada).
whether a particular tree species flourishes or per-ishes, the effects of such extremes are of fundamental importance to forestry. A decade of locally “normal” weather will do less to favor one species over another than will one season of extreme conditions.
The effects of forest vegetation on sub-canopy cli-mate have been extensively studied (Kittredge, 1948; Geiger, 1965; Calvert et al., 1982; Liechty et al., 1992; Morecroft et al., 1998; Aussenac, 2000). These studies have examined the effects of forest cover on microcli-mate under “normal” regional climatic conditions, or made no mention of the larger climatic context during the study period. There has been little or no work done on how an unusually hot or cold growing season might affect the differences in temperature between clear or partially cleared sites and unmanaged forest sites.
We examine the effect of one extremely cool grow-ing season (1996) and one extremely warm growgrow-ing season (1995) on the temperature and heat sum differ-ences between a clear-cut and uncut site, and between a partially cut and an uncut site. We define grow-ing season as the months of May through Septem-ber, inclusive. Our analysis considers air temperatures 0.5 m above ground and soil temperatures 0.05 m be-low ground; these are generally representative of the environment for regenerating hardwood species dur-ing the critical period of seedldur-ing establishment.
2. Background and methods
The study arose from a long-term monitoring project at the Willow Springs Ecosystems Process Site, on the Chequamegon National Forest (45◦56′ North, 90◦27′ West). Topography is gently sloping (0 to 5%) and the soil is a moderately well drained, sandy loam. The site was established in 1988 and includes three squares, adjacent 8 ha blocks. One block was uncut and maintained as a control with a fully closed canopy, one (“halfcut”) was thinned to 50% crown cover, and a third block was clear-cut. Basal areas in the three sites were 32.4, 17.0, and 0.0 m2ha−1, respectively. The clear-cut and halfcut
sites both contained significant near-ground vege-tation during the 1995–1996 study period. In the clear-cut, regenerating aspen (Populus spp.) suckers and raspberry canes (Rubus spp.) had grown to a height of 1–1.5 m. In the halfcut, raspberry and other understory vegetation form a layer about 1.5 m thick over most of the ground. The control site is free of understory vegetation taller than 0.1 m.
Air and soil temperatures, Ta and Ts (or just T
when applied to both), were monitored in the center of each block using copper/constantan thermocouples (with a Campbell Scientific T107 temperature probe for reference temperature) at 0.5 m above ground and 0.05 m below ground. We positioned soil thermocou-ples by augering a 0.15 m hole, then inserting them into the side of the hole in undisturbed soil about 2–3 cm from the edge of the hole. After the thermocou-ples were in place, we refilled the hole with soil and replaced the forest floor. Horizontal plates shielded the Ta thermocouples, as described in Pearcy et al.
(1989).
The estimated sensor error, ε, is approximately 0.3◦C. We replicated the thermocouple measurements three times within each block, with each thermocou-ple randomly located at least 10 m from the others. Thermocouples were scanned every 5 min and average conditions recorded hourly. Average daily T calculated from these data was recorded daily on Campbell CR-10 data loggers, along with instanta-neous minimum and maximumTfor the day.
As long as one or more thermocouples at a given site and hour were operational, we computed an aver-ageTfor that site and hour. If there were any missing data for a given site/hour, then we did not compute a S.D. (σ) for that site/hour. In cases where T data were missing for all replicates at one site and hour, we eliminated that time for all three sites. This pre-vented a hot or cold spell from biasing one site while another had missing data. When computing base 5◦C heat sums,H, from hourly data, we multiplied the cal-culatedHfor months with missing data by the ratio of the number of hours in the month to the number of hours available in the record. This was done because heat sums are cumulative and directly comparing a given month between years when 1 year had missing data would be inappropriate. There is no instrumental error forH, so we computed an effective error based on the thermocouple error. Since His cumulative, a sensor with a systematic errorε=0.3◦
C will yield a maximum growing season error of about 46 gdd.
We examine differences between the sites and com-pare these differences for the two study years. All intersite comparisons that follow involve either the clear-cut and control sites, or else the halfcut and con-trol sites. For brevity, we use the symbol∆to indi-cate these differences;∆follows the term “clear-cut” or “halfcut” as appropriate, and has a subscript to in-dicate the particular quantity under consideration. For example, “clear-cut∆a mean” refers to the difference in mean air temperature between the clear-cut and con-trol sites. All differences result from subtraction of a control-site value from a treated-site value.
3. Climate context
in Rhinelander averaged 1.1◦C warmer than the cli-mate normal. This was largely due to a severe heat wave that gripped the upper Midwest in mid-July, causing numerous fatalities in Chicago and other midwestern cities. Karl and Knight (1997) found that during this heat wave, nocturnal temperatures did not drop to their usual lows, and thus the diurnal temperature range was reduced.
For the 1996 growing season, average temperatures in Rhinelander were 0.4◦C lower than the climate nor-mal, or 1.5◦C colder than in 1995. To test the signif-icance of this difference, we sampled daily average temperature from each year’s growing season at 5-day intervals to account for autocorrelation (Madden and Shea, 1978) and applied the Smirnov test. This com-parison showed that these 2 years are significantly dif-ferent at theα=0.05 level.
Rhinelander precipitation in the two growing sea-sons was close to the climate normal of 48.3 cm. In 1995, there were 47.2 cm and in 1996 there were 42.9 cm. Applying the Smirnov test to weekly precip-itation totals for the two seasons indicates that they are not significantly different at theα=0.05 level.
4. Results
In the cool year, control site average, maximum, and minimum temperatures were 14.5, 19.9 and 10.0◦
C, respectively. In the warm year, these parameters rose to 15.4, 21.1, and 10.8◦
C, respectively. Before looking
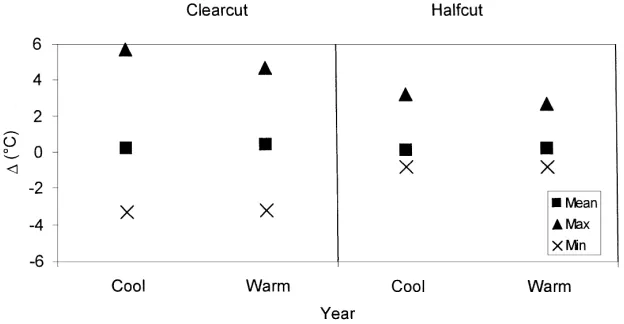
Fig. 1. Air temperature differences (mean, maximum, and minimum) between clear-cut or halfcut and control site for cool and warm years. Table 1
Differences in May through September growing season temperature parameters between cut sites (clear-cut or halfcut) and the uncut control site for cool (1996) and warm (1995) years
Clear-cut Halfcut
Cool Warm Cool Warm
∆a max (◦C) 5.7 4.7 3.2 2.7
∆a min(◦C) −3.3 −3.2 −0.8 −0.8
∆a mean (◦C) 0.2 0.4 0.1 0.2
∆aH (gdd) 48 75 11 22
∆s max (◦C) 0.4 0.6 0.5 0.3
∆s min(◦C) 0.4 0.3 0.2 0.2
∆s mean (◦C) 0.4 0.4 0.4 0.2
∆sH (gdd) 58 61 53 31
at differences between sites in the 2 years, we first tested the clear-cut daily average and daily extreme temperatures for significant differences between the years, as we had done with the Rhinelander data. The results showed no significant difference at the α =
0.05 level for any of the three variables.
Growing season S.D. inTa,σawithin any given site was less thanε. Standard, deviations forTswere also less thanεwith the exception of the clear-cut in 1995, whenσswas 0.5◦C. When considering the importance of intersite or interannual differences in temperatures, we useε for all comparisons except those involving the clear-cut in 1995, for which we useσs.
Fig. 1 and Table 1 show∆a mean,∆a maxand∆a min
for the 2 years and two sites. Clear-cut∆a mean and
Fig. 2. Air and soil heat sum differences between clear-cut or halfcut and control site for cool and warm years.
Fig. 3. Soil temperature differences (mean, maximum, and minimum) between clear-cut or halfcut and control site for cool and warm years.
Clear-cut∆a maxis 1◦C greater in the cool year than in the warm year. Halfcut values, while less than clear-cut values, show a similar pattern. The change in half-cut ∆a max is 0.5◦C from the cool year to the warm year. Differences in air heat sums,∆aH, are greater
in the warm year than in the cool year (Fig. 2). In the clear-cut,∆aH rises 27 gdd, or 56%, from the cool to
the warm year. In the halfcut, the increase in∆aH is
11 gdd (100%) from the cool to the warm year. Soil values of ∆ were generally smaller than the air values (Table 1, Fig. 3) and in no case did the difference between cool and warm years exceedε. The most notable result for the soil is that clear-cut∆s max
was greater in the warm year than in the cool year, in contrast to clear-cut∆a max. There was little difference
in∆sH between the years for the clear-cut (Fig. 2).
Halfcut∆sH decreased by 22 gdd from the cool to the
warm year, 41% of it’s cool-year value.
5. Discussion
The significance tests show that even within a small region, there can be important differences in inter-annual climate variations. A statistically significant difference in one place may not manifest at other nearby locations. Rhinelander meanTa, cited earlier,
less contrast between the 2 years than ∆a max does. This suggests that simulations of the impact of climate change on tree growth or forest health (e.g. Consta-ble and Retzlaff, 2000) should adjust the magnitude of imposed increases in maximum air temperature to re-flect the density of the existing vegetation, while any increase in minimum air temperature or minimum or maximum soil temperatures can be site independent.
The results of the intersite, interannual analysis show that growing season temperature differences between cut and uncut sites can depend on the mag-nitude of overall temperatures. In the warm year studied, between-site differences in average air tem-perature were slightly larger than in the cool year, while differences in maximum daily air temperature were significantly smaller than in the cool year and differences in daily minimum air temperatures were unchanged.
Soil temperature and heat sum results differ from those for air. The differences in all soil-∆’s between the warm and cool years were less thanε; differences in ∆sH are also questionable, as they are well
be-low the effective error for H. Bearing that in mind, between-site differences in both average and daily ex-treme temperatures are more subdued, and differences in the extremes are much smaller than those for air. The degree of cutting on the treated sites affected the direction of the change in∆from the cool year to the warm, as well.
Chen et al. (1999) mention the effect of structural changes on stand microclimate and the importance of prevailing daily weather conditions on the diurnal temperature patterns within a given stand. Our results show that the cumulative effects of these two factors over a growing season can be significant. This inter-play between seasonal climate conditions and forest structure is an important factor in any attempt to un-derstand ecosystem processes and dynamics.
The fact that temperature differences between sites depend on the prevailing weather conditions means that context is important if one is examin-ing structure-microclimate relationships, especially if comparing sites or results from several studies. Authors should include a statement of the prevail-ing conditions for their study period (Wilson and Baldocchi, 2000), and/or use multiple-year averages to remove the interannual variations from their results (Morecroft et al., 1998).
It is tempting to use 1995 as a proxy for condi-tions under a globally warmed climate. However, any sustained long-term global climate change involves altered radiative balance as a primary cause of the change; the warm summer of 1995 resulted primarily from warm-air advection. Advection is relatively in-sensitive to the density of vegetation or canopy closure compared to radiation, and so any such extrapolation requires caution.
Another caution advised by this study pertains to the computation of heat sums. Values ofHin the anal-ysis came from the hourly temperature values, not from an average of maximum and minimum temper-atures for each day or assuming a sine wave diurnal cycle between these two extremes, the two most com-mon methods of computingH. Had we used either of the latter two methods, our results would have shown much smaller∆aH for the clear-cut and larger∆aH
for the halfcut. The implication here is that there was a change in the shape of the daily temperature cycle for at least one of the sites considered. Growth mod-els that rely on heat sums should make allowances for such variations, if they are to accurately predict the effects of climate variations on vegetation.
6. Conclusions
This study demonstrates that the relationship be-tween temperature microclimate and forest structure is not constant, but depends on the magnitude of the tem-perature. The most notable impact is on dailyTa max,
which shows less contrast between partially or fully open sites and closed sites in years of unusual warmth. These differences should be taken into account when modeling or simulating forest or tree growth interac-tions with climate variation.
determining the thermal environment in a forest. Un-derstanding differences in the diurnal cycle due to forest structure, and how the differences are or are not important to vegetation is an area that should be explored.
Finally, our study focussed on 2 years with strong temperature differences. Similar studies looking at va-por pressure, vava-por pressure deficit, or precipitation would be valuable. Cases of strong precipitation dif-ferences could focus on dry versus wet years, or years with similar total precipitation but distributed differ-ently in time (heavy, infrequent events versus moder-ate, frequent rains.)
Acknowledgements
Adam Wiese and Ed Gritt helped with installation of the equipment and day-to-day maintenance of the instruments. Jason Matteo and Tom Cate performed quality control on the recorded data and computed ba-sic statistics used for the analysis. We are also grate-ful to the regional editor and an anonymous reviewer, whose comments greatly improved this paper. Men-tion of trade names does not constitute endorsement by the USDA Forest Service.
References
Aussenac, G., 2000. Interactions between forest stands and microclimate: ecophysiological aspects and consequences for silviculture. Ann. For. Sci. 57, 287–301.
Calvert, W.H., Zuchowski, W., Brower, L.P., 1982. The impact of forest thinning on microclimate in monarch butterfly (Danaus Plexippus L.) overwintering areas of Mexico. Boletin de la Sociedad Botanica de Mexico 42, 11–18.
Chen, J., Saunders, S.C., Crow, T.R., Naiman, R.J., Brosofske, K.D., 1999. Microclimate in forest ecosyst em and landscape ecology. Bioscience 49, 288–297.
Constable, J.V.H., Retzlaff, W.A., 2000. Asymmetric day/night temperature elevation: growth implications for yellow-poplar and loblolly pine using simulation modeling. For. Sci. 46, 248– 257.
Geiger, R., 1965. The Climate near the Ground. Harvard University Press, Cambridge, Massachusetts (revised edition).
Karl, T.R., Knight, R.W., 1997. The 1995 Chicago heat wave: how likely is a recurrence? Bull. Am. Meteor. Soc. 78, 1107– 1119.
Kittredge, J., 1948. Forest Influences: the Effects of Woody Vegetation on Climate, Water, and Soil, with Applications to the Conservation of Water and the Control of Floods and Erosion. Mc-Graw-Hill, New York, 394 pp.
Liechty, H.O., Holmes, M.J., Reed, D.D., Mroz, G.D., 1992. Changes in microclimate after stand conversion in two northern hardwood stands. For. Ecol. Manage. 50, 253–264.
Madden, R.A., Shea, D.J., 1978. Estimates of the natural variability of time-averaged temperatures over the United States. Mon. Wea. Rev. 106, 1695–1703.
Morecroft, M.D., Taylor, M.E., Oliver, H.R., 1998. Air and soil microclimates of deciduous woodland compared to an open site. Agic. For. Meteorol. 90, 141–156.
Pearcy, R.W., Ehleringer, J., Mooney, H.A., Rundel, P.W., 1989. Plant Physiological Ecology: Field Methods and Instrumentation. Chapman & Hall, London.