Development of vegetation on set-aside land for
up to nine years from a national perspective
C.N.R. Critchley
∗, J.A. Fowbert
ADAS Newcastle, Kenton Bar, Newcastle upon Tyne NE1 2YA, UKReceived 28 June 1999; received in revised form 25 November 1999; accepted 25 November 1999
Abstract
Set-aside provides an opportunity to counteract recent declines in arable farmland biodiversity in the UK. Its recent widespread adoption has allowed its vegetation to be assessed from a national perspective. A botanical survey of 97 sites in England, stratified by intensive arable and mixed agriculture geographical regions, was carried out. Set-aside vegetation was established by natural regeneration or sown cover, and aged up to 9 years. Vegetation was recorded at each site from 30 quadrats located on transects running from the field boundary towards the field centre. Overall, cover was dominated by perennials and monocotyledons, with a large number of other species occurring at only a few sites. Species functional types and individual species frequencies differed between region, establishment method (natural regeneration or sown cover), and site age. The mixed agriculture region had vegetation with characteristics more similar to grassland, whereas in the arable region succession remained at an earlier stage for longer. Sown species accounted for differences between establishment methods. Succession continued after 5 years, with increasing species richness, perennials and species characteristic of non-arable habitats. Species richness within sites declined with increasing distance from the field boundary. Variation between sites in plant community composition was not accounted for by generalised soil and site management data. Although overall botanical diversity was low, the development of permanent grassland habitats on non-rotational (long-term) set-aside is a realistic objective. This needs to be balanced against known benefits of rotational (short-term) set-aside. Variation between regions suggests that benefits to biodiversity will accrue at differing rates in arable and mixed farming landscapes. At a national scale, regional differences should be taken into account when implementing policy objectives to optimise biodiversity benefits from set-aside. © 2000 Elsevier Science B.V. All rights reserved.
Keywords: Set-aside; Biodiversity; Vegetation succession; Arable plant communities; Vegetation survey; Functional types; UK
1. Introduction
Biodiversity on arable farmland has undergone severe declines in recent decades in those parts of Eu-rope where intensification of agricultural production
∗Corresponding author. Tel.:+44-191-214-1704;
fax:+44-191-271-6763.
E-mail address: [email protected] (C.N.R. Critchley)
has occurred. In the UK, this has been well docu-mented and comprehensively reviewed (e.g. Anon., 1995; Kirkwood, 1997; Sotherton, 1998). One of the most important recent changes in management of arable land in the UK has been the introduction of set-aside as a means of supply control, by tem-porary cessation of arable production on a defined percentage of the total arable area. With up to 6.4 mil-lion ha set-aside in Europe at its peak in 1993–1994
(Sotherton, 1998), this was potentially significant for biodiversity on arable farmland.
The establishment of vegetation on abandoned arable land, and its early successional changes have been comprehensively described from old-field sys-tems (e.g. Bazzaz, 1975; Pickett, 1982; Lepš, 1987). Similar processes in set-aside vegetation have been observed in studies of single sites and surveys within restricted geographical areas (Fisher et al., 1992; Wilson, 1992; Turley et al., 1994). The common se-quence in naturally regenerated set-aside vegetation is the initial establishment of annual species along with self-sown crops from the previous season’s shed seed (volunteers), which decline rapidly in abundance during the first 2–3 years, to be largely replaced by perennial grasses by the fifth year. Where vegetation cover is sown, the sown species tend to dominate the vegetation during this early phase, suppressing other species, and particularly the annuals that are other-wise characteristic of the first 2 years. Spatial pat-terns of species richness within fields tend to reflect those observed for arable weeds and their seedbanks within arable crops, with greatest concentrations be-ing within a few metres of the field edge (Marshall, 1989; Rew et al., 1992; Wilson and Aebischer, 1995). Corbet (1995) noted that empirical studies of set-aside have been short-term and influenced by site-specific factors. More recently, the effects of management on set-aside vegetation have been reported from a 10-year experiment (Hansson and Fogelfors, 1998). Assessments of the value to biodiversity of set-aside vegetation have highlighted the need for appropriate management if positive benefits are to be realised (Firbank et al., 1993; Sotherton, 1998).
The first set-aside in the UK was introduced as a voluntary scheme in July 1988 (Anon., 1988), and was followed by a second voluntary scheme for 1 year in August 1991 (Anon., 1991a). In May 1992, set-aside became part of the Arable Areas Payment Scheme (AAPS) under the reform of the Common Agricul-tural Policy of the European Union (Anon., 1992). The original 1988 scheme in the UK required a minimum of 20% of eligible land on a holding to be taken out of production in return for annual compensation pay-ments, but this was subsequently reduced under the AAPS to 5% by 1996–1997. With these administra-tive changes, also came modifications to the rules for set-aside management, but, in general, land entered
into set-aside could either be rotated annually around the holding (rotational set-aside), or be kept in the same place (non-rotational set-aside). Set-aside land could either be in blocks (usually whole fields) or as 20 m wide strips that were usually sited along field boundaries. Vegetation on set-aside fallow had to be established either by natural regeneration or by sown cover (grasses and, in some cases, legumes). This veg-etation had to be cut periodically (at least once a year) and cultivation was only allowed to control weeds or before establishing new plant cover. Pesticides and fer-tilisers were prohibited except under certain exemp-tions. From October 1991, some set-aside land could be grazed with livestock (Anon., 1991b).
With some fallow set-aside sites now in existence since 1988, and set-aside widely adopted from 1992, there was an opportunity to re-assess the development of its vegetation to include later years of succession, and its variation at a national scale. The success of wildlife habitat recreation on arable land in the longer term is largely dependent on the development of suit-able vegetation. The timescale over which this is likely to occur, and its consistency in different geographical regions will have important implications for the future management of set-aside land for biodiversity.
The aim of this study is to describe the variation in fallow set-aside vegetation from a national perspec-tive, including the full age range of sites currently in existence. This was achieved by field survey of a sam-ple of sites from England, UK.
2. Methods
2.1. Data collection
in whole fields or blocks, as opposed to field margin strips.
Within each site, one field boundary was randomly selected and a sampling zone established. The sam-pling zone had a minimum width of 20 m, and ex-tended 32 m into the field and to a minimum of 32 m from each end of the chosen field boundary. Five tran-sects extending at right angles from the field bound-ary were randomly located in the sampling zone. Each transect consisted of six 0.5 m×0.5 m quadrats (i.e. 30 quadrats per site) placed at distances of 1, 2, 4, 8, 16 and 32 m from the boundary, with individual quadrats orientated diagonally at each position on the transect. To ensure that the sequence of quadrats in each tran-sect represented a progression from the field bound-ary origin towards the field centre, quadrat number six (32 m from the field boundary origin) had to be at least 32 m from any other field boundary. Field mar-gins that were less than 32 m in width had transects limited to 16 m in length, with five quadrats only (i.e. 25 quadrats per site). Vegetation height was first mea-sured in the centre of each quadrat using a sward plate meter comprising a plastic disk (10 cm diam) mounted on a ruled fibreglass cane of 0.6 cm diameter through the centre of the disk. The end of the cane was po-sitioned on the soil surface and the disk allowed to settle on the vegetation to obtain the height measure-ment. To obtain estimates of top cover, a single pinhit per quadrat was recorded. The pin was lowered ver-tically in one corner of the quadrat and the first hit of plant species, bare ground or straw/litter noted. In each quadrat, the presence of plant species (if rooted in the quadrat), bare ground and straw/litter, was also recorded. For each site, cover of plant species, bare ground and straw/litter was calculated as the percent-age (out of 25 or 30) of pinhits per site, and species frequencies as the percentage of quadrats in which they occurred. To maximise the chances of detect-ing small changes between repeated surveys, species were recorded cumulatively from a series of smaller nested cells within each quadrat (Hodgson et al., 1994; Critchley and Poulton, 1998). However, for the pur-pose of between-site comparisons reported here, the cover and frequency data were considered to be suffi-ciently precise.
Plants were identified to species level apart from bryophytes and seedlings (defined as plants with less than two true leaves) each of which was recorded as a
single group. Occasionally, where species could not be reliably separated in the field, they were recorded as amalgams (e.g. Lolium multiflorum/perenne). Nomen-clature follows Stace (1991). Field surveys were carried out during 7 May–22 June 1996.
2.2. Data analysis
Three sites were lost because of alterations to farmers’ set-aside agreements, leaving 97 available for analysis. Sites were classified by the method used to establish vegetation (natural regeneration or sown cover) and into two age classes according to the num-ber of years of continuous management as set-aside (1–5 and 6–9 years). Five years was chosen as the cut-off between the age classes because changes in set-aside vegetation had been previously described up to that age. Some sites had been managed as set-aside since 1987 in anticipation of the forthcoming scheme in 1988, so that the maximum age available was 9 years. Differences among region, establishment method and age were analysed using a fixed-effects multivariate Analysis of Variance (MANOVA). Four separate analyses were carried out. These were, respectively, of
(a) the main cover components (plant cover, bare ground and straw/litter),
(b) the cover of different species functional types (annuals, perennials, monocotyledons, dicotyledons, species with the canopy structure classes basal and leafy (Hodgson et al., 1995) and species categorised as ‘very characteristic of arable habitats’ and ‘mainly absent from arable habitats’ (Grime et al., 1988; Hodgson et al., 1995)),
(c) the relative frequency of the species functional types outlined in (b), and
(d) the frequency of the nine most commonly occur-ring species.
Relative frequencies for species functional types were the proportion of species records of that type in each quadrat, expressed as site means. All cover and frequency data were transformed to arcsin(√x) to meet the requirements of Analysis of Variance (Zar, 1984).
establishment method, region, site age and distance from field boundary were fixed factors, and distance was the repeated measure. Field margin sites (11 sites) with shorter transects were omitted. Species richness data were transformed to log10(x+1) before
analysis.
Relationships between vegetation and environmen-tal factors were analysed for 36 naturally regener-ated sites for which management information could be obtained from farmers, using Canonical Correspon-dence Analysis (CCA) (ter Braak, 1987). Within-site species percentage frequencies were calculated, using the 30 quadrats from set-aside blocks and 25 from field margin set-aside, respectively. All species and amal-gams were included except bryophytes and unidenti-fied seedlings. Environmental data were region, soil class, previous crop in the year before set-aside estab-lishment, management of set-aside vegetation in the previous 7 months and age of each site (in years). Soil data were derived from the Soil Survey and Land Re-search Council dominant soils map of Great Britain at the 1 km scale, and re-classified as described by Firbank et al. (1998). Management activities (grazing, cutting and herbicide application) were those carried out during the 7-month period preceding the field sur-veys (September 1995–May 1996). No sites had been subjected to cultivation.
Stability of the analysis under re-ordering of data was checked as recommended by Oksanen and Minchin (1997), and found to be satisfactory. En-vironmental variables were added individually by forward selection, and significance testing done for each variable in turn, and for the overall trace, us-ing 999 Monte Carlo permutations (ter Braak, 1988, 1990). Only environmental variables that showed a significant relationship with species were added to the model.
3. Results
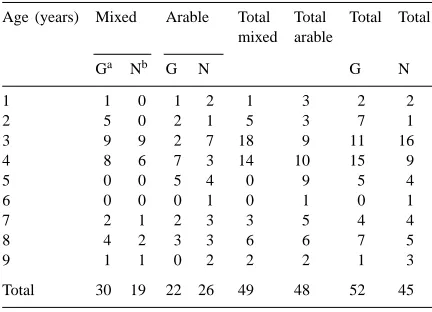
Vegetation was established by natural regeneration at 45 sites and by sown cover at 52 sites (Table 1). The ages of the set-aside ranged from 1 to 9 years with all intermediate ages represented (but not necessarily for each establishment type). Eleven sites were field margins (seven in the mixed region, four in the arable region).
Table 1
Numbers of sites surveyed by age, region and establishment method
Age (years) Mixed Arable Total Total Total Total mixed arable
3.1. Species composition and cover components
A total of 229 species or amalgams were recorded (Appendix A). Of the nine species occurring in over 50% of sites, six were grasses; Poa trivialis was found at 90% and L. multiflorum/perenne at 88% of sites. The other most frequently found monocotyledons were Elytrigia repens, P. annua, Agrostis stolonifera and Holcus lanatus. Cirsium arvense was the most frequently recorded dicotyledon, found at 65% of sites, followed by Ranunculus repens and Trifolium
repens. However, the majority of dicotyledons were
found at very few sites; 140 species were recorded from less than 10% of sites and 91 species from less than 3%. Only one nationally rare (Stace, 1991) and 15 declining (Rich and Woodruff, 1996) species were recorded (Appendix A). Crop volunteers were recorded but only at a minority of sites; the most fre-quent was Triticum sp. in 10% of sites. Bare ground, litter and seedlings were very widespread, found at 95, 92 and 92% of sites, respectively.
3.2. Effects of establishment method, region and site age
No differences were detected in the multivariate tests for the main cover components between regions (Rao R(3,87)=1.75, n.s.), establishment method (Rao
R(3,87)=0.35, n.s.) or site age (Rao R(3,87)=1.16,
n.s.), nor were there significant univariate F tests for any of the individual dependent variables. There were significant differences in the multivariate tests for cover of species functional types between regions, es-tablishment methods and site age (Table 2), but only for site age in relative frequency of species functional types (Table 3). None of the interaction terms were significant.
Differences in individual dependent variables (uni-variate F tests) for species functional types were detected for all main factors (Tables 2 and 3). Sites in the mixed agriculture region had more cover of dicotyledons, greater cover and relative frequency of basal species, and lower cover of arable species than those in the arable region. Sites established by natural regeneration had greater cover and relative frequency of annuals and leafy species, lower cover of peren-nials, and greater relative frequency of non-arable species than did those with sown cover. Older sites had more cover of leafy species and monocotyledons and greater relative frequency of perennials, leafy species, and non-arable species than younger sites. Younger sites also had greater relative frequency of arable species. In the arable region, young sites had greater relative frequency of annuals than old sites, but the converse was true in the mixed region (region×age F(1,89)=4.16, p<0.05). Perennials in the
arable region also had higher relative frequency in older sites, but in the mixed region there was little difference between the two age classes (region×age
F(1,89)=4.13, p<0.05) (Fig. 1).
The regions, establishment methods and age classes were strongly differentiated by the individual species analysed (Table 4). As expected, the agricultural species (L. perenne, T. repens) were much more fre-quent in sown cover. The three species found more frequently in the mixed region than the arable region (A. stolonifera, R. repens, T. repens) were perennials which typically occur in relatively moist, mesotrophic grasslands (Grime et al., 1988). E. repens, more char-acteristic of fertile, disturbed habitats, was more
fre-quent in the arable region. The only annual analysed (P. annua) was more frequent in younger sites, with four of the other (perennial) species more frequent in older sites.
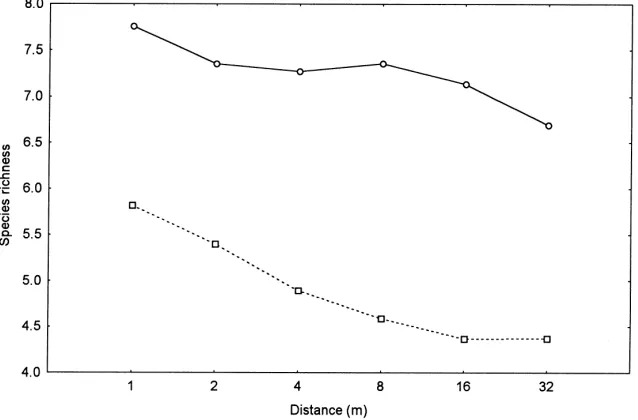
Species richness declined progressively with in-creasing distance from the field boundary (Rao
R(5,74)=4.45, p<0.005) and was significantly higher
in older sites than younger sites (F(1,78)=17.37,
p<0.0001) (Fig. 2).
3.3. Environmental factors
Within the sub-sample subjected to CCA, there was approximately equal representation of sites from the two regions (Table 5). Only 14 sites had been subject to some form of management during the specified period. The most common soil class was loamy brown soils (15 sites), other soil classes being represented by only a few sites each. Winter wheat was the commonest crop preceding set-aside (16 sites), with four or fewer sites for each of the other crops.
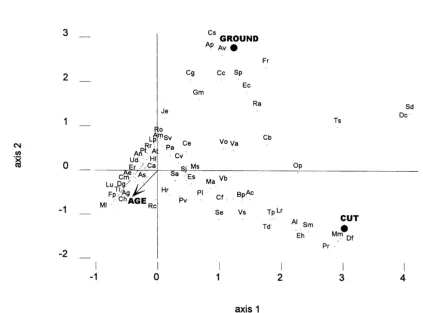
Although age of site, cutting and groundwater gley soils had a significant relationship with the vegetation, most variation in the vegetation was not accounted for (Table 6). Many perennial species typical of grass-lands (e.g. Alopecurus geniculatus, Carex hirta,
Fes-tuca pratensis, Lotus pedunculatus) were associated
with greater age of sites (Fig. 3). However, a small number of annuals (e.g. Tripleurospermum inodorum) were also associated with older sites. Although both cutting and groundwater gleys were significant factors in the analysis, no ecologically important patterns as-sociated with either were discernible from biplots of the various combinations of axes 1–4. For example, species associated with groundwater gleys included some normally associated with dry, sandy soils (e.g.
Spergula arvensis, Erodium cicutarium).
4. Discussion
Fig. 1. Mean relative frequency of annuals (squares) and perennials (triangles) in old and young sites in the arable and mixed regions. Bars are standard errors; data are backtransformed.
recorded. However, it should be noted that the field method used may not have detected the rarest species within sites. The general characteristics of the veg-etation were similar to those reported from surveys of smaller geographical areas (Fisher et al., 1992; Wilson, 1992).
Only a small proportion of the variation at the plant community level was explained in the CCA, although this may have been partly the result of the small sam-ple size and the coarse definition of soil maps. Botan-ical diversity was low at most sites, although more diverse plant communities are known to occur on chalky and sandy soils under set-aside management (Critchley and Smart, unpublished data). However, there were only two and one such sites, respectively in the current sample, reflecting their relative scarcity. More targeted sampling would be needed to assess sites with less common environmental characteristics. However, important spatial and temporal variation in the vegetation was accounted for.
The differences in the vegetation between natu-ral regeneration and sown cover resulted from the presence of the sown species and their competitive advantage over other species, particularly annuals. Therefore, where suppression of agricultural weeds is
a priority, sown cover is preferable. However, natural regeneration will provide better opportunities for the conservation of annual arable plants, but only in the first 2–3 years and with site management specifically tailored to their requirements (Firbank and Wilson, 1995). A greater contribution to cover of species with leafy canopy structure in natural regeneration also indicates differences in vegetation architecture which are potentially important for different invertebrate communities (Corbet, 1995).
Fig. 2. Mean (backtransformed) species richness per 0.25 m−2at specified distances from the permanent field boundary, in sites aged 1–5 years (squares, n=64) and 6–9 years (circles, n=22).
of local landscape structure, and the role of adjacent habitats as propagule sources has been demonstrated for the development of species-rich grasslands (Gib-son and Brown, 1991b). Differences in set-aside veg-etation between the two regions may therefore arise from a combination of differences in agricultural land use and site colonisation potential. Regional variation was more evident from measurements of cover than of relative frequency, indicating that it was the domi-nant components of the vegetation that differed most. Cover (derived from pinhits) and frequency (derived from presence in quadrats) differ from each other in the scale at which records of species or other variables are made (Critchley and Poulton, 1998). The benefits of using the different scales was evident here, as some
Table 5
Number of sites for each region, soil class, management in previous 7 months and previous crop type subjected to CCA.
Region Soil class Management Previous crop
Arable 20 Loamy brown soils 15 Grazed 8 Winter wheat 16
Mixed 16 Clay brown soils 6 Cut 3 Winter barley 4
Groundwater gley soils 4 Herbicide 3 Spring barley 3
Pelosols 4 Linseed 3
Lithomorphic soils 3 Sugar beet 1
Calcareous brown soils 2 Spring wheat 1
Sandy brown soils 1 No data 8
Urban 1
Table 6
Summary of CCA results
% variance explained by signifi- Variables showing significant relation- Monte Carlo P for overall trace cant environmental variables ship with species (P, Monte Carlo test)
17.7 Cut (0.001) 0.001
Groundwater gleys (0.002)
Age (0.004)
the direction of succession then appears to take place, with an increase in species richness and the colonisa-tion and spread of new species, including those least characteristic of arable habitats. This is analogous to the development of vegetation on bare soil described by Bartha (1990), where a sharp transition from pri-mary colonisers to ruderal annuals and biennials in 3–4 years was followed by a more gradual change to perennial domination within 10 years.
The increase in species richness after 5 years is consistent with the predictions of Corbet (1995). How-ever, in a 10-year experiment no increase in species richness was apparent in data published by Hansson and Fogelfors (1998). Competition between species, and hence succession, is related to management and site conditions (Hansson and Fogelfors, 1998), so that individual sites may diverge from the general trends found in this survey. In the longer-term, succession is likely to continue slowly. In the absence of manage-ment in old-field systems, generalisations about the course of succession are difficult to make, and can be affected by factors such as soil type (Symonides and Wierzchowska, 1990). Increases in species diversity have been shown to occur after the second (Pickett, 1982) or fourth year (Bazzaz, 1975), but in another study it declined from 8–18 years (Symonides and Wierzchowska, 1990). Although no clear effects of management were found in this study apart from the establishment of a sown cover, defoliation by cutting should direct succession towards grassland commu-nities in a similar manner to grazing (Gibson and Brown, 1991a, 1992; Hansson and Fogelfors, 1998). Within sites, botanical diversity was higher at the field edge than towards the centre, reflecting the normal patterns within arable crops (Marshall, 1989; Wilson and Aebischer, 1995).
Set-aside in its first year of establishment, of which the largest area in England exists as rotational set-aside, has significant benefits for biodiversity, particularly wintering and breeding birds (Aebischer, 1997; Evans, 1997; Henderson et al., in press). With appropriate management it is also potentially ben-eficial to gamebirds and other wildlife associated with arable farmland (Sotherton, 1998). If allowed to develop as non-rotational set-aside, botanical di-versity does begin to increase after 5 years, although the process is slow, and it is likely that vegetation will continue to develop after 9 years. Therefore,
the development of habitats resembling permanent semi-natural grassland must be a long-term objective. The process might be accelerated by the deliberate in-troduction of additional plant species (Burch, 1996). Although it is not known whether species introduced in this way will persist after the first few years, differ-ences between natural regeneration and sown cover were still detectable in older sites. Once established, species are likely to persist if site conditions remain favourable, as species important in late succession are usually present from an early stage (Pickett, 1982). The nature of the ultimate plagio-climax vegetation on set-aside will probably be determined by local site conditions and management, and be dependent on soil properties and proximity to propagule sources. Ford (1996) has suggested that diverse, Arrhenatherum
elatius dominated communities may only develop on
a minority of sites.
In England, both rotational set-aside and long-term set-aside will have benefits for biodiversity. At a national scale, geographical differences in vegeta-tion development indicated that progression towards grassland communities was more likely in the mixed region. However, the relative scarcity of grassland in the arable region is likely to increase the local effect on biodiversity of individual long-term set-aside sites. In the arable region, either rotational set-aside or non-rotational set-aside for longer than 5 years will probably accrue most benefits. In the mixed region, non-rotational set-aside can be expected to provide benefits within a shorter period than this. Therefore, the likelihood of meeting different biodiversity ob-jectives will vary not only among individual sites (Firbank et al., 1994), but also between different geo-graphical regions. Thus, the potential variation in veg-etation development between different geographical regions should be considered when defining priorities for the conservation of biodiversity using set-aside as an agri-environmental, rather than production control, measure.
Acknowledgements
Richard Kilshaw, Monica O’Donnell, Ann Sherwood, Tobin Stephenson, Graham Walsh, Robin Webb and Barry Wright. Noranne Ellis managed the site database and initial statistical advice was provided by Simon Poulton and Peter Rothery. Les Firbank, John Garstang, Mark Hill and James Clarke contributed to various aspects of the project. Mike Burke and an anonymous referee commented on a draft manuscript. The authors are also grateful to the many farmers who allowed access to their land.
Appendix A
Plant taxa recorded from 97 set-aside sites, with per-centage of sites in which they were present and mean frequency within sites in which they occurred. Nation-ally rare (R) (Stace, 1991) or declining (D) (Rich and Woodruff, 1996) species are indicated.
axon % of Mean
sites frequency
Monocotyledons
Poa trivialis 89.7 0.65
Lolium multiflorum/perenne 87.6 0.67
Elytrigia repens 77.3 0.40
Poa annua 68.0 0.34
Agrostis stolonifera 66.0 0.41
Holcus lanatus 63.9 0.30
Dactylis glomerata 48.5 0.17
Bromus hordeaceus 46.4 0.27
Arrhenatherum elatius 44.3 0.21
Anisantha sterilis 43.3 0.38
Phleum pratense 41.2 0.25
Alopecurus myosuroides 32.0 0.22
Festuca rubra 25.8 0.58
Agrostis capillaris 21.7 0.39
Holcus mollis 14.4 0.31
Poa pratensis 10.3 0.28
Alopecurus geniculatus 10.3 0.25
Alopecurus pratensis 9.3 0.24
Bromus sp. 9.3 0.09
Cynosurus cristatus 8.3 0.48
Festuca pratensis 6.2 0.32
Bromus commutatus 5.2 0.15
Avena fatua 4.1 0.07
Vulpia bromoides 3.1 0.19
Anthoxanthum odoratum 3.1 0.04
axon % of Mean
sites frequency
Juncus effusus 3.1 0.03
Luzula campestris 3.1 0.03
Festuca ovina 2.1 0.35
Phalaris arundinacea 2.1 0.08
Juncus bufonius 2.1 0.03
Juncus inflexus 2.1 0.03
Aira caryophyllea (D) 1.0 0.93
Festuca lemanii (R) 1.0 0.50
Bromus lepidus 1.0 0.30
Glyceria declinata 1.0 0.27
Deschampsia flexuosa 1.0 0.23
Poa sp. 1.0 0.13
Agrostis canina 1.0 0.07
Brachypodium sylvaticum 1.0 0.03
Carex hirta 1.0 0.03
Carex panicea (D) 1.0 0.03
Deschampsia cespitosa 1.0 0.03
Hordeum secalinum 1.0 0.03
Dicotyledons
Cirsium arvense 65.0 0.25
Ranunculus repens 53.6 0.23
Trifolium repens 51.6 0.37
Galium aparine 49.5 0.11
Taraxacum officinale 48.5 0.19
Cerastium fontanum 45.4 0.16
Geranium dissectum 41.2 0.37
Cirsium vulgare 41.2 0.09
Urtica dioica 35.1 0.19
Veronica arvensis 34.0 0.22
Rumex obtusifolius 33.0 0.11
Heracleum sphondylium 32.0 0.20
Veronica persica 32.0 0.14
Sonchus asper 28.9 0.19
Epilobium sp. 28.9 0.16
Stellaria media 25.8 0.18
Senecio jacobaea 24.7 0.13
Senecio vulgaris 23.7 0.11
Plantago major 22.7 0.16
Trifolium dubium 19.6 0.29
Myosotis arvensis 18.6 0.21
Convolvulus arvensis 17.5 0.22
Rumex crispus 17.5 0.09
Viola arvensis 16.5 0.26
Anthriscus sylvestris 16.5 0.10
axon % of Mean sites frequency
Rubus fruticosus 14.4 0.06
Vicia sativa 13.4 0.24
Lamium purpureum 13.4 0.17
Glechoma hederacea 13.4 0.10
Hypochaeris radicata 12.4 0.12
Capsella bursa-pastoris 12.4 0.10
Chenopodium album 12.4 0.07
Polygonum aviculare 11.3 0.17
Aphanes arvensis 11.3 0.12
Sonchus arvensis 11.3 0.12
Matricaria recutita 10.3 0.21
Crepis capillaris 10.3 0.20
Crepis vesicaria 10.3 0.10
Trifolium campestre 10.3 0.10
Trifolium pratense 10.3 0.09
Veronica serpyllifolia 10.3 0.07
Tripleurospermum inodorum 9.3 0.29
Senecio erucifolius 9.3 0.12
Geranium molle 8.3 0.28
Fraxinus excelsior 8.3 0.10
Cerastium glomeratum 8.3 0.07
Potentilla reptans 8.3 0.05
Picris echioides 7.2 0.21
Matricaria discoidea 7.2 0.17
Quercus robur 7.2 0.04
Rumex acetosella 6.2 0.32
Anagallis arvensis 6.2 0.18
Crepis biennis 6.2 0.13
Sisymbrium officinale 6.2 0.08
Prunus spinosa 6.2 0.05
Erodium cicutarium (D) 5.2 0.31
Sherardia arvensis (D) 5.2 0.17
Artemisia vulgaris 5.2 0.11
Rumex acetosa 5.2 0.07
Tragopogon pratensis 5.2 0.06
Veronica chamaedrys 5.2 0.06
Chamerion angustifolium 5.2 0.05
Rosa canina 5.2 0.03
Papaver rhoeas 4.1 0.30
Arabidopsis thaliana 4.1 0.28
Ornithopus perpusillus (D) 4.1 0.24
Lamium album 4.1 0.14
Acer campestre 4.1 0.09
Calystegia sepium 4.1 0.08
Plantago lanceolata 4.1 0.08
axon % of Mean
sites frequency
Spergula arvensis (D) 4.1 0.08
Lapsana communis 4.1 0.07
Hedera helix 4.1 0.06
Odontites verna 4.1 0.06
Medicago lupulina 4.1 0.05
Bellis perennis 4.1 0.04
Arenaria serpyllifolia 3.1 0.28
Trifolium sp. 3.1 0.28
Anchusa arvensis 3.1 0.27
Veronica hederifolia 3.1 0.20
Silene latifolia 3.1 0.13
Veronica agrestis 3.1 0.12
Silene dioica 3.1 0.10
Veronica sp. 3.1 0.07
Pilosella officinarum 3.1 0.06
Ranunculus ficaria 3.1 0.06
Hypericum perforatum 3.1 0.04
Stachys sylvatica 3.1 0.03
Epilobium hirsutum 2.1 0.37
Ranunculus bulbosus 2.1 0.28
Persicaria maculosa 2.1 0.20
Aethusa cynapium 2.1 0.17
Vicia hirsuta 2.1 0.15
Prunella vulgaris 2.1 0.13
Tripleurospermum/Matricaria sp. 2.1 0.13
Mentha arvensis 2.1 0.10
Ulmus sp. 2.1 0.10
Ajuga reptans 2.1 0.08
Leucanthemum vulgare 2.1 0.08
Malus sylvestris 2.1 0.08
Myosotis ramosissima (D) 2.1 0.08
Vicia cracca 2.1 0.08
Lotus pedunculatus 2.1 0.07
Achillea millefolium 2.1 0.05
Lactuca serriola 2.1 0.05
Lotus corniculatus 2.1 0.05
Pastinaca sativa 2.1 0.05
Plantago media 2.1 0.05
Sonchus oleraceus 2.1 0.05
Conium maculatum 2.1 0.03
Myosotis discolor 2.1 0.03
Myosotis sp. 2.1 0.03
Rosa sp. 2.1 0.03
Geranium pusillum 1.0 0.57
axon % of Mean sites frequency
Epilobium tetragonum 1.0 0.37
Medicago arabica 1.0 0.37
Pulicaria dysenterica 1.0 0.37
Cirsium eriophorum 1.0 0.33
Valerianella locusta (D) 1.0 0.33
Euphorbia exigua (D) 1.0 0.27
Sinapis alba 1.0 0.27
Galium mollugo 1.0 0.20
Hypericum hirsutum 1.0 0.20
Potentilla anserina 1.0 0.23
Anthriscus caucalis 1.0 0.17
Conyza canadensis 1.0 0.17
Malva moschata (D) 1.0 0.17
Polygonum sp. 1.0 0.17
Rumex sanguineus 1.0 0.17
Fallopia convolvulus 1.0 0.13
Atriplex patula 1.0 0.10
Galeopsis tetrahit 1.0 0.10
Montia perfoliata 1.0 0.10
Reseda lutea 1.0 0.10
Salix sp. 1.0 0.10
Tripleurospermum maritimum 1.0 0.10
Vicia lathyroides 1.0 0.10
Arum Maculatum 1.0 0.07
Barbarea vulgaris 1.0 0.07
Cardaria draba 1.0 0.07
Coronopus didymus 1.0 0.07
Filago vulgaris (D) 1.0 0.07
Lactuca virosa 1.0 0.07
Lathyrus nissolia 1.0 0.07
Leontodon hispidus 1.0 0.07
Prunus sp. 1.0 0.07
Ranunculus acris 1.0 0.07
Sambucus nigra 1.0 0.07
Trifolium striatum 1.0 0.07
Angelica sylvestris 1.0 0.03
Anthemis cotula 1.0 0.03
Arctium minus 1.0 0.03
Clematis vitalba 1.0 0.03
Atriplex/Chenopodium sp. 1.0 0.03
Conopodium majus 1.0 0.03
Daucus carota ssp. sativa 1.0 0.03
Filago minima (D) 1.0 0.03
Fumaria officinalis 1.0 0.03
Hieracium sp. 1.0 0.03
axon % of Mean
sites frequency
Humulus lupulus 1.0 0.03
Kickxia spuria 1.0 0.03
Lathyrus pratensis 1.0 0.03
Legousia hybrida 1.0 0.03
Lepidium campestre (D) 1.0 0.03
Myosoton aquaticum 1.0 0.03
Pedicularis sylvatica (D) 1.0 0.03
Raphanus raphanistrum 1.0 0.03
Scrophularia nodosa 1.0 0.03
Silene sp. 1.0 0.03
Sinapis arvensis 1.0 0.03
Sorbus aria 1.0 0.03
Stellaria graminea 1.0 0.03
Trifolium medium 1.0 0.03
Tussilago farfara 1.0 0.03
Verbascum thapsus 1.0 0.03
Vicia sepium 1.0 0.03
Vicia sp. 1.0 0.03
Viola tricolor (D) 1.0 0.03
Crop volunteers
Triticum sp. 10.3 0.16
Brassica sp. 5.1 0.23
Hordeum vulgare/distichon 4.1 0.42
Avena sativa 2.1 0.52
Other groups
Seedling 91.8 0.31
Bryophyte 82.5 0.41
Equisetum arvense 10.3 0.12
Equisetum sp. 1.0 0.07
References
Aebischer, N.J., 1997. Effects of cropping practices on declining farmland birds during the breeding season. The 1997 Brighton Crop Protection Conference — Weeds, BCPC, Farnham, pp. 915–922.
Anon., 1988. Set-aside, SA1. MAFF, London.
Anon., 1991a. One-year Set-aside Scheme. SAO3. MAFF, London. Anon., 1991b. Set-aside, SA1 (Rev. 3). MAFF, London. Anon., 1992. Arable Area Payments Explanatory Booklet AR2.
MAFF, London.
Anon., 1995. Biodiversity: The UK Steering Group Report Vol. 2. Action Plans. HMSO, London.
theory. In: Krahulec, F., Agnew, A.D.Q., Agnew, S., Willems, J.H. (Eds.), Spatial Processes in Plant Communities. SPB Academic Publishing, The Hague, pp. 31–47.
Bazzaz, F.A., 1975. Plant species diversity in old-field successional ecosystems in southern Illinois. Ecology 56, 485–488. Burch, F.M., 1996. Establishing species-rich grassland on set-aside
land: balancing weed control and species enhancement. Asp. Appl. Biol. 44, 221–226.
Corbet, S.A., 1995. Insects, plants and succession: advantages of long-term set-aside. Agric. Ecosyst. Environ. 53, 201–217. Critchley, C.N.R., Poulton, S.M.C., 1998. A method to optimize
precision and scale in grassland monitoring. J. Veg. Sci. 9, 837–846.
Evans, A.D., 1997. Seed-eaters, stubble fields and set-aside. The 1997 Brighton Crop Protection Conference — Weeds, BCPC, Farnham, pp. 907–914.
Firbank, L.G., Wilson, P.J., 1995. Arable weeds and set-aside — a cause for conservation or a cause for concern? In: Colston, A., Perring, F. (Eds.), Insects, Plants and Set-aside. Bot. Soc. Br. Isles, London, pp. 19–20.
Firbank, L.G., Arnold, H.R., Eversham, B.C., Mountford, J.O., Radford, G.L., Telfer, M.G., Treweek, J.R., Webb, N.R.C., Wells, T.C.E., 1993. Managing Set-aside Land for Wildlife. ITE Research Publication No. 7, HMSO, London.
Firbank, L.G., Telfer, M.G., Eversham, B.C., Arnold, H.R., 1994. The use of species-decline statistics to help target conservation policy for set-aside arable land. J. Environ. Manage. 42, 415– 422.
Firbank, L.G., Ellis, N.E., Hill, M.O., Lockwood, A.J., Swetnam, R.D., 1998. Mapping the distribution of weeds in Great Britain in relation to national survey data and to soil type. Weed Res. 38, 1–10.
Fisher, N.M., Dyson, P.W., Winham, J.M., Davies, D.H.K., Lee, K., 1992. A botanical survey of set-aside in Scotland. In: Clarke, J. (Ed.), Set-aside. Monogr. No. 50, BCPC, Farnham, pp. 67–72. Ford, M.A., 1996. The transformation of surplus farmland into semi-natural habitat I. Effect of seed supply on the conservation value of Scottish set-aside exemplified by the vegetation at a site near Elgin. Asp. Appl. Biol. 44, 179–184.
Gibson, C.W.D., Brown, V.K., 1991a. The effects of grazing on local colonisation and extinction during early succession. J. Veg. Sci. 2, 291–300.
Gibson, C.W.D., Brown, V.K., 1991b. The nature and rate of development of calcareous grassland in Southern Britain. Biol. Conserv. 58, 297–316.
Gibson, C.W.D., Brown, V.K., 1992. Grazing and vegetation change: deflected or modified succession? J. Appl. Ecol. 29, 120–131.
Grime, J.P., Hodgson, J.G., Hunt, R., 1988. Comparative Plant Ecology. Unwin Hyman, London.
Hansson, M., Fogelfors, H., 1998. Management of permanent set-aside on arable land in Sweden. J. Appl. Ecol. 35, 758–771. Henderson, I.G., Vickery, J.A., Fuller, R.J. Summer bird abundance and distribution on set-aside fields on intensive arable farms in England. Ecography, in press.
Hodgson, J.G., Colasanti, R., Phillipson, P., Leach, S., Montgo-mery, S., Hunt, R., 1994. A simple method for monitoring
grassland vegetation. In: Haggar, R.J., Peel, S. (Eds.), Grassland Management and Nature Conservation. Occasional Symp. Br. Grassland Soc. 28, pp. 286–288.
Hodgson, J.G., Grime, J.P., Hunt, R., Thompson, K., 1995. The Electronic Comparative Plant Ecology. Chapman and Hall, London.
Kirkwood, R.C. (Ed.), 1997. Biodiversity and Conservation in Agriculture. BCPC Symp. Proc. 69, British Crop Protection Council, Farnham.
Lepš, J., 1987. Vegetation dynamics in early old field succession: a quantitative approach. Vegetatio 72, 95–102.
Marshall, E.J.P., 1989. Distribution patterns of plants associated with arable field edges. J. Appl. Ecol. 26, 247–257.
Oksanen, J., Minchin, P.R., 1997. Instability of ordination results under changes in input order: explanations and remedies. J. Veg. Sci. 8, 447–454.
Pickett, S.T.A., 1982. Population patterns through twenty years of oldfield succession. Vegetatio 49, 45–59.
Rew, L.J., Wilson, P.J., Froud-Williams, R.J., Boatman, N.D., 1992. Changes in vegetation composition and distribution within set-aside land. In: Clarke, J. (Ed.), Set-aside. Monogr. No. 50, BCPC, Farnham, pp. 79–84.
Rich, T.C.G., Woodruff, E.R., 1996. Changes in the vascular plant floras of England and Scotland between 1930–1960 and 1987–1988. The BSBI Monitoring Scheme. Biol. Conserv. 75, 217–229.
Sotherton, N.W., 1998. Land use changes and the decline of farmland wildlife: an appraisal of the set-aside approach. Biol. Conserv. 83, 259–268.
Stace, C.A., 1991. New Flora of the British Isles. Cambridge University Press, Cambridge.
Symonides, E., Wierzchowska, U., 1990. Changes in the spatial pattern of vegetation structure and of soil properties in early old-field succession. In: Krahulec, F., Agnew, A.D.Q., Agnew, S., Willems, J.H. (Eds.), Spatial Processes in Plant Communities. SPB Academic Publishing, The Hague, pp. 201–213. ter Braak, C.J.F., 1987. The analysis of vegetation-environment
relationships by canonical correspondence analysis. Vegetatio 69, 69–77.
ter Braak, C.J.F., 1988. CANOCO — a FORTRAN Program for Canonical Community Ordination by (Partial) (Detrended) (Canonical) Correspondence Analysis, Principal Components Analysis and Redundancy Analysis Version 2.1. GLW, Wageningen.
ter Braak, C.J.F., 1990. Update Notes: CANOCO Version 3.10. Agricultural Mathematics Group, Wageningen.
Turley, D.B., Phillips, M.C., Clarke, J.H., Raw, K.A., Jones, A.E., Hill, P.E., Froment, M.A., Mills, A.R., 1994. Development of flora during three years of set-aside, and weed levels in a following wheat crop. Asp. Appl. Biol. 40, 435–442. Wilson, P.J., 1992. The natural regeneration of vegetation under
set-aside in southern England. In: Clarke, J. (Ed.), Set-aside. Monogr. No. 50, BCPC, Farnham, pp. 73–78.
Wilson, P.J., Aebischer, N.J., 1995. The distribution of dicotyledonous arable weeds in relation to distance from the field edge. J. Appl. Ecol. 32, 295–310.