Precision Measurement for the grasp of Welding Deformation Amount of Time Series for
Large-scale Industrial Products
Ryogo Abe a, *, Kunihiro Hamada b , Noritaka Hirata b, Ryotaro Tamura b , Nobuaki Nishi c
a
Kokusai Kogyo Co., Ltd
,
Research and Development Division, Digital Sensing Group
,
2-24-1 Harumi-cho, Fuchu
City,Tokyo 183-0057 JAPAN
- [email protected]
b
Hiroshima University
cTsuneishi Shipbuilding Co., Ltd.
Commission/WG
KEY WORDS: Large-scale Industrial measurement, Weld Deformation, Precise Measurement, Ship Building
ABSTRACT:
As well as the BIM of quality management in the construction industry, demand for quality management of the manufacturing process of the member is higher in shipbuilding field. The time series of three-dimensional deformation of the each process, and are accurately be grasped strongly demanded. In this study, we focused on the shipbuilding field, will be examined three-dimensional measurement method. The shipyard, since a large equipment and components are intricately arranged in a limited space, the installation of the measuring equipment and the target is limited. There is also the element to be measured is moved in each process, the establishment of the reference point for time series comparison is necessary to devise. In this paper will be discussed method for measuring the welding deformation in time series by using a total station. In particular, by using a plurality of measurement data obtained from this approach and evaluated the amount of deformation of each process.
* Corresponding author. This is useful to know for communication with the appropriate person in cases with more than one author.
1. INTRODUCTION
In construction of structures (bridge or building, etc.) in the construction sector including BIM (Building Information Modeling), the quality management of the three-dimensional shape including the control of diremption from the design data in each in every work process is required. Similarly, also in the shipbuilding sector that is representative of large-scale industrial products, a quality management method of amount of deformation in each process represented by welding work is investigated. Unlike a general machine product, in shipbuilding sector, size of material in itself is large (some 10m - some 100m scale) and amount of deformation is also large accordingly. Therefore, a study has been pushed forward about measurement technique to meet the demanded precision of the quality control in the field of shipbuilding (Nomoto, et. al, 1997, Takeichi, et. al, 2000). Furthermore, after 2000, price reduction and the precision improvement of laser scanner have been realized and the examples that applied the laser scanner to the precision evaluation of deformation in the field of shipbuilding came out (Hiekata and Matsuo, 2012, Ono, 2012). But, in these studies, deformation before and after the single welding process has been compared, and there are few examples that measured the deformation in each real welding process in multiple processes.
In this paper, we have executed precise three-dimensional measurement for the hatch covers of which shape is comparatively simple among the ship members, and discuss about its quality management method. The hatch cover means an opening and closing type cover to be installed in the upper part of hatch to do putting in and out of the freight on the deck
of the ship. There are following three types as the representative measurement equipment for large-scale industrial products; a Stereo Image Measurement, a Total Station (TS), and a Laser Scanner (LS). TS is relatively short and it is possible to execute highly precise measurement even in narrow factory, we adopted TS as the measurement equipment.
2. TARGET AND ENVIROMENT
2.1 Measurement Target
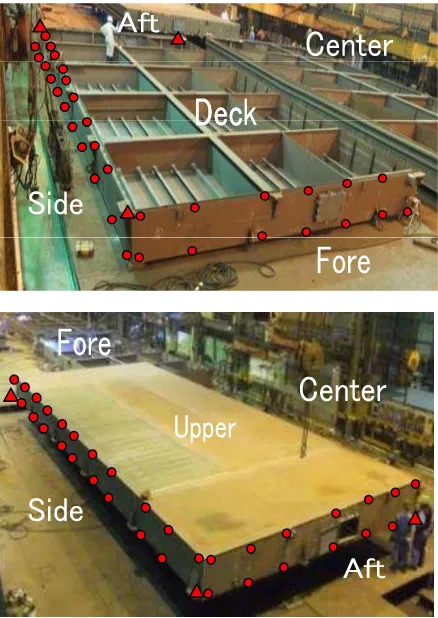
Dimension of the hatch cover as the measurement object was 18m in height, 8m in width, and 0.8m in depth. In the initial process, the material is installed in opposite direction to completion, and the material is reversed and it is in the same direction as completion on the way(Fig.1). In the lower part (the top surface at the time of completion) before the inversion, a top plate has been installed from the first of the process. Inside the hatch cover, two and four longitudinal members are installed in parallel with longitudinal direction and in parallel with lateral direction of the member have been installed respectively.
We pasted a target seal on a member directly as a measurement point at the four corner points of member of outside surface of the hatch cover, the survey point with the longitudinal member, and the intermediate point between the survey points. By executing measurement at these measurement points, we tracked the relative shape deformation of the member throughout the process. We named each measurement surface as follows: Center: Center side of hull, Side: Outside of hull, The International Archives of the Photogrammetry, Remote Sensing and Spatial Information Sciences, Volume XL-4/W5, 2015
2 Aft: Rear side of hull, Fore: Forward side of hull, Upper: Upper part (Top plate part) of hull at the time of completion, and Deck: Lower part (Opening part) of hull at the time of completion. At the Center side and the Side side, 22 points in total for 11 points at each of upper and lower part, and at the Fore side and the Aft side, 14 points in total for 7 points at each of upper part and lower part, that is, 72 points in total, we set up the measurement points. Installing position of TS was set at the diagonal two places. We measured the dimension from the setting places at the Center/Aft side and Side/Fore side before inversion, and after inversion, we set the TS at the Center/Fore side and Side/Aft side.
Figure 1. The shipyard and Hatch Cover ●Measurement Points ▲Reference Points
2.2 Welding Process
We took five processes (i,…,v) from temporary welding to distortion removing welding as the measurement objects (Fig.2). Member was moved at each welding process and inverted between manual welding processes. Measurement by TS was executed before and after the each welding process and movement. Comparison of each process was executed between [A] before auto welding and [B] after auto welding (Comparison I) and [A] before auto welding and [F] after inverted welding (Comparison II), respectively.
2.3 Shipyard Environment
Since the hatch cover moves at each welding process, we executed measurement while changing the setting point of TS at each welding process (Fig.2). Since the factory inside was narrow and the wall was close to the both side, and there was other hatch covers in the anteroposterior direction, the place to set up TS was strictly limited (Fig.1).
3. MEASUREMENT METHOD
3.1 Measurement Parts
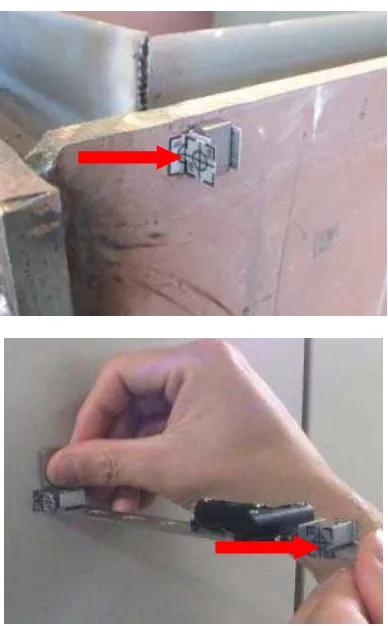
We used NET1200 (Sokkia’s First class total station) for measurement. Since the target seal comes off by abrasion or welding at the edge part, we pasted the seal at the point approximately 50mm apart from the edge part. Because it is impossible to measure diagonal distance when the incident angle at the time of measurement becomes shallow, we measured the intersection point by setting the L-type target in a right angle against the seal target (Fig.3). As for measurement point that is impossible to collimate directly, we measured the target by off-setting horizontally and subtracted the offset value after coordinate conversion.
Figure 2. Hatch Cover Movement at shipyard Auto Welding, Manual Welding、 Turn、 Straitening
[A]Before Auto Welding、[B] After Auto Welding、[C] Before Manual Welding、[D] After Manual Welding、[E] Before
Turned Welding、[F] After Turned Welding、[G] After Straitening Welding
Auto Welding Area Manual Welding Area (Before Turn)
Manual Welding Area
(After Turn) Straitening Area
Wall Wall The International Archives of the Photogrammetry, Remote Sensing and Spatial Information Sciences, Volume XL-4/W5, 2015
Figure 3. L-type target and Offset target
3.2 Coordinate Transform
Since the object moves at each process, we took the four corners as the reference points that are expected to have less deformation inside the hatch cover. And compared the deformation by applying a coordinate conversion on measured data. Taking the 3 points at the edge part as the conversion reference point for coordinate conversion, we executed rotating coordinate conversion (1).When we executed coordinate conversion taking the reference point at a certain side block (example: Block I (Center/Fore)), deformation was not represented correctly at the opposite side block (example: Block II (Side/Aft). This is because that, when amount of deformation at the conversion reference point is large, the amount of deformation at the reference point affects to the opposite side block and the relative deformation becomes unknown. Therefore, we extracted the relative deformation by executing coordinate conversions separately at the Center/Fore surface (Block I) and at the Side/Aft surface (Block II) (Fig.4).
(1)
3.3 Diagram Representation
When representing the amount and direction of deformation before and after each process, representation that is possible to recognize the spatial position inside the member at each measurement point is required.
In order to make possible to understand spatially the deformation of each measurement point, we represented the
amount of deformation in vertical and lateral direction for horizontal direction with “Direction of vector” (Fig.5). For height direction, we represented the amount of deformation with “Size of circle” shown by diameter of circle, distinguish the upper (Upper) and lower (Deck) direction at the time of completion by color.
Figure 4. Coordinate Transform blocks
Figure 5. Representation of Horizontal Deformation and Vertical Deformation
Horizontal Deformation [Direction of the vector]
X Y
Vertical Deformation [Size of the circle]
Down Deformation Up Deformation
Block
Block
4
4. RESULT AND DISCUSSION
4.1 Measurement state of measurement target
Since measurement time of one process was 1 - 1.5 hours limited to the time between processes or lunch time, efficient measurement was required. Therefore, we set up the TS at 2 points of four corners that is possible to measure 2 surfaces from single TS point. Although we could executed measurement in all of 7 processes, we could not measure deformation in 2 processes in which allowed measurement time was short ([C] before manual welding, [E] before inverted welding). By making the surface to be measured from TS to be the same one every time, we secured accuracy with a short measurement time.
We had to measure the members that move inside the narrow factory with few TS. Since we also could measure the target that incident angle is shallow or there is a shielding substance by using L-type target and offset target, we could obtain a good result that ratio of miss-measurement was about 5%(Table1).
Table1. Measurement method
4.2 Deformation amount in each welding process
I. [A]Before Auto/[B]After Auto Figure 6
Auto welding is executed along the longitudinal member inside the hatch cover, and heat input is the largest among all the processes. At the Center side and the Side side, deformation in height direction (in-surface deformation) became greater to the center part. Also the Force side and Aft side, deformation in height direction was great. Furthermore, in horizontal direction, deformation directing from opening part to the center of hatch cover was great and a deformation outside surface such that top plate part becomes narrow was generated.
II. [A]Before Auto/[F]After Turn Figure 7
In order to calculate amount of work for removing distortion, we compared deformation before auto welding with deformation after inverted welding that is before distortion removing welding. In height direction, the state was that amount of deformation at the time of auto welding was remained. Especially, similar to I, deformation at the Center side that has been fabricated by a single plate was the largest. In horizontal direction, deformation that becomes short along the side surface was observed. It is thought that this is because the hatch cover constricts by heat input.
Figure 6. [A]Before Auto/[B]After Auto Comparison
Figure 7. [A]Before Auto/[F]After Turn Comparison
ALL Measurement Method
Direct L-type Offset Unmeasurable
360 Points
40 Points
285 Points
24 Points
11 Points
100% 11% 79% 7% 3%
5. CONCLUSIONS
In this paper, we could comprehend a deformation of the large industrial products in a small factory by using TS and target seal. Since a measurement speed was improved particularly with measuring precision, we could clarify a deformation in each process which was not frequently carried out up to the present. Furthermore, setting a measurement point at end part in component as a reference point of coordinate conversion was valid to comprehend a deformation tendency for hull component in each process. By executing a conversion by each block in particular, there was no influence on the deformation volume for a deviated measurement point when a measurement point as standard was largely deformed or inclined. It would be required to examine an application method for process improvement based on PDCA cycle in terms of deformation volume by each welding process selected for the working procedure. Specifically, it is necessary to examine a difference between design drawing (CAD) and final deliverable and also a reflecting method for design or work process.
6. REFERENCES
Nomoto, T, et al., 1997, Basic Studies on Accuracy Management System Based on Estimating of Weld Deformations, Techno marine: bulletin of the Society of Naval
Architects of Japan, 181, pp. 249-260.
Takechi. S, et al., 2000, Studies on the Block Positioning Metrics System for the Hull Erection Stage, Techno marine:
bulletin of the Society of Naval Architects of Japan, 188, pp.
399-408.
Hiekata K, and Matsuo, A., 2012, Application to shipbuilding industry of the three-dimensional measurement, KANRIN, 40, pp. 2-5.
Ono, T., 2012, Lecture 6 Bundle adjustment: Bundle adjustment and the camera calibration in precision industrial measurement,
Photogrammetric Engineering & Remote Sensing, 51, pp.
387-396.
7. ACKNOWLEDGEMENTS
Measurement experiment field was kindly provided to IWAKITEC Co., Ltd.
![Figure 6. [A]Before Auto/[B]After Auto Comparison](https://thumb-ap.123doks.com/thumbv2/123dok/3268816.1400805/4.595.318.525.74.403/figure-a-before-auto-b-after-auto-comparison.webp)
