CLIMATE ABSOLUTE RADIANCE AND REFRACTIVITY OBSERVATORY
(CLARREO)
J. Leckeya,*
a
National Aeronautics and Space Agency (NASA) Langley Research Center (LARC), Bldg. 1202 MS 468, Hampton, Virginia 23681 USA–[email protected]
THEME: Atmosphere, weather and climate (ATMC)
KEY WORDS: Infrared, Far-Infrared, Radiance, Climate, Atmosphere
ABSTRACT:
The Climate Absolute Radiance and Refractivity Observatory (CLARREO) is a mission, led and developed by NASA, that will measure a variety of climate variables with an unprecedented accuracy to quantify and attribute climate change. CLARREO consists of three separate instruments: an infrared (IR) spectrometer, a reflected solar (RS) spectrometer, and a radio occultation (RO) instrument. The mission will contain orbiting radiometers with sufficient accuracy, including on orbit verification, to calibrate other space-based instrumentation, increasing their respective accuracy by as much as an order of magnitude. The IR spectrometer is a Fourier Transform spectrometer (FTS) working in the 5 to 50 µm wavelength region with a goal of 0.1 K (k = 3) accuracy. The FTS will achieve this accuracy using phase change cells to verify thermistor accuracy and heated halos to verify blackbody emissivity, both on orbit. The RS spectrometer will measure the reflectance of the atmosphere in the 0.32 to 2.3 µm wavelength region with an accuracy of 0.3% (k = 2). The status of the instrumentation packages and potential mission options will be presented.
* Corresponding author.
1. INTRODUCTION
According to the Fifth Assessment Report of the Intergovernmental Panel on Climate Change (IPCC)– “Each of the last three decades has been successively warmer at the Earth’s surface than any preceding decade since 1850. The period from 1983 to 2012 was likely the warmest 30-year period of the last 1400 years in the Northern Hemisphere” (IPCC 2013). Measuring climate change on a decadal time scale is vital to both assessing model accuracy and attributing climate change to its source (IPCC 2012). While critically important, the small decadal scale signals of climate change are dwarfed by short-term natural variability and remain out of reach for the majority of current global satellites. The Climate Absolute Radiance and Refractivity Observatory (CLARREO) mission seeks to increase the absolute accuracy of climate change measurements using SI traceable standards on orbit.
Figure 1 shows the National Climate Data Center (NCDC) Merged Land-Ocean Surface Temperature Analysis (MLOST) temperature trend data broken into 3 distinct time periods: 1911-1940, 1951-1980, and 1981-2012 (IPCC 2013). It is clear from these results that the last period, 1981-2012, shows the strongest warming per decade of the entire data set while the period 1951-1980 was the least warming. During the period 1979-2012, the NCDC MLOST global mean surface temperature (GMST) trend was 0.151 + 0.037oC/10y compared to only 0.081 + 0.013 oC/10y from 1901-2012 (Vose et al., 2012b). In addition to global surface warming, these data show large decadal and interannual variability (IPCC 2013).
Figure 1. NCDC MLOST GMST trends (oC/10y) over three separate time periods: 1911-1940, 1951-1980, and 1981-2012
Figure 2. Surface Temperature Trends from three separate climate model data sets (HadCRUT4, MLOST, and GISS) for
the period 1901–2012 (IPCC 2013) where white signifies incomplete data
The surface temperature trend data sets from the Hadley Centre/Climate Research Unit (HadCRUT4), MLOST, and the Goddard Institute for Space Studies (GISS) are shown in Figure 2. The GMST trends for the period 1901-2012 are 0.075 + 0.013oC/10y, 0.081 + 0.013oC/10y, and 0.083 + 0.013oC/10y from HadCRUT4, MLOST, and GISS, respectively. It is clear that all of the data sets show surface temperature warming and also closely agree with each other for most geographic regions; however, a 15% uncertainty remains on the absolute accuracy of the warming trend due to uncertainties in climate models and a need for further model validation with observations. From the plots we can also see discrepancies in the warming trend by as much as a factor of two (south central South America) between the climate models. With the increase in accuracy from a true climate observing system, these uncertainties will be reduced and the precise amount of warming can be confirmed.
In 2007, the National Research Council Decadal Survey on Earth Science and Applications from Space identified the level of uncertainties present in climate variables as a problem for both future policy making and risk management strategies. The Decadal Survey also identified the need to make measurements with high enough accuracy to be able to resolve small climate change signals over decadal time scales (NRC 2007). One of the major challenges in Earth observing satellites is the uncertainty in the calibration over long time scales. This is a challenge that CLARREO will address by carrying an absolute calibration standard onto orbit. With the goal of making
measurements to resolve decadal scale changes in climate, the requirements of CLARREO are driven by long term absolute accuracy rather than typical instantaneous noise requirements. The CLARREO benchmark measurements as defined in the NRC Decadal Survey are:
1. Spectrally resolved infrared (IR) radiance emitted from Earth to space measured to an accuracy of 0.07 K (k = 2).
2. Spectrally resolved nadir reflectance of reflected solar (RS) radiation measured to an accuracy of
0.3% (k = 2).
3. Global Navigation Satellite Systems Radio
Occultation (RO) measurement of the phase delay of the transmitted GNSS signal occulted by the
atmosphere from low Earth orbit for attitudes (5 km to 20 km) and with an accuracy of 0.06% (k = 2).
The IR, RS, and RO measurements were strategically chosen to target the least understood climate forcings. The primary climate variable targets (listed with the corresponding instrument noted) are: the atmospheric distribution of temperature and water vapor (IR, RS, and RO), broadband reflected (RS) and emitted (IR) radiative fluxes, surface albedo (RS), temperature (IR), emissivity (IR), and cloud properties (RS and IR). In combination, the CLARREO data will resolve with a high degree of confidence the rate at which climate change is occurring, improve future climate modeling, and improve the absolute accuracy of currently orbiting weather and climate satellites by providing an absolute reference calibration on orbit.
Figure 3. IPCC AR4 Climate Model Feedback Maps showing temperature, water vapor, Albedo, and Cloud feedbacks (Soden
2008)
Figure 4. Accuracy of decadal trends of current earth observing missions and the potential improvement CLARREO will yield
(Wielicki 2013)
Figure 4 shows the accuracy trend of cloud radiative forcing per decade as a function of the length of observed trend in years. Current missions are shown in Figure 4, including CERES and MODIS/VIIRS, where it is clear that the length of time necessary to reach 1% accuracy in cloud radiative forcing is 30+ years. This length of time is reduced by nearly 20 years with the addition of an instrument with CLARREO’s absolute accuracy (Wielicki 2013). Similar analyses can be made for a variety of climate variables where the length of time necessary to achieve a specific absolute accuracy is dramatically reduced with the introduction of CLARREO’s instruments.
2. INFRARED SPECTROMETER
Figure 5. IR Spectrometer concept showing the variety of validation sources that are routinely viewed
The CLARREO Infrared Spectrometer is a Fourier transform spectrometer (FTS) over the spectral range 5 µm–50 µm. The significance of the IR spectrometer is its collection of SI-traceable verification standards that are launched with the spectrometer onto orbit. Traditional earth observing missions carefully calibrate their sensors before launch and make the assumption that nothing substantial changes during launch and deployment of the instrument. Alternatively, CLARREO will not only undergo careful calibration before launch, but will undergo regular on-orbit re-calibrations using the onboard standards.
The IR instrument is shown in Figure 6 in an exploded view consisting of the two detector assemblies, the optical and Fourier transform spectrometer hardware, and the scene select mechanism. The scene select mechanism looks at 5 different scenes iteratively: the nadir Earth view (up in Figure 6), 45ooff nadir view, deep space view (cold), verification blackbody, and ambient blackbody. A rotating mirror is inside the center of the scene select mechanism to rapidly (second timescale) switch between the different possible views. The system is calibrated using the deep space view and the ambient blackbody and then the calibration is verified using the verification blackbody.
Figure 6. IR Spectrometer exploded view with major subsystems labelled
temperature of the blackbody to an absolute scale. Although a temperature probe’s calibration may driftwith time, the material melt points do not drift and thus the temperature probes will be recalibrated with every material melt.
Figure 7. Optical functional diagram for the IR CLARREO instrument
The optical functional diagram is shown in Figure 7. The quantum cascade laser can be used to illuminate the integrating sphere (to verify instrument lineshape) or to act as a high intensity source to send into the blackbodies to check reflection. The orientation of the scene select is passed through the fore optics and into the FTS. The core of the FTS is a Caesium Iodide beam splitter and a scan mechanism to create an interferogram. The output of the FTS is then split to a pair of detectors. The Mercury Cadmium Telluride (MCT) detector is used for mid-IR detection and a pyroelectric detector is for far-IR detection. Overall, the IR FTS spectrometer has enough verification standards to act as a SI-traceable calibration standard on orbit.
3. REFLECTED SOLAR SPECTROMETER
Figure 8. RS Spectrometer exploded view
The Reflected Solar (RS) spectrometer consists of two separate spectrometers as may be seen in Figure 8. The first operates over the spectral range 320 nm – 640 nm and the second operates from 600 nm – 2300 nm, where both have 4 nm spectral sampling and have the goal of less than 0.3% calibration accuracy. The aggressive absolute accuracy
requirement is nearly an order of magnitude better than any comparable instrument. The spectrometers observe the Earth’s surface and measure radiance that can be converted to reflectance by making similar lunar and solar measurements and taking the ratio of the measurements with geometrical effects removed. This variety of measurements is especially difficult to make because the signals can vary by an order of magnitude between the brightest and dimmest signals. The overall RS spectral range was chosen so that CERES and VIIRS can be cross calibrated by the CLARREO instrument. This objective will require that the RS instrument have sufficient pointing accuracy as to definitively know that the same part of the Earth will be measured by each of the different missions to allow for a proper intercalibration.
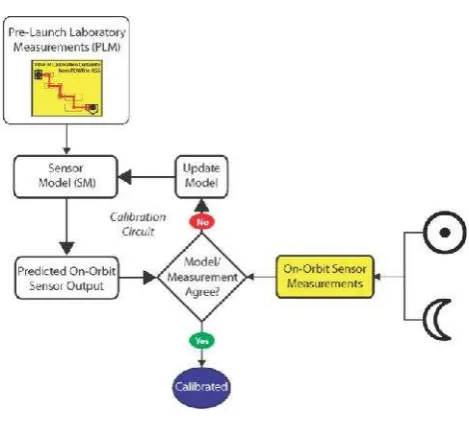
Figure 9. RS Calibration approach.
In order to meet these required accuracy standards, a rigorous calibration approach must be created. The RS instrument calibration starts with a series laboratory measurements that will all be inputs to a sensor model. Prior to launch, radiance and irradiance modes will be thoroughly calibrated including all of the necessary geometrical measurements for a conversion to reflectance. After the instrument is launched, pre-launch measurements incorporated into the sensor model will be compared to solar absolute irradiance measurements to demonstrate post launch accuracy and prove that nothing significantly changed during launch. Stellar and lunar measurements post-launch will all be incorporated into the sensor model so that the model can evolve with time and still retain absolute accuracy. If discrepancies arise between the pre-launch model predictions and measurements post-pre-launch, the model will need to evolve based on current measurements. Once the model prediction matches the on orbit measurements, the sensor will be fully calibrated. The solar and lunar measurements will yield information on temporal changes in the sensor over time once an initial model agreement takes place.
4. RADIO OCCULTATION
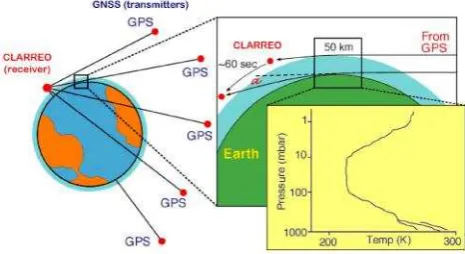
ability to perform radio occultation using data from multiple satellites. The general concept is that the GPS signals are refracted as they pass through the atmosphere and undergo Doppler shifts that can be measured. The frequency shifts are a function the density of the atmosphere and the distance the signal traverses through the atmosphere. Figure 10 illustrates the full RO concept beginning with a Global Navigation Satellite System (GNSS) satellite signal that is transmitted through the atmosphere as it rises or sets behind the Earth’s limb. The Doppler shift is related to how the signal is bent and is converted to an angle,in Figure 10. The angle can be used to extract a refractivity profile that is then translated into the temperature, pressure, and humidity in the atmosphere.
Figure 10. Radio Occultation Instrument Concept
Currently, there are only two frequencies, L1 and L2, at which the GPS satellites operate. There are more frequencies that future GPS systems (2016+) will use for operation that CLARREO would benefit from; however, the minimum scientific goals can be accomplished using ~2000 occultation measurements per day of the L1 and L2 frequencies. These occultation signals will be collected using a pair of array antennas, one in the ram and one in the wake on orbit. A variety of RO options are currently under investigation including laser ranging and other techniques that will provide the RO measurements combined with precise on orbit location measurements necessary to meet the CLARREO science objectives.
5. MISSION OPTIONS
A variety of launch configurations have been explored ranging from multiple free-flying independent satellites, a single satellite containing all the instruments, and an option to put versions of the instruments on the international space station (ISS). In the President’s FY16 budget, a version of the ISS option has been specifically identified as a budget line item. If the budget is passed in its current form, the construction of an ISS CLARREO mission could begin in FY16 and launch several years after that. Once CLARREO is on orbit the climate record will be measured with sufficient accuracy to resolve climate change over decadal time scales.
ACKNOWLEDGEMENTS (OPTIONAL)
I would like to acknowledge the work of the CLARREO team. I would like to thank Bruce, Costy, Dave, and Rich for helpful discussions and suggestions.
REFERENCES
IPCC, 2007a: Climate Change 2007: “The Physical Science Basis," Contribution of Working Group I to the Fourth Assessment Report of the Intergovernmental Panel on Climate Change [Solomon, S., D. Qin, M. Manning, Z. Chen, M. Marquis, K.B. Averyt, M. Tignor and H.L. Miller (eds.)]. Cambridge University Press, Cambridge, United Kingdom and New York, NY, USA
IPCC, 2013: Climate Change 2013: “The Physical Science Basis”, Contribution of Working Group I to the Fifth Assessment Report of the Intergovernmental Panel on Climate Change [Stocker, T.F., D. Qin, G.-K. Plattner, M. Tignor, S.K. Allen, J. Boschung, A. Nauels, Y. Xia, V. Bex and P.M. Midgley (eds.)]. Cambridge University Press, Cambridge, United Kingdom and New York, NY, USA, 1535
NRC, 2007: “Earth Science and Applications from Space: National Imperatives for the Next Decade and Beyond," The National Academy Press, 428
Soden, B. J., I. M. Held, R. Colman, K. M. Shell, J. T. Kiehl and C. A. Shields, 2008:“Quantifying climate feedbacks using radiative kernels,” Journal of Climate, 21, pp. 3504- 3520 Vose, R. S., et al., 2012b: “NOAA’s Merged Land-Ocean Surface Temperature” Analysis. Bull. Am. Meteor. Soc., 93, 1677–1685