USING LIGHT-AT-NIGHT (LAN) SATELLITE DATA FOR IDENTIFYING CLUSTERS
OF ECONOMIC ACTIVITIES IN EUROPE
1N. A. Rybnikova a, *, B. A. Portnov a
a
Dept. of Natural Resources and Environmental Management, Faculty of Management, University of Haifa, Mt. Carmel, 31805, Israel – [email protected], [email protected]
KEY WORDS: Economic activities (EAs), clusters, satellite photometry, Light-at-Night (LAN), Europe, Nomenclature of
Territorial Units for Statistics (NUTS)
ABSTRACT:
Enterprises organized in clusters are often efficient in stimulating urban development, productivity and profit outflows. Identifying clusters of economic activities (EAs) thus becomes an important step in devising regional development policies, aimed at facilitating regional economic development. However, a major problem with cluster identification stems from limited reporting of specific EAs by individual countries and administrative entities. Even Eurostat, which maintains most advances regional databases, provides data for less than 50% of all regional subdivisions of the 3rd tier of the Nomenclature of Territorial Units for Statistics (NUTS3). Such poor reporting impedes identification of EA clusters and economic forces behind them. In this study, we test a possibility that missing data on geographic concentrations of EAs can be reconstructed using Light-at-Night (LAN) satellite measurements, and that such reconstructed data can then be used for the identification of EA clusters. As we hypothesize, LAN, captured by satellite sensors, is characterized by different intensity, depending on its source – production facilities, services, etc., – and this information can be used for EA identification. The study was carried out in three stages. First, using nighttime satellite images, we determined what types of EAs can be identified, with a sufficient degree of accuracy, by LAN they emit. Second, we calculated multivariate statistical models, linking EAs concentrations with LAN intensities and several locational and development attributes of NUTS3 regions in Europe. Next, using the obtained statistical models, we restored missing data on EAs across NUTS3 regions in Europe and identified clusters of EAs, using spatial analysis tools.
1
The paper is based on the article prepared for the Special Issue of Letters in Spatial and Resource Sciences on, “Housing Market, Regional Mobility & Economic Growth – Dutch-Israeli Workshop”.
* Corresponding author.
1. INTRODUCTION
In studies of urban and industrial clustering, the identification of clusters’ geographic boundaries is an important research task (Portnov & Erell, 2001; Cortright, 2006). Commuting patterns are often used for such identification. According to this approach, a cluster is defined as a group of urban settlements or places of employment located within a commuting range of each other (Portnov & Schwartz, 2009). According to another approach, geographic contiguities of employment, productivity, wages, or population density are used for cluster identification (Cortright, 2006; Desrochers & Sautet, 2004; Ketels & Memedovic, 2008). Alternatively, various indices of spatial association (such as, local Moran’s I and Geary’s C) can be used for the identification of geographic clusters of economic activities (EAs) (Feser et al., 2001; Kies et al., 2009; Campos & Prophero, 2012). However, these indices do not perform well if geographically referenced information on neighboring localities is sparse or unavailable (Morgenroth, 2008).
In the past years, Light-at-Night (LAN) data, generated by the U.S. Defense Meteorological Satellite Program (US-DMSP), have been used as a proxy for information on population densities (see inter alia Sutton, 1997; Imhoff et al., 1997; Amaral et al., 2006); economic and technological performance (see inter alia Elvidge et al., 1997; Sutton et al., 2007; Henderson et al., 2009; Ghosh et al., 2009, 2010; Chen & Nordhaus, 2010; Zhao et al., 2011; Kulkarni et al., 2011;
Mellander et al., 2013), health studies (Kloog et al., 2007, 2009, 2010) (see Ghosh et al., 2013 and Cauwels et al., 2014 for detailed reviews of various LAN-related research applications).
In the present study, we propose and test a two-step approach to the identification of clusters of EAs using LAN satellite images:
First, using freely-available LAN data, we restore missing information on the geographic concentrations of EAs located at EU NUTS3 regions. The underlying assumption behind this approach is that LAN, emitted from geographic concentrations of EAs, is characterized by different intensities, depending on its source – industries, commerce, services, etc. (Rybnikova and Portnov, 2014). As a result, LAN intensities can become a marker for different types of EAs, helping to identify the aerial concentrations of these activities and delineate their geographic clusters. At this stage, we used different concentration indices (such as density of the employed and gross value added) to determine which of them can best be "predicted" by average LAN intensities, and thus to use it to reconstruct data on specific EAs for NUTS3 regions with missing observations.
estimated values as the selection threshold for cluster delineation.
Although there are some empirical studies exploring association between LAN levels and aggregated economic sectors (see for instance Doll et al., 2006), to the best of our knowledge, there have been no attempts to use LAN intensities for reconstructing EA data for specific types of EAs and to use these data to identify the geographic clusters of these activities, such as that we attempt in the present study, which methodology and results are discussed below.
2. DATA AND METHODS
2.1 Study area
In the present study, we use data for Europe, the world’s second-smallest continent (after Australia), which land area is about 23.0 million km2 and combined population is about 740 million residents (WA, 2014).
Since the early 1970’s, the Eurostat established the Nomenclature of Territorial Units for Statistics (NUTS) used to collect and analyze regional statistical data. According to this nomenclature, all the member states of the EU, EU candidate countries and European Free Trade Association (EFTA) countries (i.e., Iceland, Norway, Principality of Liechtenstein, and Switzerland) are divided into a hierarchical system of NUTS units, ranging from NUTS1, which represent entire countries or regions, to NUTS2 and NUTS3 units, which are concomitant with regions, provinces or sub-regions (EP, 2014b). In the present study, we use the most detailed, NUTS3 classification, formed by 1,315 NUTS3 regions in the year-2010.
Although data on specific EAs, available from the Eurostat Portal (EP, 2014a), are, apparently, best of this kind in the world, even this, fairly comprehensive, data source is essentially sparse in its geographic coverage. Thus, according to the Eurostat database, out of 1,315 NUTS3 regions in 2010, data on specific EAs are available for about 600 regions only, that is, for less than 50% of all regional subdivisions.
2.2 Research variables and data sources
In order to represent different types of EAs in multivariate analysis, we tested several alternative indices, including density of the employed (persons per km2) and gross value added by EA per employee (€ per person); this should help to reveal EA-ALAN association for EAs with different rates of resources used in their output production. The information on these indices for NUTS3 regions with available EA data were obtained from the Eurostat Portal (EP, 2013).
Data on LAN intensity, used in the analysis as an explanatory variable, were obtained from the U.S. Defense Meteorological Satellite Program (DMSP, 2014). The satellite images, used in calculated average LAN levels for individual NUTS3 regions by applying pixel-by-pixel averaging and using the “zonal statistics” tool in the ArcGIS10.xTM
software.
Geographic and socio-economic features of geographic areas are known to contribute to the locational patterns of EAs. For instance, agriculture is often dependent on the latitude, average temperatures and the amount of precipitation (Reidsma et al., 2010), while good roads are needed to facilitate trade (Duranton et al., 2013). Finance, professional and scientific activities are often “tied” to major cities, which are loci of population density and productivity (Henderson, 2010; Cuadrado-Roura & Rubalcaba-Bermejo, 1998). Due to these considerations, we added the following factors as explanatory variables (in addition to LAN), as regional determinants of EAs' concentrations: latitude (decimal degrees); July and January average temperatures (°C); distances from NUTS3 centroids to the nearest major city, to the seashore, to the main road, to the rail, and to the river (km); population density (persons per km2), and gross domestic product (€ per capita); these data were obtained by combining data from the ESRI ArcGIS TM database (ESRI, 2013) and the Eurostat Portal (EP, 2013), or calculated them in the ArcGIS10.xTM software.
For descriptive statistics on research variables, see Appendix.
2.3 Statistical analysis
EAIxzi = value of EAs' index z (i.e., employment density or gross value added), estimated for the xth EA in the ith region;
b0xz…b3xz = regression coefficients;
ln(LAN) = natural logarithm of LAN (dimensionless units);
L = vector of locational attributes of NUTS3 regions, such as latitude (dd); distances to the seashore, to the main road, to the rail, to the river (km); average January and July temperatures (oC);
SE = vector of socio-economic attributes, such as GDP per capita and population density;
Ɛ = random error term.
The models’ performance was compared using adjusted R2 values as a measure of regression fit. Similarly, to assess the strength of LAN contribution to the observed variation of EAs vs. that of other predictors, we applied the F-test of R2-change, with F-values larger than 3.0 (P<0.05) being considered as a statistically significant improvement.
3. RESEARCH RESULTS
3.1 EA predictions
Tables 1-3 report OLS models for specific types of EAs, for which especially good explanatory power of the models could be obtained (R2-adj.>0.8); these are 3 of 11 reported by Eurostat Portal EAs, viz: "Professional, scientific and technical activities; administrative and support service activities" (Table 1); "Public administration, defense, compulsory social security; education; human health and social work activities" (Table 2); and "Arts, entertainment and recreation; other service activities; activities of households as employers; activities of extra-territorial organizations and bodies" (Table 3). As Tables 1-3 show, the models reported help to explain up to 90% of the EA variation, performing especially well for professional & scientific activities (R2-adj.=0.901, F=702.976; P<0.001).
Variable Professional activities
Table 1. Factors affecting the density of employed in
professional activities (persons per km2)
Notes: *, ** and *** indicates a 0.1, 0.05 and 0.01 significance levels. a Unstandardized regression coefficient; b
t-statistic; c Standard error of the estimate; dd=decimal degrees. e Data transformed using the
Box-Cox transformation procedure (see Appendix).
Variable
Table 2. Factors affecting the density of employed in public
administration (persons per km2) Note: see footnote to Table 1
In these models, LAN emerged with the expected sign, indicating that densities of the employed in these activities across NUTS3 regions tend to increase with LAN intensities, being especially strong for public administration (t>55.0; P<0.001; see Table 2).
Table 3. Factors affecting the density of employed in arts &
entertainment (persons per km2) Note: see footnote to Table 1
3.1.1 Assessing OLS models: In the reported models, LAN
appears to be a strong positive predictor for the EAs analyzed, contributing to about 40% of the explained variance in addition to all the other predictors (see Table 4).
Prediction
activities 0.233 1634.749*** 0.076 66.633*** Public
administration 0.396 3097.387*** 0.080 89.661*** Arts &
entertainment 0.236 1371.652*** 0.125 90.960*** Table 4. F-test of R2-change for different prediction models
Note: *** Indicates a 0.001 two-tailed significance level
Predicted EAs Model for (1)
Model for (2)
Model for (3) (1) Professional
activities 0.540 1.275*** 0.715***
(2) Public
administration 1.187*** 0.329 1.435***
(3) Arts &
entertainment 0.719*** 1.519*** 0.558
Table 5. Standard errors of the estimates for different prediction models
Note: *** Indicates that probabilities of similarities for both means and medians (computed for t-test and Wilcoxon test correspondingly) between series of residuals (obtained as differences between actual EAs'
values and their estimates via different prediction models) are too low (e.g. <<0.001)
3.1.2 Model cross-validation: To determine whether our model
estimates are sufficiently accurate and can be used for forecasting, we selected a random sample of about 10% of cases, estimated the models anew based on the rest of the 90% observations, and calculated the model predictions for the control cases. Then, we applied the t-test to determine whether there are statistically significant differences between actually observed values in the “control” subset of regions and our model estimates. The results of the test are reported in Table 6, which shows that the mean differences from zero are statistically insignificant in all the models (P>0.51), thus indicating that our models are essentially robust.
Table 6. t-test for differences in the regression models’ residuals (Test value – difference from zero; see text for explanations) Note: The regression residuals are tested for the statistical significance
of differences between the predicted and observed values. The procedure of "Select cases" in SPSS software was performed, random
sample of approximately 10% cases was selected
3.2 Mapping clusters of EAs
We used the models reported in Tables 1-3 to reconstruct densities of EAs for NUTS3 regions with missing data. For brevity's sake, we report here the calculations, performed for only one type of EA – for professional activities (see Table 1). The available from Eurostat Portal and reconstructed EA data are shown in Fig. 1.
A
B
Figure 1. Density of employed in professional activities (persons per km2): A – Data available for 2010; B – Predicted
values
Notes: Both available and estimated values are grouped into five classes using the quintile method
Hence clusters are characterized, according to our operational definition, by high concentrations of EAs and similarity of neighbouring observations, we carried out our analysis in several steps. First, we identified standing-out concentrations of EAs using the reconstructed data on their geographic concentrations, and by setting a top 5% concentration criterion. Second, we applied the Local Moran's I statistic to the reconstructed EA maps, aiming to identify regions being similar in terms of EAs’ densities.
Geographic boundaries of EAs’ clusters may be sensitive to the choice of territorial units, reflecting the well-known modifiable aerial unit problem or MAUP (Openshaw, 1984; Portnov, 2012; Jacobs-Crisioni et al., 2014). Therefore, we applied kriging interpolation to identify clusters’ boundaries more precisely.
In particular, kriging smoothing was applied to both reconstructed values of EAs, using the above mentioned top 5% concentration criterion, and to the observed local Moran's I values, using only positive and statistically significant values of this index (Z-Moran’s I>1.96; P≤0.05) for cluster identification. The results of both identification approaches appear to be similar, as the outcome maps featured in Figs. 2&3 demonstrate. Type of EA N of
obs.
Mean
difference Std. Dev t
Sig. (2-tailed) Professional
activities 76 -0.007 0.502 -0.081 0.936
Public
administration 81 -0.025 0.345 -0.495 0.622 Arts &
Figure 2. Clusters of professional activities, identified by kriging with subsequent application of the top 5 %
concentration criterion
Notes: The color scales are based on the normalized values of densities of the employed in EA, reconstructed using Models in Table 1. Higher values on all scales signify higher concentrations, while lower values
mark lower concentrations of EAs in the area
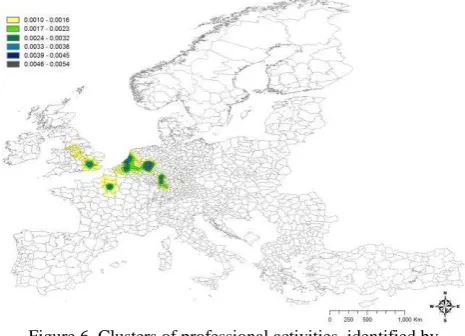
Figure 6. Clusters of professional activities, identified by combination of kriging and high positive values of local
Moran’s I index
Notes: Color scales are based on local Moran's I values, calculated for the density of the employed in a given EA
4. CONCLUSIONS
Clusters of EAs are an important research subject in economic geography. According to previous studies (Porter, 2000; Desrochers & Sautet, 2004; Cortright, 2006; Ketels & Memedovic, 2008), such clusters can create appropriate conditions for further development, helping to formulate policy tools and capitalize on such positive effects. However, a major problem with clusters’ identification often stems for the scarcity of data about specific EAs, attributed to limited reporting by individual countries and administrative entities.
In the present study we propose and empirically test a research approach which helps to reconstruct missing data on specific EAs, using readily available and/or easily calculated data on LAN intensities, as well as other general attributes of geographic areas (such as, GDP per capita, population density, and various geographical characteristics of the area – latitude, temperatures, distances to the nearest major city, etc.). According to our models, LAN, in combination with other
readily available (or easy-to-calculate) data helps to explain up to 90% of the EA variation, performing especially well for professional activities, public administration and arts & entertainment. Moreover, in all models we estimated LAN appeared to be the strongest predictor for several types of EAs, with its inclusion into the models helping to explain up to 40% of EAs variations, being unexplained by other predictors.
The idea to use LAN as a marker for specific EAs is a novel one, used in the present study, to the best of our knowledge, for the first time. The logic beyond this idea is relatively straightforward: LAN, captured by satellite sensors, is likely to differ by intensity, depending on its source, viz., industrial concentrations, agriculture, services, etc.; as a result, LAN levels can become a marker for specific EAs, helping to distinguish between different types of EAs on the ground.
Generally speaking, LAN cannot be viewed as a predictor for EAs per se, because LAN is determined by EAs’ concentrations. However, LAN intensities do appear to differ across different types of EAs, thus helping to differentiate between them. The analysis of subset of control cases for models’ verification indicated that our estimates are essentially robust, and that the LAN variable can help to differentiate between specific types of EAs on the ground and thus compete, with sufficiently accuracy, missing observations.
To the best of our knowledge, there are only a handful of studies, attempting to assess the association between economic performance and LAN levels (Ebener et al., 2005; Doll et al., 2006; Bhandari & Roychowdhury, 2011; Xiangdi et al., 2012). However, unlike the present analysis, these studies focused on aggregated economic sectors only.
In the present study, we followed the general suggestion by Ebener et al. (2005) and Bhandari & Roychowdhury (2011) that EAs’ variation can successfully be explained by LAN. However, we advance this idea by using the most precise classification of EAs, available for the EU countries, and tested alternative indices to estimate these activities concentrations in the NUTS3 regions, such as, density of the employed in the activity, GVA per employed in the activity, and corresponding location quotients, which has not been done before. We took the analysis even further and used LAN-reconstructed EAs’ data for the identification of geographic clusters of specific types of EAs using spatial analysis tools.
In our view, follow-up studies should be based on geographic units of finer resolution, available for individual countries or regions, helping to confirm the potential of usefulness of LAN for identification of EAs in finer spatial units. It is also important to mention that LAN, emitted from on-ground EAs’ concentrations differs not only by intensity, which was analyzed in the present study, but also by spectral properties, accounting for which may further improve the accuracy of EAs’ identification results and delineating their geographic clusters.
REFERENCES
Amaral, S., Monteiro, V., Camara, G., Quintanilha, J.A., 2006. DMSP/OLS night-time light imagery for urban population estimates in the Brazilian Amazon. International Journal of Remote Sensing, 27(5), pp. 855-870.
Anselin, L., 1995. Local indicators of spatial association – LISA. Geographical Analysis, 27, pp. 93-115.
Bhandari, L., & Roychowdhury, K., 2011. Night lights and economic activity in India: A study using DMSP-OLS night time images. Proceedings of the Asia-Pacific Advanced Network, 32, pp. 218–236.
Campos, C., Prothero, R., 2012. The Spatial Distribution of Industries http://www.ons.gov.uk/ons/rel/regional- trends/regional-economic-analysis/the-spatial-distribution-of-industries/art-the-spatial-distribution-of-industries.html (21 Apr. 2014).
Cauwels, P., Pestalozzi, N., Sornette, D., 2014. Dynamics and spatial distribution of global nighttime lights http://www.epjdatascience.com/content/3/1/2 (17 Mar. 2014).
Chen, X., & Nordhaus, W.D., 2010. The value of luminosity data as a proxy for economic statistics. NBER Working Paper http://www.nber.org/papers/w16317 (17 Mar. 2014).
Cortright, J., 2006. Making sense of clusters: regional competitiveness and economic development. Washington, DC: The Brookings Institution.
Cuadrado-Roura, J.R., Rubalcaba-Bermejo, L., 1998. Specialization and Competition amongst European Cities: A New Approach through Fair and Exhibition Activities. Regional studies, 32(2), pp. 133-147.
Defence meteorological satellite program (DMSP), 2014. DMSP nighttime lights data http://ngdc.noaa.gov/eog/ (13 Jan. 2014).
Desrochers, P., & Sautet, F., 2004. Cluster-based economic strategy, facilitation policy and the market process. The Review of Austrian Economics, 17(2/3), pp. 233-245.
Doll, C.N.H., Muller, J.P., Morley, J.G., 2006. Mapping regional economic activity from night-time light satellite imagery. Ecological Economics, 57(1), pp. 75-92.
Duranton, G., Morrow, P., Turner, M., 2013. Roads and Trade: Evidence from the US http://ssrn.com/abstract=2235491 (17 Apr. 2014).
Ebener, S., Murray, C., Tandon, A., Elvidge, C.D., 2005. From wealth to health: modeling the distribution of income per capita
at the subnational level using nighttime light imagery http://www.ij-healthgeographics.com/content/4/1/5 (15 Feb. 2014).
Economic and Social Research Institute (ESRI), 2013. ESRI GeoDatabase http://www.esri.com/software/arcgis/geodatabase (1 Dec. 2013).
Elvidge, C., Baugh, K., Kihn, E., Kroehl, H., Davis, E., Davis, C., 1997. Relation between satellite observed visible-near infrared emissions, population, economic activity and electric power consumption. International Journal of Remote Sensing, 18, pp. 1373–1379.
Eurostat Portal (EP), 2013. Statistical Databases http://epp.eurostat.ec.europa.eu/portal/page/portal/statistics/sear ch_database (1 Dec. 2013)).
Eurostat Portal (EP), 2014a. Geographical information:
Administrative units / Statistical units
http://epp.eurostat.ec.europa.eu/portal/page/portal/gisco_Geogr aphical_information_maps/popups/references/administrative_un its_statistical_units_1 (15 Feb. 2014).
Eurostat Portal (EP), 2014b. History of NUTS http://epp.eurostat.ec.europa.eu/portal/page/portal/nuts_nomenc lature/documents (13 Jan. 2014).
Feser, E.J., Koo, K., Renski, H.S., Sweeney, S.H., 2001. Incorporating Spatial Analysis in Applied Industry Cluster Studies. Chapel Hill: University of North Carolina.
Jacobs-Crisioni, C., Rietveld, P., Koome, E., 2014. The impact of spatial aggregation on urban development analyses. Applied Geography, 47, pp. 46-56.
Ghosh, T., Anderson, S., Powell, R.L., Sutton, P.C., Elvidge, C.D., 2009. Estimation of Mexico’s informal economy and remittances using nighttime imagery. Remote Sensing, 1(3), pp. 418–444.
Ghosh, T., Anderson, S.J., Elvidge, C.D., Sutton, P.C., 2013. Using nighttime satellite imagery as a proxy measure of human well-being. Sustainability, 5(12), pp. 4988-5019.
Henderson, J.V., 2010. Cities and development. Journal of Regional Science, 50(1), pp. 515-540.
Henderson, J.V., Storeygard, A., Weil, D.N., 2009. Measuring
economic growth from outer space
http://www.nber.org/papers/w15199 (17 Mar. 2014).
Imhoff, M.L., Lawrence, W.T., Stutzer, D.C., Elvidge, C.D., 1997. A technique for using composite DMSP/OLS city lights satellite data to map urban area. Remote Sensing of Environment, 61(3), pp. 361–370.
Ketels, C., & Memedovic, O., 2008. From clusters to cluster-based economic development. International Journal of Technological Learning, Innovation and Development, 1(3), pp. 375-392.
Kies, U., Mrosek, T., Schulte, A., 2009. Spatial analysis of regional industrial clusters in the German forest sector. International Forestry Review, 11(1), pp. 38-51.
not lung cancer in the female population of Israel. Chronobiology International, 25(1), pp. 65–81.
Kloog, I., Haim, A., Stevens, R.G., Portnov, B.A., 2009. Global co‐distribution of light at night (LAN) and cancers of prostate, colon, and lung in men. Chronobiology International, 26(1), pp. 108-125.
Kloog, I., Stevens, R.G., Haim, A., Portnov, B.A., 2010. Nighttime light level co-distributes with breast cancer incidence worldwide. Cancer Causes Control, 21, pp. 2059–2068. Kulkarni, R., Haynes, K., Stough, R., Riggle, J., 2011. Light based growth indicator: exploratory analysis of developing a proxy for local economic growth based on night lights. Regional Science Policy and Practice, 3(2), pp. 101-113.
Mellander, S., Stolarick, K., Matheson, Z., Lobo, J., 2013. Night-Time Light Data: A Good Proxy Measure for Economic Activity? CESIS Electronic Working Paper Series http://www.kth.se/dokument/itm/cesis/cesiswp315.pdf (15 Feb. 2014).
Morgenroth, E., 2008. Exploring the Economic Geography of
Ireland. ESRI: Working Paper No. 271
ww.tara.tcd.ie/bitstream/2262/27926/1/WP271.pdf (17 Apr., 2014).
Openshaw, S., 1984. The modifiable areal unit problem. In: Concepts and Techniques in Modern Geography, Monograph Series #38. Geo Books: London, 41 pp.
Porter, M., 2000. Location, competition, and economic development: local clusters in a global economy. Economic Development Quarterly, 14(1), pp. 15-20.
Portnov, B.A., 2012. Does the choice of geographic units matter for the validation of Gibrat's law? Region & Development, 36, pp. 79-106.
Portnov, B.A., & Erell, E., 2001. Urban Clustering: The Benefits and Drawbacks of Location. Ashgate, Aldershot.
Portnov, B., & Schwartz, M., 2009. Urban clusters as growth foci. Journal of Regional Science, 49(2), pp. 287–310.
Reidsma, P., Ewert, F., Lansink, A.O., Leemans, R., 2010. Adaptation to climate change and climate variability in European agriculture: The importance of farm level responses. European Journal of Agronomy, 32(1), pp. 91-102.
Rybnikova, N.A., & Portnov, B.A., 2014. Mapping geographical concentrations of economic activities in Europe using light at night (LAN) satellite data. International Journal of Remote Sensing, 35(22), pp. 7706-7725.
Sutton, P., 1997. Modeling population density with night-time satellite imagery and GIS. Computers, Environment and Urban Systems, 21(3/4), pp. 227-244.
Sutton, P.C., Elvidge, C.D., Ghosh, T., 2007. Estimation of gross domestic product at sub-national scales using nighttime satellite imagery. International Journal of Ecological Economics & Statistics, 8, pp. 5-21.
World Atlas (WA), 2014. Worldatlas: Continents http://www.worldatlas.com/aatlas/infopage/contnent.htm (15 Feb. 2014).
Xiangdi, H., Yi, Z., Shixin, W., Ryu, L., Yao, Y., 2012. GDP spatialization in China based on nighttime imagery. Geo-information Science, 14, pp. 128–136.
Zhao, N., Currit, N., Samson, E., 2011. Net primary production and gross domestic product in China derived from satellite imagery. Ecological Economics, 70(5), pp. 921-928.
APPENDIX
Variable N of
obs. Min Max Mean
Std. Dev.
Ln(LAN) 1453 -1.76 6.22 2.72 1.12
Latitude (dd) 1453 -21.14 69.56 48.15 6.37
D_seashore (km) 1453 0.11 6234.56 133.91 269.65
D_mroads (km) 1453 0.004 5992.49 20.85 277.73
D_rail (km) 1453 0.001 6225.91 32.82 335.73
D_city (km) 1453 0.70 6329.41 136.06 341.66
D_rivers (km) 1453 0.10 2689.74 287.00 329.90
TJuly (oC) 1453 7.50 36.00 18.86 3.92
TJan (oC) 1453 -11.50 18.00 2.71 3.62
Elevation (m) 1453 -4.00 1913.00 185.03 242.56
Ln(GDPpc) (€) 1304 7.38 11.95 9.88 0.64
Population density
(persons per km2) 1415 0.60 18088.27 348.16 865.78 Professional
activities (persons per km2)
735 0.02 888.50 18.36 57.42
Professional activities, λ= -7.271E-02g
735 -4.77 5.36 0.95 1.72
Public administration (persons per km2)
831 0.12 3684.83 46.12 167.39
Public administration, λ=5.186E-01g
831 -2.47 4.76 1.86 1.04
Arts & entertainment (persons per km2)
735 0.01 377.96 9.21 25.71
Arts & entertainment, λ=1.392E-01 g
735 -5.64 4.97 0.60 1.62
Descriptive statistics of the research variables