1
SPATIAL DEFORESTATION MODELILNG USING CELLULAR AUTOMATA
(CASE STUDY: CENTRAL ZAGROS FORESTS)
M. Naghdizadegana, M. Behifara, B. Mirbagheria
a Remote Sensing & GIS Center, Shahid Beheshti University, Tehran, Iran - (naghdizadegan, behifar_mh, babakmirbagheri)@yahoo.com
KEY WORDS:Deforestation, Cellular Automata, Spatial Modelling, Central Zagros Forests
ABSTRACT:
Forests have been highly exploited in recent decades in Iran and deforestation is going to be the major environmental concern due to its role in destruction of natural ecosystem and soil cover. Therefore, finding the effective parameters in deforestation and simulation of this process can help the management and preservation of forests. It helps predicting areas of deforestation in near future which is a useful tool for making socioeconomic disciplines in order to prevent deforestation in the area. Recently, GIS technologies are widely employed to support public policies in order to preserve ecosystems from undesirable human activities. The aim of this study is modelling the distribution of forest destruction in part of Central Zagros Mountains and predicting its process in future. In this paper we developed a Cellular Automata (CA) model for deforestation process due to its high performance in spatial modelling, land cover change prediction and its compatibility with GIS This model is going to determine areas with deforestation risk in the future. Land cover maps were explored using high spatial resolution satellite imageries and the forest land cover was extracted. In order to investigate the deforestation modelling, major elements of forest destruction relating to human activity and also physiographic parameters was explored and the suitability map was produced. Then the suitability map in combination with neighbourhood parameter was used to develop the CA model. Moreover, neighbourhood, suitability and stochastic disturbance term were calibrated in order to improve the simulation results. Regarding this, several neighbourhood configurations and different temporal intervals were tested. The accuracy of model was evaluated using satellite image. The results showed that the developed CA model in this research has proper performance in simulation of deforestation process. This model also predicted the areas with high potential for future deforestation.
1. INTRODUCTION
Forests currently cover about 30 percent of the world’s land
mass (National Geographic). However, the world's forests have come under increasing threat in recent years. According to the United Nations' Food and Agriculture Organization (FAO) an estimated 18 million acres (7.3 million hectares) of forest are lost each year, about half of the world's tropical forests have been cleared.
The impact of deforestation affects the world's ecosystems in a number of ways. Trees and other plants prevent soil deterioration using their roots. In fact, with the loss of trees and plants, the speed of soil erosion may increase, in some cases this may lead deforestation to degenerate into dissertation. Deforestation also ruins the role of forest as windbreaks.
Furthermore, forest deterioration may cause floods and changes in climate. They are also home for animals and indigenous people. Forest loss contributes between 12 percent and 17 percent of annual global greenhouse gas emissions (World Resources Institute).It can also help global warming.
Distribution of forests in each area has been controlled by some factors like soil thickness and type, slope and climate. According to FAO, forest destruction is increasing with the rate of 13 million hectares a year. This report demonstrated
the deterioration of natural resources in Iran. This high rate of deforestation, made Iran among top ten countries in Asia and Eurasia regarding the amount of destruction (Arekhi, 2011).
Forests cover an area of about 5.2 million hectares in Zagros area (Fattahi., 2003). Reports from “conservation of
biodiversity in central Zagros project” demonstrated that an
area about 96000 hectares of Central Zagros forests have been destroyed in recent 32 years. In the mentioned area, forests have been significantly decreased from 360000 hectares in 1975 to 263000 in 2007. Wood collection, fire and over grazing are the most important factors which affects forest destruction. The most deforestation happened in 1975 to 2000. From 2000 to 2007 the rate of destruction has been declined (FRWO).
In order to conserve and manage the west Zagros forests, applicable disciplines must be applied by decisive organisations. Monitoring the areas with high risk of deforestation is one of the most important steps to safeguard this area. In fact, detection of such areas can prevent future disasters.
Mas et al., 2004, used GIS and artificial neural network for simulation of forest destruction. Croopper and Puri, et al., 2001, assessed the role of roads and protected areas in predicting the location of deforestation. Amor and Pfaff, 2008 used Generalized Linear Model (GLM) approach to understand the probability of forest deterioration in the area.
Cellular Automata (CA) is also used for deforestation modelling due to its high accuracy in spatial modelling and its compatibility with Geographic Information System The role of CA modelling especially in land use simulation in recent decades can not be ignored (Li and Yeh 2000, White and Engelen 1993, Wu and Webster,1998, Wu 1998b, White et al. 2000, Soares-Filho, 2002). This model also, has been widely applied in urban development simulation (Wolfram, 1984, White and Engelen, 1993, Clarke et al., 1997, Batty et al., 1999, Almeida, 2008, Alimohammadi et al., 2010)
Some CA models are developed for fire spreading simulation (Karafyllidis, Thanailakis,1997, Li and Magill , 2001, Berjak et al., 2002, Encinas,2007, Alexandridis, 2008,Yassemi et al., 2008, Almeida and Macau, 2011. Walsh and Messina, 2002, applied cellular automata model for predicting deforestation.
They mostly came to acceptable results in their simulation. Soares-Filho et al., 2002, used stochastic cellular automata model to simulate the landscape dynamics in an Amazonian colonization frontier. In this model, logistic regression was applied to calculate the spatial dynamic transition probabilities. 8-year time interval, from 1986 to 1994, was used to simulate maps. The resulted maps were compared with land-use and land-cover maps which were obtained from classification of satellite images using validation methods.The obtained result demonstrated a good performance of the model.
Arimatéa Ximenes et al., 2011, also used Cellular Automata for spatial modelling of deforestation in Amazon. According to the result, the employed CA model was suitable enough in estimating the amount of forest deterioration in the study area for the time span from 1997 to 2000.
Wu, 2002, simulated rural-urban land conversions using Cellular Automata. Global probability has been calculated by using logistic regression.
This work applies a CA model to simulate deforestation in part of western Oak forest in Iran.
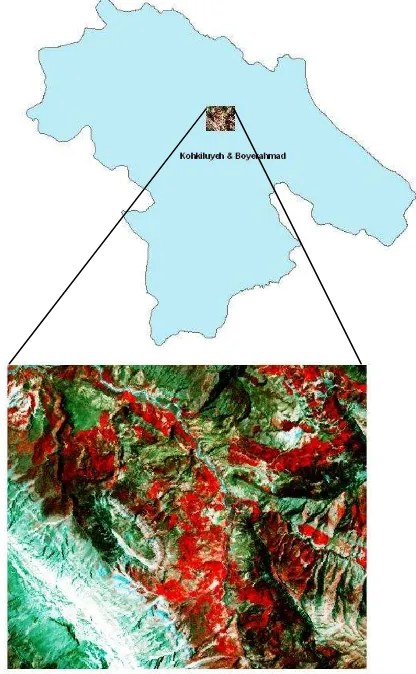
2. STUDY AREA
Western oak forest is a part of Zagros forests which covers a vast area of the Zagros Mountain in the west of Iran. This forest covers an area of about 5 million ha and Oak trees are the dominant species in this region (Marvi-Mohajer, 2005 and Haidari et al, 2013). The study area is a part of this forest in Kohgiluyeh and Boyer-Ahmad province which covers about 335000 of the region. The whole region is mountainous and almost steep (figure 1).
In this study, deforestation from 1986 to 1999 has been modelled. Forest map is produced from Land sat/ ETM
images of the region and visual interpretation and vegetation index were used for forest extraction.
Figure 1: study area
3.THE CA MODEL
3 According to recent researches, natural constraints like
slope, elevation and climate and also man’s activities are
very important in forest destruction. Therefore, in this study distance from roads and villages beside DEM and slope are used as base maps. Moreover, regarding the fact that forest destruction starts from outer layer of forest boundary, distance from forest boundary is applied in deforestation modelling. The dependent variable is binary forest deforest map (1986-1999) and the independent variables are slope, elevation, distance from roads, villages and forest boundaries. The model which is used for deforestation probability estimation is as following:
(1)
Where bk are coefficients of the regression model; xk is a set of site attributes and a is the constant.
(2) Where,
Ώij is the neighbourhood function referring to the deforestation density within the n*n neighbours.
Nij is the state of pixels at time t in which 1 represents the deforest and 0 the forest pixel.
(3)
ν is a stochastic disturbance term, Rand is a random number between 0-1, and α = 1 in this study.
4. CONCLUSION
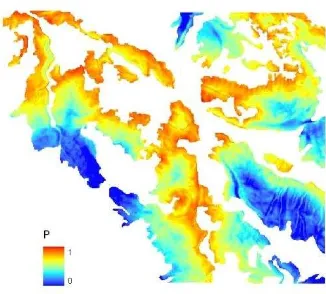
Deforestation probability has been calculated using logistic regression. Based on coefficients from regression the probability for each pixel is computed according to the following:
(4) Pij= -0.534*(DEM)-1.642*(village_distance) -5.067*(road_
distance)-1.983*(forest boundary_ distance)-4.106*(slope) + 2.884
The resulted map is shown in figure 2.
Neighbourhood for each cell has been calculated using a moving window in map in which 0 represents forest and 1 deforest. Different neighbourhood dimensions have been tested (3*3, 5*5 and 7*7). For 3*3 window the neighbourhood value is between 1/9- 1. 1/9 belongs to the cell in which all the neighbours are forests and 1 is for the cell that its all neighbours are deforested).
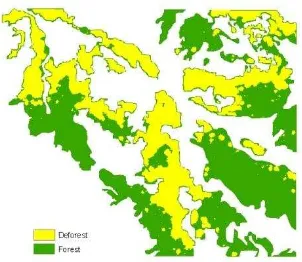
This CA model has been run for different time intervals (t=3, 6, 12 and 24 months). Overall accuracy for different neighbourhood sizes and temporal intervals were calculated
(table1). The best resulted map is shown in figure 3 and table 2 is the confusion matrix.
Figure 2: probability map (pij)
3 Month 6 Month 12 Month 24 month
3*3 0.738 0.736 0.718 0.69
5*5 0.669 0.698 0.695 0.68
7*7 0.633 0.645 0.652 0.643
Table 1: Overall accuracy measurements
Figure 3: simulated deforestation maps with t=52 and Neighbourhood window: 3*3
Forest Deforest Forest 40635 11151 51786 Deforest 11117 22215 33332 51752 33366 85118 Table 2: confusion matrix of simulated deforestation map
Final CA model has been used to simulate deforestation in 2005. The resulted estimation is shown in figure 4.
Figure 4: simulated deforestation in 2015
5. DISCUSSION
Results from logistic regression model indicated that distance from road is the most effective factor in forest destruction of the study area. Therefore the amount of deforestation has been decreased in far distances. The second important factor in forest deterioration is slope. It must be mentioned that the most sever destruction has been occurred in the area of less steep slope. This must be due to better accessibility in such areas. Moreover, because of soil preservation in less steep slopes, these fields are suitable enough for agriculture.
Distance from villages is less important in comparison with slope and road. This might be due to equal distribution of villages among forest areas.
Elevation is the least effective factors in the resulted CA model. This can be due to the fact that the whole area is mountainous. Moreover, the high density of roads omitted the risk of accessibility of outland mountains However, using CA modelling with different time intervals (while the other factors like number of neighbours are constant) shows that the accuracy of the estimation model will increase with decreasing time intervals. It is obvious that the accuracy is increasing in higher iterations. Furthermore number of neighbours involved in CA simulation is of high importance. It can be understood from the results that using fewer neighbours can help better simulation. Using equal time intervals in all models, the best deforest estimation is in 3*3 neighbours. 5*5 neighbours also have better result than 7*7. Based on this fact, the chance of nearest cells in deforestation can be higher in comparison with the other cells.
REFERENCES
Amor, D, Pfaff, A., Sequenced Road Investments & Clearing of the Mayan Forest, working paper.
Alexandridis, A., Vakalis, D., Siettos, C.I., Bafas, G.V.,2008, A cellular automata model for forest fire spread prediction: The case of the wildfire that swept through Spetses Island in 1990, Applied Mathematics and Computation 204,pp.191–201.
Alimohammadi , A.,Matkan A.A.,Mirbagheri, B., 2010, The evaluation of cellular automata model efficiency insimiulation of urban area development(case study: suburbs of south west Tehran),Spatial Planning(Modares Human Sciences);14(2(66)),pp.81-102.
C. M. Almeida.C, Gleriani. J, E. F. Castejon.E and Soares‐Filho.B, 2008, Using neural networks and cellular automata for modelling intra‐urban land‐use dynamics, International Journal of Geographical Information Science, 22, 9,943-963.
Almeida. R and Macau. E, 2011, Stochastic cellular automata model for wildland fire spread dynamics, Journal of Physics: Conference Series, 285,1.
Arekhi, S., 2011, Modeling spatial pattern of deforestation using GIS and logistic regression: A case study of northern Ilam forests, Ilam province, Iran. African Journal of Biotechnology Vol. 10(72),pp.16236-16249.
rimat a imenes, l udia M. Almeida, Silvana Amaral, Maria Isabel S. Escada and Ana Paula D. Aguiar, 2011, Spatial Dynamic Modelling of Deforestation in the Amazon, Cellular Automata - Simplicity Behind Complexity, Dr. Alejandro Salcido (Ed.), ISBN: 978-953-307-230-2.
Batty, M., Xie, Y., and Sun, Z., 1999, Modeling urban dynamics through GIS-based cellular automata. Computers, Environment and Urban Systems, 23,pp. 205–233. Berjak, S., Hearne, J.,2002, An improved cellular automaton model for simulating fire in a spatially heterogeneous Savanna system, Ecol. Model. 148,pp. 133–151. modifying cellular automaton model of historical urbanization in the San Francisco Bay area. Environment and Planning B, 24, pp.247–261.
Fattahi M.,2003, Forest management trends in the Zagross region of Iran.XII World forestry Congress, Quebec City. Canada, 1-5(0118-B1).
5 Haidari M, Jalilvand H, Haidari R.H, Shabanian N, 2012. Study of Plant Biodiversity in Grazed and Non-grazed Areas in the Iran-o-Turanian Ecological Zones (Case Study: Yazd Province, IRAN), Annals of Biological Research, 3 (11):pp.5019-5027.
Li, X., and Yeh, A. G. O., 2000, Modelling sustainable urban development by the integration of constrained cellular automata and GIS. International Journal of Geographical Information Science, 14, pp.131–152. Li, X., Magill, W., 2001,Modeling fire spread under environmental influence using a cellular automaton approach, Complex. Int. 8,pp. 1–14.
Liu.Y, 2009, Modelling Urban Development with Geographical Information Systems and Cellular Automata, Taylor & Francis, us, 188page.
Mas. J, Puig. H, Palacio. J, .Sosa-López.A, 2004, Modelling deforestation using GIS and artificial neural networks, Modelling deforestation using GIS and artificial neural networks,19 , 5,pp. 461–471.
Marvi-Mohajer MM, 2005. Silviculture, Tehran University Press, Tehran, Iran.
Karafyllidis,I., Thanailakis, A.,1997, A model for predicting forest fire spreading using cellular automata, Ecol. Modell. 99 (1), pp.87–97.
Soares-Filho, B.S., Pennachin, C.L., and Cerqueira, G.,
2002,“DIN MI – a stochastic cellular automata model designed to simulate the landscape dynamics in an
mazonian colonization frontier”, Ecological Modelling, vol. 154(3), pp.217 – 235.
Walsh S, Messina J, Crews-Meyer K, Bilsborrow R, Pan W , 2002, Characterizing and Modeling Patterns of Deforestation and Agricultural Extensification in the Ecuadorian Amazon, Linking People, Place, and Policy, 2002, pp 187-214.
White, R., and Engelen, G., 1993, Cellular automata and fractal urban form: a cellular modelling approach to the evolution of urban land-use patterns. Environment and Planning A,( 25), pp.1175–1189.
Wolfram, S., 1984, Universality and complexity in cellular automata. Physic D, 10,pp. 1–35.
Wu, F., 1998b, SimLand: a prototype to simulate land conversion through the integrated GIS and CA with AHP-derived transition rules. International Journal of Geographical Information Science, 12, pp. 63–82.
Wu, F., and Webster, C. J., 1998, Simulation of land development through the integration of cellular automata
and multi-criteria evaluation. Environment and Planning B, 25,pp. 103–126.
Wu. F, 2002, Calibration of stochastic cellular automata: the application to rural-urban land conversions, International Journal of Geographical Information Science,16, 8, pp.795–818.
Yassemi, S., Dragicevic SSchmidt, ., M., 2008, Design and implementation of an integrated GIS-based cellular automata model to characterize forest fire, Ecol.