STATISTICAL EVALUATION OF FITTING ACCURACY OF GLOBAL AND LOCAL
DIGITAL ELEVATION MODELS IN IRAN
F. Alidoost*, F. Samadzadegan
a
Department of Geomatics, Faculty of Engineering, University of Tehran, Tehran, Iran - (falidoost, samadz)@ut.ac.ir
KEY WORDS: Digital elevation model, ASTER GDEM ver2, SRTM, Accuracy, Robust, Quantiles, Outliers.
ABSTRACT:
Digital Elevation Models (DEMs) are one of the most important data for various applications such as hydrological studies, topography mapping and ortho image generation. There are well-known DEMs of the whole world that represent the terrain’s surface at variable resolution and they are also freely available for 99% of the globe. However, it is necessary to assess the quality of the global DEMs for the regional scale applications.These models are evaluated by differencing with other reference DEMs or ground control points (GCPs) in order to estimate the quality and accuracy parameters over different land cover types. In this paper, a comparison of ASTER GDEM ver2, SRTM DEM with more than 800 reference GCPs and also with a local elevation model over the area of Iran is presented. This study investigates DEM’s characteristics such as systematic error (bias), vertical accuracy and outliers for DEMs using both the usual (Mean error, Root Mean Square Error, Standard Deviation) and the robust (Median, Normalized Median Absolute Deviation, Sample Quantiles) descriptors. Also, the visual assessment tools are used to illustrate the quality of DEMs, such as normalized histograms and Q-Q plots. The results of the study confirmed that there is a negative elevation bias of approximately 5 meters of GDEM ver2. The measured RMSE and NMAD for elevation differences of GDEM-GCPs are 7.1 m and 3.2 m, respectively, while these values for SRTM and GCPs are 9.0 m and 4.4 m. On the other hand, in comparison with the local DEM, GDEM ver2 exhibits the RMSE of about 6.7 m, a little higher than the RMSE of SRTM (5.1 m).The results of height difference classification and other statistical analysis of GDEM ver2-local DEM and SRTM-local DEM reveal that SRTM is slightly more accurate than GDEM ver2. Accordingly, SRTM has no noticeable bias and shift from Local DEM and they have more consistency to each other, while GDEM ver2 has always a negative bias.
* Corresponding author.
1. INTRODUCTION
The digital elevation models generally may divide into two categories, global and local DEMs. Global DEMs have nearly world-wide coverage with mostly free of charge availability at the different resolutions. Currently, two different global DEMs have been presented, SRTM and ASTER GDEM. SRTM version 4.1 has been released by Consultative Group for International Agriculture Research Consortium for Spatial Information (CGIAR-CSI). The ground sampling distance of SRTM is 90 meters (~ 3 arc-seconds) and the overall absolute vertical height accuracy is about 10 meters (Rodriguez et al. 2006). The size of SRTM tiles is 5°×5° containing 6001×6001 pixels. The ASTER GDEM ver2 was released by NASA and METI on October 17, 2011 to the public at a spatial resolution of 1 arc-second. This dataset is based on satellite imagery and distributed in 1°×1° tiles containing 3601×3601 pixels. On the basis of a validation study, the root mean square error of ASTER GDEM ver2 is 8.68 meters when compared against geodetic control points (Gesch, 2012).
Local DEMs have been generally produced from national digital topographic maps and provide basic elevation information for each country. Such DEMs usually have complete coverage and are very dense and relatively accurate over the local areas.
Because of differences in the original data and collection data methods, the quality and accuracy of the global DEMs may spatially dissimilar in different area. Thus, regional studies of DEMs should be performed for every area, separately. On the other hand, local DEMs may not available for large areas
especially in mountainous regions and dry sand deserts. Therefore, for areas where both global and local DEMs exist, it is the question which height models should be selected and which quality parameters are used to explain the accuracy of DEMs.
A validation study of the trial and beta version of ASTER GDEM ver2 was performed by Earth Remote Sensing Data Analysis Center (ERSDAC), and results confirmed the improvement of the elevation offset and horizontal resolution in ASTER GDEM ver2. Also, the standard deviation of elevation and geolocation error were reduced because of the enhanced horizontal resolution (Tachikawal, et. al., 2011). Based on the evaluation analysis of ASTER GDEM ver2 at the five study areas in China using ground control points, the RMSE (19 m) and mean (-13 m) values of ASTER GDEM ver2 against GPS-GCPs was lower than its first version (26 m and -21 m) (Li, et. al., 2012). A comparison study over the area of Istanbul, Turkey was performed to compare the accuracies of DTMs obtained from SRTM, topographic maps and ALOS imagery. The results demonstrated that the two DTMs from 1:25000 topographic maps and stereo PRISM images have approximately same accuracy values, whereas the DTM generated from SRTM has lower accuracy (Uysal, 2011). The vertical component of topographic survey versus SRTM 30m, ICESat, and NED elevation over a large area with different land cover was determined by Karacic and Marshall in 2012. Based on the result of this study, the mean vertical difference between the SRTM and the vertical component of topographic survey and ICESat were about 4.4 m and 2.1m, respectively (Karacic, 2012). In another research, the vertical accuracy of the SRTM 3 International Archives of the Photogrammetry, Remote Sensing and Spatial Information Sciences, Volume XL-1/W3, 2013
arc seconds version 4.1 DEM was analysed in several areas of Peru using two sets of control points and the results shows that the mean square of the height differences at national level was 20-25 m and this was larger than the overall accuracy of the SRTM 16 m (Sanchez, 2012).
For various applications, it is important to assess the quality of DEMs over the interested area and select the best one as an accurate source of topographical information. In this paper, the fitting accuracy of ASTER GDEM ver2 and SRTM models in Iran is investigated.
2. EVALUATION METHODS OF DEM’S ACCURACY
Common evaluation approaches to assess the accuracy and quality of the global and local DEMs can be divided into two general groups such as statistical and visual methods. Here, the concepts of each method are explained.
2.1 Statistical Methods
The accuracy measures for the assessment of the height differences between a DEM and a reference (another DEM or individual GCPs) can be performed based on the usual (Mean error, Root Mean Square Error, Standard Deviation) and the robust (Median, Normalized Median Absolute Deviation, Sample Quantiles) descriptors.
In statistics and probability theory, RMSE is a widely used measure of conformity between a set of estimates and the actual values (Li, 1988). Considering both random and systematic errors introduced during the data generation process, the RMSE can use as a standard measure of data accuracy and it is given dispersion exists from the average (mean), or expected value. It is calculated as equation 2.
These accuracy measures will be inaccurate and unreliable if the outliers are presented in the data. For this, the robust descriptors should be applied for the assessment of a DEM. The Normalized Median Absolute Deviation (NMAD) is proportional to the median of the absolute differences between errors and the median error. It can be considered as an estimate for the standard deviation more resilient to outliers in the of its cumulative distribution function (Hohle, 2009).
) 0<p<1. These accuracy measures are robust to outliers and non-normal distribution of errors. For example, the 50% quantile, Q(0.5) is the median of the distribution. If the unique inverse of F doesn’t exist, another definition can be used for quantile of a distribution such as:
Sample quantiles are non-parametric estimators of the distributional counterparts based on a sample of independent observations {X1, … , Xn} from the distribution (Hohle, 2009). and 90% quantile are obtained as:
n
j 0.5. , j
0.9.n
(7)The corresponding sample quantiles of the distribution are then:
0.5. )
The first impression of the normality of the error distribution in height differences of a DEM from a reference is to use a normalized histogram of the sampled errors, where the number of errors within certain predefined intervals is represented.
A better visual inspection for checking a deviation from the normal distribution (because of existence of outliers) is quantile_quantile (Q_Q) plot. This Q–Q plot compares a sample of data on the vertical axis to a statistical population on the horizontal axis. If the actual distribution is normal, the Q_Q plot should yield a straight line (Hohle, 2009). Another approach to depict the quality of a DEM in comparison with another DEM is classifying height differences in some specific intervals and looking for the large errors between two DEMs, visually.
3. EXPERIMENTS AND RESULTS
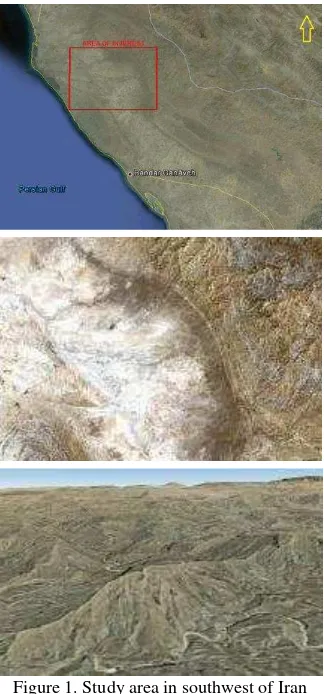
In this paper, the accuracy assessment of ASTER GDEM ver2 dataset, SRTM DEM and local elevation model is implemented over the study area that is shown in Figure 1. The selected region is a mountainous area with a 500 meters elevation range and 23x32 km2 area in southwest of Iran. The accuracy of these models was calculated by comparison with independent reference ground control points and also using a pixel-to-pixel comparison with local DEM.
Figure 1. Study area in southwest of Iran
A local DEM was created using 1:25000 topographical map layers in area of interest. It is posted on a 10 meters grid and referenced to the 1984 World Geodetic System (WGS84)/local geoid. This model and two SRTM and GDEM ver2 global elevation models are used to generate three dataset. In Figure 2, GDEM ver2, SRTM DEM, the local DEM and some layers of base map is shown.
Figure 2.Up: ASTER GDEM ver2 (left), SRTM (right), Down: local DEM (left), Topographical map layers (right)
Table 1 gives summary information of three elevation models.
Data Raster Size Pixel Size
SRTM 6001×6001 3 arc sec (0.000833 deg ~ 90 m) GDEM 3601×3601 1 arc sec (0.000277 deg ~ 30 m)
Local DEM 2216×3558 10 m
Table 1. Data dimension
3.1 Accuracy Assessment Based on GCPs
The accuracy of GDEM ver2, SRTM DEM, and the local DEM is calculated by comparison with more than 800 independent reference ground control points. The GCPs are extracted from the 1:40000 aerial images using the photogrammetry methods. These points have a regular distribution over the area and their accuracy is about 3 meters (Figure 3).
Figure 3. The distribution of GCPs
In order to assessment, the elevation data of each DEM are extracted by the nearest neighbour technique and errors between DEMs and GCPs are calculated. Consequently, three datasets are created: local DEM-GCPs, GDEM-GCPs and SRTM-GCPs. Statistical analysis is used to illustrate the numerical proportion of elevation difference in three datasets (Figure 4).
Figure 4. Statistical graphs for Local DEM-GCPs (green), GDEM-GCPs (red) and SRTM-GCPs (blue)
Based on the results of this analysis, the height errors of local DEM are about 56% in [-2, 2] m that indicates the International Archives of the Photogrammetry, Remote Sensing and Spatial Information Sciences, Volume XL-1/W3, 2013
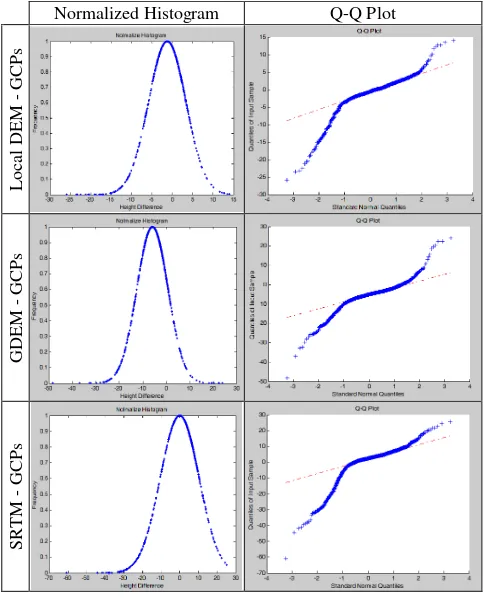
maximum absolute error of local DEM is about 2 m in column, demonstrates normalized histograms and right column shows the Q-Q plots of elevation errors in three datasets.
Normalized Histogram Q-Q Plot
Figure 5. Left column: Normalized histograms, Right column: Q_Q plot
Based on a visually check, the histograms don’t match the normal data very well and there is a skew distribution which is not symmetric around its mean. Also, the value of mean error is not zero and there is a tail due to outliers or systematic errors in three datasets. In Q-Q plots, there is a strong deviation from a straight line that depicts the non-normal distribution of elevation errors because of outliers and some systematic errors in data. Therefore, it is necessary to remove the outliers before computing accuracy parameters.
After eliminating outliers, this study investigates DEM’s characteristics such as systematic error (bias), vertical accuracy for these three datasets. Table 2 shows the results of accuracy assessment of GDEM ver2, SRTM and local DEM in comparison with GCPs. After outlier removing, the RMSE value improves by 1.6 m for SRTM-GCPs, 1.8 m for GDEM-GCPs, and 1.2 m for Local DEM-GCPs with no minimum and maximum difference of 40 m or more.
Descriptor(m)
Table 2. The results of usual and robust measures for accuracy assessment of SRTM, GDEM and Local DEM
The results of this study indicate that there is a negative elevation bias of approximately 5 meters of GDEM ver2 against the GCPs in open areas. The median of the differences is -4.9 m which is a robust measure to prove the existence of systematic shift between the two data. The mean and median errors for local DEM-GCPs are -0.7 m and -0.5 m and are lower in comparison with other datasets. The RMSE measured for elevation differences between SRTM-GCPs is 9.0 m, while this value for GGCPs is 7.1 m and 3.6 m for local DEM-GCPs. Consequently, the local DEM is more accurate than SRTM and GDEM ver2. Since the mean error of the local DEM-GCPs and SRTM-GCPs are very small and near to zero, the RMSE is equal to the standard deviation. It means that the estimator for these datasets is unbiased.
A considerable difference between the accuracy measures NMAD and 68.3% quantile can be observed in both GDEM-GCPs and SRTM-GDEM-GCPs datasets. On the other hand, the NMAD value and 68.3% quantile agree well with each other in local DEM-GCPs which indicate the normal distribution of data. In the SRTM-GCPs dataset, the mean error (0.7 m) and median (2.5 m) differ by 1.8 m while the standard deviation (9.0 m) and 68.3% quantile (6.3 m) differ by 2.7 m, which illustrates the problem of the 3-sigma rule to remove outlier in a non-normal distribution of data. The results of comparison between NMAD (3.2 m) and 68.3% quantile (6.7 m) in GDEM-GCPs are about the same as in the SRTM-GCPs dataset. The 95% quantile differ extremely between SRTM-GCPs and GDEM-GCPs, but there are again smaller values for the GDEM-GCPs. The 95% errors of GDEM-GCPs dataset have a magnitude within the interval [0, 14.5], while it is [0, 21.6] for SRTM-GCPs.
3.2 Accuracy Assessment Based on Local DEM
In second assessment, GDEM ver2 and SRTM were differenced with local DEM on a pixel-to-pixel basis across the full extent of their coverage. For this, GDEM ver2 and SRTM were each subtracted from local DEM. Thus, positive differences represent locations where GDEM ver2 and SRTM elevations are higher than the corresponding local DEM. In the same manner as with the reference control points, difference statistics should be calculated, and summary statistics are classified by height difference classes. Prior to differencing, the GDEM and SRTM are resampled to local DEM grid size by bilinear method and transformed to the same format as the ones used for the local DEM. Then, the accuracy measures for the assessment of the height differences between each two DEMs are calculated based on the usual and the robust descriptor, as it’s shown in Table 3. International Archives of the Photogrammetry, Remote Sensing and Spatial Information Sciences, Volume XL-1/W3, 2013
Descriptor(m)
Table 3. The results of usual and robust measures for accuracy assessment of SRTM, GDEM and local DEM
On the basis of the obtained results in this assessment,the RMSE of SRTM (5.1 m) and its standard deviation (4.6 m) are slightly lower than the RMSE of GDEM (6.7 m) and its approximately same in GDEM-GCPs assessments. But there are some differences in the values of accuracy parameters of SRTM in comparison of GCPs and corresponding values against local DEM. For example, the RMSE and standard deviation of SRTM-GCPs are about two times larger than these values in SRTM-local DEM dataset. It may be because of the SRTM grid size of 90 m that causes the calculated elevations corresponding GCPs are not the similar with observed elevations due to nearest neighbour sampling. On the other hand, the RMSE, mean and median measures of GDEM related to SRTM are larger than other datasets. They are 8.3 m, -6.6 m and -7 m, respectively. It means that there is a big difference in elevation values of these DEMs over the interested area. It is the question which global height model should be selected as the accurate assessment, the discrepancy of GDEM in mountainous areas is more than (about 6.1 times) SRTM in comparison with local DEM.
Also, the height difference images for each dataset are classified into 10 classes based on the minimum and maximum elevation errors. In Table 4, these classes and their values are given. The results of Table 4 shows that about 91% of height errors of GDEM and 95% of height errors of SRTM are absolute errors within [0, 10] m related to local DEM, but about 48% of height errors of GDEM are absolute errors within [0, 5] m, while this value for SRTM is 74%. It is clear that the range of errors in SRTM is lower than GDEM.
No. Class GDEM- GDEM- SRTM-
Table 4. Classification of the height errors in three datasets
Classification of Height
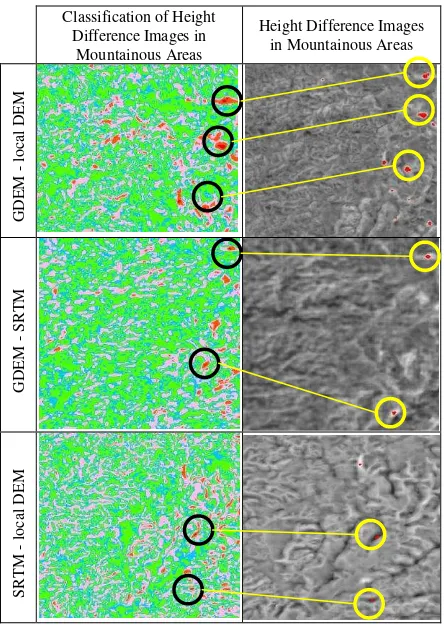
Figure 6. Left column: Classification result in mountainous areas, Right column: Height difference Images between DEMs
The pixel numbers of each image within same classes are presented in Figure 7. The height difference of GDEM-local DEM is deviated to negative values and the height difference of SRTM-local DEM is deviated to positive values that illustrate the different behaviour of these DEMs about systematic errors. International Archives of the Photogrammetry, Remote Sensing and Spatial Information Sciences, Volume XL-1/W3, 2013
Figure 7. The pixel numbers of images in height differences class intervals for three datasets
The class intervals in Table 4 are used to classify the height difference images of each dataset in mountainous areas, as it is shown in Figure 6, left column. The red and orange areas are related to absolute errors higher than 25 m, the pink areas are related to absolute errors within [10, 25] m, and other areas are related to 0-10 m absolute errors which are coloured by blue and green. As a result of quick view of classification, the height difference error of GDEM-local DEM is more than two other datasets and SRTM and local DEM have more consistency to each other.
4. CONCLUSION
In this paper, the accuracy of two global digital elevation models were evaluated against the more accurate, independent reference ground control points and a local DEM over the area in Iran. For the assessment of the accuracy, two visual and statistical methods were presented and the error characteristics in three datasets were investigated. The visual tools such as histograms and Q_Q plots illustrate the possible skewness and kurtosis in distribution function of errors, which should be consider due to accuracy assessment. After outliers’ removal using a standard deviation based threshold, two groups of the descriptors as the usual and the robust measures were used to assess the digital elevation models. The robust descriptors like median, NMAD and sample quantiles are reliable parameters to fitting accuracy of DEMs. As a result of the assessment based on GCPs, the GDEM ver2 has RMSE of 7.1 m and NMAD of 3.2 m which is slightly smaller than the RMSE and NMAD values of SRTM (9.0 m, 4.4 m). Accordingly, it is more accurate than SRTM in comparison with GCPs but there is always a negative bias about it that is apparently systematic and indicating that a problem lies with the ASTER data. The 95% errors of local DEM-GCPs dataset have a magnitude within the interval [0, 8.5], that it is extremely smaller than 95% quantile of two other datasets. On the other hand, the local DEM has no noticeable bias and shift from GCPs. Some classification and statistical assessments based on local DEMs show that the local DEM and SRTM have more consistency to each other. Since the accuracy measures vary across land cover types, it is recommended that the error analysis has been performed for the different land cover classes to analyse their effect on the errors.
REFERENCE
Tachikawa, T., Hato, M., Kaku, M., Iwasaki, A., 2011. CHARACTERISTICS OF ASTER GDEM VERSION 2. In:
Geoscience and Remote Sensing Symposium (IGARSS), 2011 IEEE International.
Gesch, D., Oimoen, M., Zhang, Z., Meye, D., Danielson, J., 2012. Validation of the ASTER Global Digital Elevation Model Version 2 over the Conterminous United States. International Archives of the Photogrammetry, Remote Sensing and Spatial Information Sciences, Volume XXXIX-B4, 2012, XXII ISPRS Congress, 25 August – 01 September 2012, Melbourne, Australia.
Rodriguez, E., Morris, C. S., Belz, J. E., 2006. A Global Assessment of the SRTM Performance. Photogrammetric
Engineering and Remote Sensing, 72: 249–60.
Li, P., Shia, C., Li, Z., 2012. Evaluation of ASTER GDEM Ver2 Using GPS Measurements and SRTM Ver4.1 in China. ISPRS Annals of the Photogrammetry, Remote Sensing and Spatial Information Sciences, Volume I-4, 2012, XXII ISPRS Congress, 25 August – 01 September 2012, Melbourne, Australia.
Uysal, C., Maktav, D., 2011. Comparison of the Accuracies of DTM’s obtained from SRTM, Topographic Maps and ALOS/PRISM. Istanbul Technical Univ., Geomatics Engineering Dept., Istanbul, Turkey. Submitted to 31st EARSeL Symposium and 35th General Assembly 2011.
Daniel, C., K. Tennant, 2001. DEM quality assessment, Digital Elevation Model Technologies and Applications: The DEM User’s Manual (D.F. Maune, editor), American Society for Photogrammetry and Remote Sensing, Bethesda, Maryland,pp. 395–440.
Li, Z., Zhu, Q., Gold, C., 2004, Digital Terrain Modeling: Principles and Methodology. CRC Press, Boca Raton, eBook.
Höhle, J., Höhle, M., 2009. Accuracy assessment of digital elevation models by means of robust statistical methods. ISPRS Journal of Photogrammetry and Remote Sensing 64 (2009) 398_406.
Sánchez, E., P., Fernandez de Villarán, R., 2012. SRTM 3" comparison with local information: Two examples at national level in Peru. Journal of Applied Geodesy, Volume 6, Issue 2, pp. 75-81, ISSN 1862-9024.
Karacic, N., Marshall, R., 2012. Vertical Component of Topographic Survey vs. SRTM 30m, ICESat, and NED elevations for Dallas Levees Project Area. ACSM/ESRI 2012 Survey Summit paper SUR 1073.