CHAPTER III
RESEARCH METHOD
This chapter elaborates the method of the research, which has been briefly introduced in Chapter I. the discussion of this chapter covers the research method, variables, subject of the research, instruments, data collection procedure and data analysis. Furthermore, this chapter also provides the preparation, tabulation, and implementation stages in analyzing the data.
3.1 The Research Method
In line with the objective of this research, to find out the effectiveness of Word Processor in improving students’ writing skills, the design used in this research is quasi-experimental design. This design is used because the treatment is not random assignment of participants to groups (Creswell, 2008:313). It means that there is no selection in the population. In other words, a group can be experimental or control group. According to Hatch and Farhady (1982:23), this design is a realistic one conducted in social sciences in general.
The design used in the experimental method is a pre-test and post-test design, as follows:
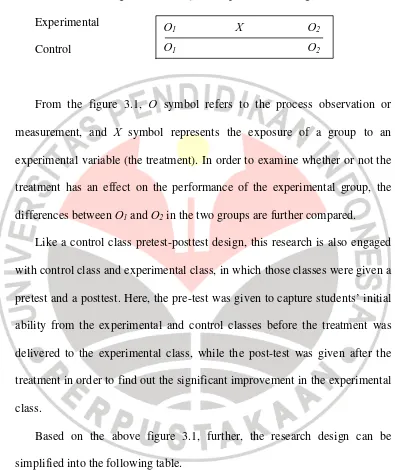
Figure 3.1 The Quasi-Experimental Design Experimental
Control
From the figure 3.1, O symbol refers to the process observation or measurement, and X symbol represents the exposure of a group to an experimental variable (the treatment). In order to examine whether or not the treatment has an effect on the performance of the experimental group, the differences between O1 and O2 in the two groups are further compared.
Like a control class pretest-posttest design, this research is also engaged with control class and experimental class, in which those classes were given a pretest and a posttest. Here, the pre-test was given to capture students’ initial ability from the experimental and control classes before the treatment was delivered to the experimental class, while the post-test was given after the treatment in order to find out the significant improvement in the experimental class.
Based on the above figure 3.1, further, the research design can be simplified into the following table.
Table 3.1 Research Design
Class Category Pre-Test Treatment Post-Test
Experimental Class T1 X T2
Control Class T1 - T2
O1 X O2
According to table 3.1, T1 refers to the pre-test given to both experimental and control groups. Further, X refers to the treatment of using Microsoft Word given to the experimental class, while T2 refers to the post-test given to both experimental and control classes. Finally, the result can be recognized by comparing the differences between T1 and T2.
3.2 The Research Variables
A variable is defined as an object of the research that varies (Arikunto, 2006: 116). Besides, based on Hatch and Farhady (1982: 12), a variable is defined as an attribute of a person or of an object which varies from person to person or from object to object. Furthermore, in general, variables are divided into quantitative and qualitative variables.
3.3 The Subjects of the Research
Based on Arikunto (2006: 129), the subject where the data are gained is called the source of data in a research. Further, based on the subject where the data are placed, Arikunto (2006: 129) identifies the source of data into three levels of P, which are person, place and paper. Besides, he also classifies the source of data based on the areas made as the subject of the research. In this case, those sources that many researchers usually use are population and sample.
3.4.1. The Population
Population is defined as a set (or collection) of all elements processing one or more attributes of interest (Arikunto 2006: 129). Moreover, Coolidge (2000: 24) states that population is most often a theoretical group of all possible scores with the same trait or traits. Simply, a population is the whole subject of a research.
Referring to the above definition, the population of this research was the second grade students of a Madrasah in Garut enrolled in academic year 2008/2009 spreading into four classes, VIII Putra-A, VIII Putra-B, VIII Putri-A and VIII Putri-B.
course there, the second grade students still had difficulties and made some mistakes in writing.
3.4.2. The Sample
Based on Arikunto (2006: 131), sample is a half or the representative of the examined population, in addition, Coolidge (2000: 24) states that sample is a smaller group of scores selected from the population of scores. Further, sample should be chosen with a certain techniques in order to get a sample that describes the real population.
Since a research needs a technique to get the sample, Setiyadi (2006) exposes two models of sampling procedure, which are probability sampling and non-probability sampling, in a quantitative research. Moreover, he states that a kind of probability sampling is cluster sample, which is defined as procedure of taking sample in a population involving some different classes that are in the same stratum. Therefore, by considering the above definitions and that the students of a Madrasah in Garut consist of four classes relatively having same characteristics, the writer chooses two classes (VIII Putri-A and VIII Putri-B) as the sample.
classes have different treatment in the process of writing. The experimental class would treat by using Microsoft Word and the control class by using their handwriting and paper in writing texts.
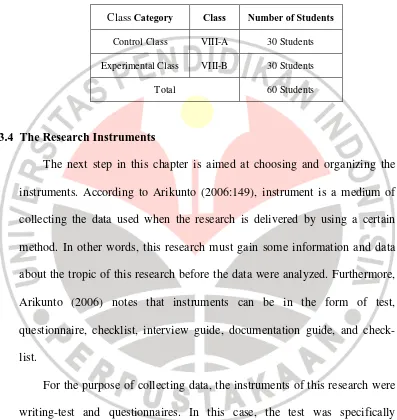
Table 3.2 Subject of the research Class Category Class Number of Students
Control Class VIII-A 30 Students
Experimental Class VIII-B 30 Students
Total 60 Students
3.4 The Research Instruments
The next step in this chapter is aimed at choosing and organizing the instruments. According to Arikunto (2006:149), instrument is a medium of collecting the data used when the research is delivered by using a certain method. In other words, this research must gain some information and data about the tropic of this research before the data were analyzed. Furthermore, Arikunto (2006) notes that instruments can be in the form of test, questionnaire, checklist, interview guide, documentation guide, and check-list.
the tests used as instrument in this research were in the form of writing test, which were divided into pre-test and post-test.
Firstly, the pre-test was designed to measure the initial ability of the students from both classes before the experimental class received the treatment of using Microsoft Word in writing texts. Secondly, the post-test was further managed after the treatment had been completed. The test used for both was in the form of free composition. Here, the writer created the worksheet himself and chose the descriptive text as the appropriate genre for the second grade students. At last, this research used questionnaires as the instrument to get more information from the respondents in term of their individual report (Arikunto, 2006: 151).
3.5 Data Collection Procedure
and control classes were given the post-test. Finally, the experimental class would also fill out the questionnaires related to the treatment of using Microsoft Word in improving their writing skills. Briefly, the writer will explain those procedures in the following details.
3.6.1. The Research Preparation
In preparing this research, the writer observed the spot of the research. After that, the preparation was focused on the teaching material and instruments. Besides, the writer needed to arrange the time allocation of the research.
Firstly, the term ‘material’ or often ‘lesson’ is defined as a unified set of activities that cover a period of classroom time (Brown, 2001: 149). Since this research is engaged with the second grade students of Madrasah Tsanawiyah or Junior High School, the classroom time ranged from forty to eighty minutes. Moreover, for the materials, the writer was adapted with English syllabus, textbooks, and certain topics learned by the second grade students of a Madrasah in Garut. Here, the books used by students were Writing to Learn by Spaventa & Spaventa and BKS PILA Bahasa Inggris by Emed Hidayat et al. Besides, the writer also searched and added the materials from network or other sources, and he focused the material on writing skill by relating it to one or the other two of other skills.
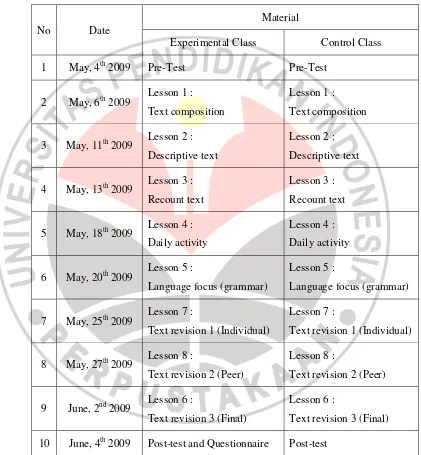
was held for about one month from May to June 2009. Thus, the treatments’ schedule of the treatment of the research is presented below.
Table 3.3 Schedule of Teaching
3.6.2. The Research Implementation
3.6.2.1. The Library research
Library research is one of the procedures in collecting data to gather the theoretical foundation that support the research. For the purpose of completing the theories related to writing skill, teaching writing, and the use of Microsoft Word in teaching writing, the writer read a number of research papers, books, journals, articles, and other literatures related to the research. To find those literatures, the writer mostly searched the data and information in the library and network.
3.6.2.2. Try-out test
Based on Heaton (1995), a good test must be valid, and practicable. Besides, Arikunto (2006: 168) states that a good instrument must achieve at least two important requirements, which are valid and reliable. For that reason, in this research, the writer tries out the instrument to another class in the same grade before the pre-test was administered.
3.6.2.3. Pre-Test
According to the teaching schedule, the pre-test was the first writing test. Administered to both experimental and control classes at the beginning of the research. The pre-test was intended for gaining the data of the students’ initial writing ability. Besides, this test was administered to ensure that the students of both group had the same English background and proficiency before the experimental class received the treatment. In addition, this pre-test was carried out to find out the equivalence of experimental and control classes.
3.6.2.4. Treatment
In this research, the Microsoft Word was used for implementing the treatment in teaching writing to the experimental class, yet the control class was treated by using their own handwriting and writing in writing texts. Here, both of the experimental and control class were asked to write and revise some compositions based on the certain genre and adapted to the English syllabus of the second grade of Junior High School by using different tools to write.
(peer-correction activities) in order to revise and to give comment on the work. The next step was editing the revised work by each student. Finally, those students had to collect the works to be further assessed by the writer.
3.6.2.5. Post-Test
Similar to the procedures of doing pre-test, post-test was the second writing test delivered to both experimental and control classes. At the end of the research, the writer administered post-test in order to find out the result of the treatment. The aim of this test was at finding whether or not there are some significant differences between students’ scores of the experimental and control classes after the treatment was conducted to the experimental class. In other words, the post-test was carried out in order to investigate the effectiveness of Microsoft Word in improving students’ writing skills to the second grade students of a Madrasah in Garut.
3.6.2.6. Questionnaire
distributed to the experimental class because this class received the treatment. Here, the questionnaire was created by using Bahasa Indonesia after the writer considered the English level of the second grade students of Junior High School. Besides, this questionnaire was delivered in the form of open-ended and close-ended questionnaires.
3.6 Data Analysis
The data gained from the first test to the questionnaires had to be calculated and analyzed in order to find out the result of the research. Since this research was basically intended to investigate the effectiveness of using Microsoft Word in improving students’ writing skills in a Madrasah in Garut, the data obtained from the research would be analyzed using Microsoft Excel 2007 and the certain statistical formula by following some certain procedures. As Arikunto (2006: 235) states that in analyzing the data, generally requires three stages: preparation, tabulation, and implementation. Briefly, the writer will explain those procedures in the following details.
3.7.1. Data Preparation
Further, since the main data were gained in the form of written achievement tests, the writer needed to assess the score of those writing test before he analyzed the result of those test in the next stage. Therefore, in this research, the scoring system of the students’ written works was based on ESL Composition Profile created by Jacobs et al. (1981 cited in Weigle, 2007: 116), and the scoring standard of ESL Composition Profile is described in table 3.4.
Table 3.4 ESL Composition Profile
Aspects of
Writing Score Level Criteria
Content
30-27 Excellent to very good
Knowledgeable substantive thorough development of thesis relevant to assigned topic
26-22 Good to average
Some knowledge of subject adequate range limited development of thesis mostly relevant to topic, but lack of detail.
21-17 Fair to poor Limited knowledge of subject little substance inadequate development of topic
16-13 Very poor
Does not show knowledge of subject non-substantive not pertinent not enough to evaluate
Organization
20-18 Excellent to very good
Fluent expression ideas clearly
stated/supported succinct well-organized logical sequencing cohesive
17-14 Good to average
Somewhat choppy loosely organized but main idea stand out limited support logical but incomplete sequencing
13-10 Fair to poor Not fluent ideas confused or disconnected lack logical sequencing and development
9-7 Very poor Does not communicate no organization not enough to evaluate
Vocabulary
20-18 Excellent to very good
Sophisticated range effective word/idiom choice and usage word from mastery appropriate register
17-14 Good to average
13-10
Fair to poor
Limited range frequent error of word/idiom form, choice and usage meaning confused or obscured
9-7 Very poor
Essentially translation little knowledge of English vocabulary, idiom, word form not enough to evaluate
Language Use
25-22 Excellent to very good
Effective complex construction few of errors of agreement, tense, number, word order/function, articles, pronouns, and preposition
21-18 Good to average
Effective but simple construction minor problems in complex construction several of errors of agreement, tense, number, word order/function, articles, pronouns, and preposition but meaning seldom obscured
17-11 Fair to poor
Major problems in simple/complex construction frequent errors of negation , agreement, tense, number, word
construction rules dominated by errors does not communicate not enough to evaluate
Mechanics
5 Excellent to very good
Affective demonstrates mastery of convention few error of spelling,
punctuation, capitalization and paragraphing capitalization and paragraphing poor handwriting meaning confused or obscured
2 Very poor
3.7.2. Data Tabulation
In this second stage, after the writer described and classified the scoring standard of the writing test based on the ESL Composition Profile created by Jacobs et al. (1981 cited in Weigle, 2007: 116), the writer and two other judges firstly scored the students’ writing tests. Furthermore, the scoring standard involves content, organization, vocabulary, language use, and mechanics.
3.7.3. The Data Implementation
3.7.3.1. The Test Instrument Analysis
As Hatch and Farhady (1982: 243) states that there are three basic characteristics of test involve reliability, validity, and practically. Thus, in this research, the writer first tried out the instrument to another class in the same grade before the pre-test was administered. This try out test was carried out in order to measure the reliability, validity, and practically of the instrument. To gain the result of the try-out test, those three characteristics will be analyzed in the following details by using the certain statistical formula.
3.7.3.1.1 Reliability Analysis
produces consistent result when administered under similar condition. For that purpose, in administering the try-out test, the students should do the test within specified time period, and they were not allowed to take the test at home.
Since the main instrument of this research was in the form of essay test, firstly, the writer assessed students’ composition by using the analytic scales in ESL (Jacob et al., 1981 cited in Weigle, 2007: 116). Furthermore, the writer analyzed the instrument reliability by using Alpha Cronbach formula (Arikunto, 2006: 196), and the procedures are:
a. Determining the variance of item ( )
= −
Where
= Sumof square of item, = Sumof square of subject, = Number of sample
b. Determining the variance of total score ( ) = ∑ − ∑
c. Determining the instrument reliability ( ) with the Alpha formula;
r = 1 −∑
Where
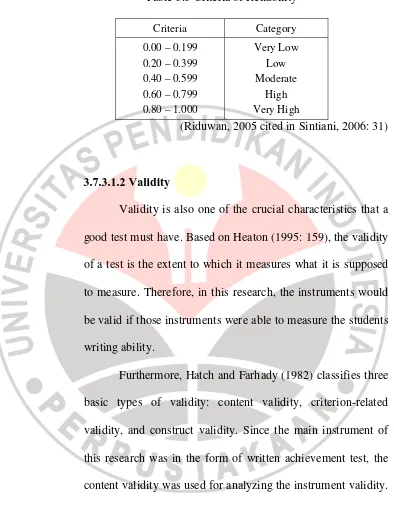
d. Checking the finding with the criteria of reliability. Table 3.5 Criteria of Reliability
Criteria Category
0.00 – 0.199 0.20 – 0.399 0.40 – 0.599 0.60 – 0.799 0.80 – 1.000
Very Low Low Moderate
High Very High
(Riduwan, 2005 cited in Sintiani, 2006: 31)
3.7.3.1.2 Validity
Validity is also one of the crucial characteristics that a good test must have. Based on Heaton (1995: 159), the validity of a test is the extent to which it measures what it is supposed to measure. Therefore, in this research, the instruments would be valid if those instruments were able to measure the students writing ability.
Furthermore, Hatch and Farhady (1982) classifies three basic types of validity: content validity, criterion-related validity, and construct validity. Since the main instrument of this research was in the form of written achievement test, the content validity was used for analyzing the instrument validity. Based on Hatch and Farhady (1982: 251), a content validity is defined as the extent to which the test measures a representative sample of the subject matter content.
discrimination power proposed by Arikunto (2006) and was helped by using Microsoft Excel 2007, and the procedures are as follows;
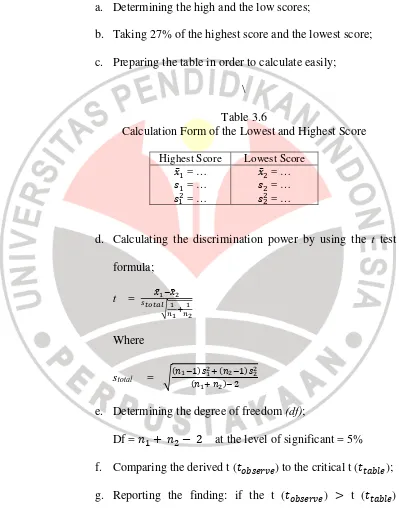
a. Determining the high and the low scores;
b. Taking 27% of the highest score and the lowest score; c. Preparing the table in order to calculate easily;
\ Table 3.6
Calculation Form of the Lowest and Highest Score Highest Score Lowest Score
!̅ = … = … = …
!̅ = … = … = …
d. Calculating the discrimination power by using the t test formula;
t = ̅# ̅
$%##&%#
' ()
Where
stotal = $ # #&
#&
e. Determining the degree of freedom (df);
Df = + − 2 at the level of significant = 5% f. Comparing the derived t (-./ 0120) to the critical t (-3/40); g. Reporting the finding: if the t (-./ 0120) > t (-3/40)
3.7.3.1.3 Practicality Analysis
After the reliability and validity of the instrument were investigated, the practicality of the instrument should also be analyzed. As Heaton (1995: 167) states that a test must be practicable. In addition, Hatch and Farhady (1982: 254) states that some practical consideration as follows: the test should be easy to administer, the test should be as inexpensive as possible, the test should be easily scored, and the score should be easy to interpret. For the purpose of practicality, the writer conducted the try-out test by considering those rules.
3.7.3.2 Pre-Test Data Analysis
Pre-test was the first writing test delivered to the experimental and control groups in order to find out the data of the students’ initial writing ability. Since this research engaged two classes of participants, the experimental design and procedure were statistically analyzed by the formula of Independent-Sample t test for calculating data.
(homogenous). For that purpose, the writer will be analyzed those assumptions can be noticed in the following details.
3.7.3.2.1 Testing the Normality of Distribution
The aim of testing the normality of distribution is for finding out whether or not the samples are from a population of values that is normally distributed. In this research Chi Square formula is used in testing the normality of distribution, and the procedures are as follows:
a. Stating the hypotheses in sentence and setting the level of significance at 0.05 (two-tailed test of significance)
67 : The scores of the experimental and control groups are not normally distributed
b. Calculating the normality of distribution;
c. Comparing 8./ 0120 to 83/40 with the level of significance at 0.05 for testing the hypothesis and reporting the findings: “67 is rejected if 8./ 0120 < 83/40 with the level of significance at 0.05.
3.7.3.2.2 Testing the Homogeneity of Variance
a. Stating the hypotheses in sentence and setting the level of significance at 0.05 (two-tailed test of significance)
67 : The scores of the experimental and control groups are not homogenous.
b. Calculating the homogeneity of variance;
c. Comparing 9./ 0120 to 93/40 with the level of significance at 0.05 for testing the hypothesis and reporting the findings: “67 is rejected if 9./ 0120 < 93/40 with the level of significance at 0.05.
3.7.3.2.3 Testing the Independent-Sample t Test
If the data of this research were proved as normal and homogenous data, the next step was to test the hypothesis of the research. For that purpose, the writer decided to use the independent-samples t test.
a. Stating the hypotheses in sentence and setting the level of significance at 0.05 (two-tailed test of significance)
67 : There is no significant difference between the pre-test means for experimental group and control group.
b. Calculating the Independent-Samples t Test;
reporting the findings: “67 is rejected if -./ 0120 > -3/40 with the level of significance at 0.05”.
3.7.3.3 Post-Test Data Analysis
Post-test was delivered in order to find out whether or not there is significant difference between students’ scores of the experimental and control classes after the treatment was conducted to the experimental class. Since this test was similar to pre-test, the procedures of analyzing data of the post-test were also similar to the procedures of analyzing data of the pre-test.
3.7.3.4 Questionnaire Data Analysis
The questionnaire was analyzed to get a clearer evidence of the effectiveness of using Microsoft Word in improving students’ writing skills in a Madrasah in Garut and to find out the students’ responses towards the use of Microsoft Word in writing class. After the students took the post-test, they were given list of simple questions to be answered based on the students’ opinions. In this research, the questionnaire was in the form of open-ended and close-ended questionnaire which consist of 10 questions.
1. Do the students think that Microsoft Word is helpful to them?
2. If Microsoft Word is helpful in their writing, why do the students think this method is helpful to them (in term of the advantages of this method)?
3. What are significant factors contributing to the success of writing that uses Microsoft Word in improving their writing skills?
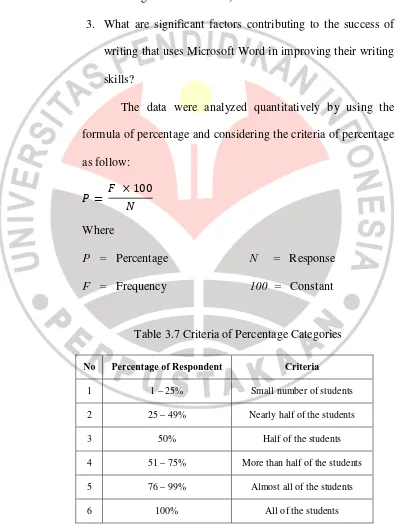
The data were analyzed quantitatively by using the formula of percentage and considering the criteria of percentage as follow:
: = 9 × 100>
Where
P = Percentage N = Response F = Frequency 100 = Constant
Table 3.7 Criteria of Percentage Categories
No Percentage of Respondent Criteria
1 1 – 25% Small number of students
2 25 – 49% Nearly half of the students
3 50% Half of the students
4 51 – 75% More than half of the students
5 76 – 99% Almost all of the students