22
CHAPTER III
RESEARCH METHOD
This section discusses some important aspects related to research method. These include research design, population and sample, instrument, variables of the study, data collection, data analysis and teaching program.
3.1 Research Design
This research was quantitative research in nature in which the data were in the forms of test scores and the analysis was done statistically.
This research was also classified as experimental research, because the independent variable was specially manipulated in order to see its effect on the dependent variable. Fraenkel & Wallen (2007) states that the essential characteristic of all experiments is that the researcher actively manipulates the independent variables, meaning that the researcher deliberately and directly determines what forms the independent variable will take and then which group will get which form.
23
effect of the independent variable on the dependent one was one group pretest- posttest design.
Diagram
Research Design
A O X O
In one group pretest – posttest design a single group of subjects was given a pretest (O), then the treatment (X), and then the posttest (O). The pretest and posttest were the same, just given at different times. The result that was examined was a change from pretest to posttest (McMillan and Schumacher, 2001).
3.2. Population and Sample
3.2.1. Population
This research involved the second year students of SMP Negeri 1 Kauditan, Manado. The second year students were chosen considering some following reasons. First, the speaking ability of the second graders seems to be lower than it was expected. They learnt English for a year, but their speaking ability was not developed. The result of this research was
Group Pretest Treatment Posttest
24
expected to help teachers to find the effective methods of teaching in accordance with the students’ learning styles. Second, it is believed that the second graders sufficient employed their preferred learning styles in the way they have been learning since the first grade.
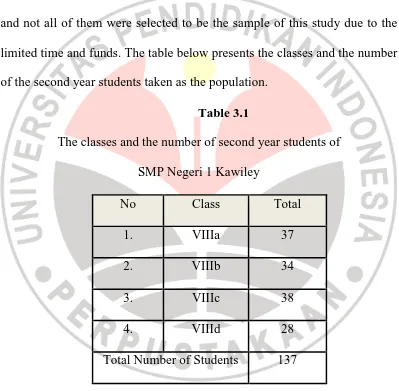
There are four classes involved in this research as the population and not all of them were selected to be the sample of this study due to the limited time and funds. The table below presents the classes and the number of the second year students taken as the population.
Table 3.1
The classes and the number of second year students of SMP Negeri 1 Kawiley
No Class Total
1. VIIIa 37
2. VIIIb 34
3. VIIIc 38
4. VIIId 28
25
3.3.2. Sample
The sample of the research was taken from the population through purposive sampling, meaning that the sample was taken based on certain consideration. As Fraenkel and Wallen ( 2007: 100) stated:
On occasion, based on previous knowledge of a population and the specific purpose of the research, investigators use personal judgment to select a sample. Researchers assume they can use their knowledge of the population to judge whether or not a particular sample will be representative.
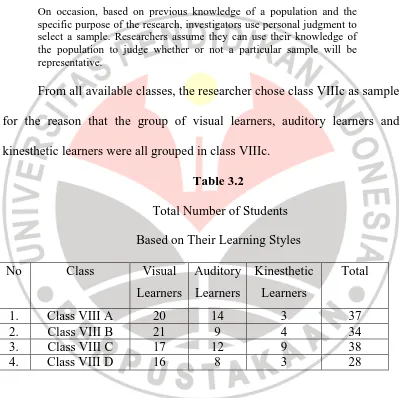
From all available classes, the researcher chose class VIIIc as sample for the reason that the group of visual learners, auditory learners and kinesthetic learners were all grouped in class VIIIc.
Table 3.2
Total Number of Students Based on Their Learning Styles
26
3.3. Instruments
The data in this research were collected using English speaking test in the form of controlled interview test. The subjects of the research were given pre test and post test after the treatment.
The scoring system used in the test was adapted from Hadley, 2001: 444 (see Appendix 3). Before the test was conducted, test of content validity and reliability were done.
Scarvia et al. (1975) as cited in Arikunto (2007) claims that a test is valid if it measures what it has to be measured. To obtain a valid result this study employed logical validity test in which the test was arranged based on
the careful reasoning and in line with the teaching objective (Arikunto, 2007). Since this study conducted to measure the
speaking ability through the provisions of activities based on their learning styles so the test was in the form of oral interview test in accordance with the activities given to the students i.e. picture narrating, discussion and role play. The researcher also asked her advisors to look at the content and format of the instrument and judge whether or not it is appropriate (Fraenkel and Wallen, 2007).
27
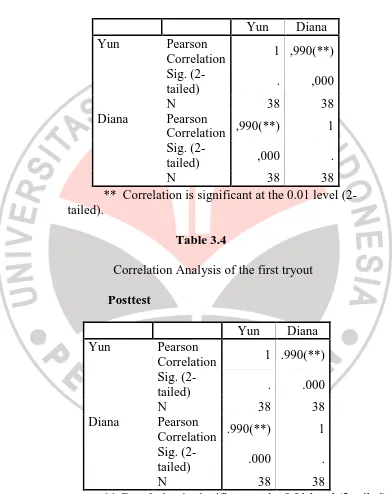
produced by two raters and a correlation coefficient is calculated between them (Brown J.D., 1990). The researcher asked the English teacher at the school to be a rater accompanying the researcher in giving scores to the oral interview test. The scores of the two raters (i.e. the researcher and the English teacher) then be calculated using correlation analysis (Pearson Product Moment).
28
Table 3.3
Correlation Analysis of the first tryout
Pretest
** Correlation is significant at the 0.01 level (2-tailed).
29
Table 3.5
Correlation Analysis of Second Tryout
Pretest
** Correlation is significant at the 0.01 level (2-tailed).
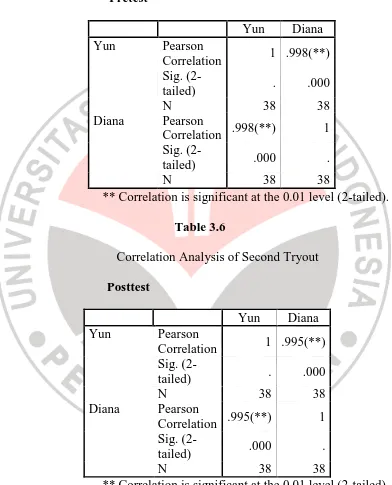
Table 3.6
Correlation Analysis of Second Tryout
Posttest
30
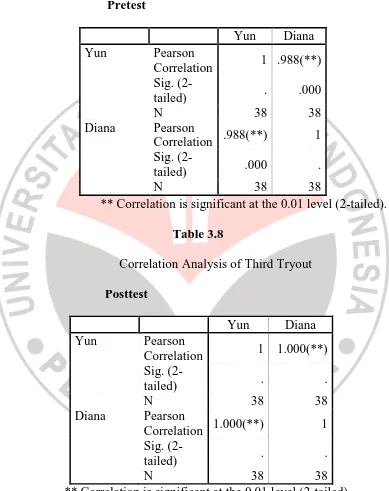
Table 3.7
Correlation Analysis of Third Tryout
Pretest
** Correlation is significant at the 0.01 level (2-tailed).
Table 3.8
Correlation Analysis of Third Tryout
Posttest
** Correlation is significant at the 0.01 level (2-tailed).
31
3.4. Variables of The Study
Independent variables are those that the researcher chooses to study in order to assess their possible effects on one or more other variables. The variable that the independent variable is presumed to affect is called dependent variable (Fraenkel and Wallen, 2007).
Since this study intended to see the effect of providing activities based on students’ learning styles to develop students’ speaking ability, so the speaking activities i.e. picture narrating, discussion and role play became the independent variables to see their effects on the speaking ability as the dependent variable.
3.5. Techniques for Collecting Data
The techniques of collecting data used in this research were pre test and post test. The pre test and post test were conducted to get a clear description of the influence of providing activities based on students’ learning styles to develop students’ speaking ability.
The pre test was carried out to identify the learners’ initial ability in speaking skill. It was given in the first meeting to know the students’ ability in speaking before they had the treatment. The test was in the form of oral interview consisted of some semi structured questions.
32
3.6. Data Analysis
3.6.1. Score Data Analysis
Quantitative data in the forms of pretest and posttest scores from the three groups were statistically analyzed and then compared by using ANOVA or Analysis of Variance in order to determine whether the three groups of learning styles differ significantly within and between variables.
The computation was conducted three times concerning there were three groups of learning styles involved in the study. The first step was computing ANOVA of the groups when picture describing and narrating activity was applied. The second one was computing ANOVA of the groups when discussion activity was applied. And the third one was computing of the groups when role play activity was applied.
There are 38 sample respondents whose data are considered to be worth analyzing: 17 respondents from visual group, 12 respondents from auditory learners and 9 respondents from kinesthetic group. The statistical analysis was computerized using SPSS 12 program. The hypotheses testing were conducted to see whether H0 is accepted or rejected.
3.6.2. Hypotheses Testing
Null Hypotheses:
33
b. There is no difference among the groups (i.e. visual, auditory, kinesthetic) when speaking activities (i.e. picture describing and narrating activity, discussion activity, role play activity) were applied.
Alternative Hypotheses:
a. Providing activities according to students’ learning styles develops
students’ speaking ability.
b. There is a difference among the groups (i.e. visual, auditory, and kinesthetic) when speaking activities (i.e. picture describing and narrating activity, discussion activity, role play activity) were applied.
To test the alternative hypotheses (H1), it is accepted if :
a. Mean of posttest scores is higher than that of pretest scores of the groups.
b. F obs of the ANOVA computation is greater than F table.
Meanwhile, to test null hypotheses (H0), there are also some assumptions that is to be fulfilled. Null hypotheses (H0) are accepted if:
a. There is no significant difference between the pretest scores and the
posttest scores of the groups.
34
3.7. Teaching Program
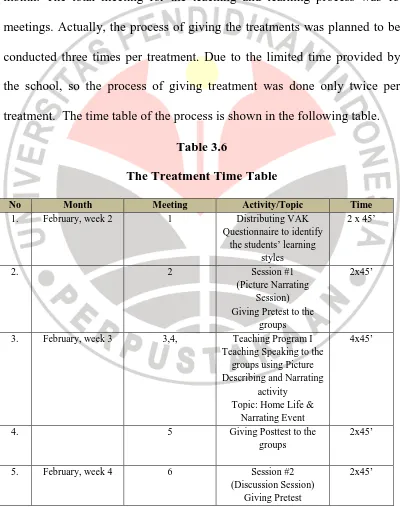
The process of teaching and learning for the subject was carried out under the same manner as the usual process in the school. It means that the actual face to face meeting for class is conducted three times a week for a month. The total meeting for the teaching and learning process was 13 meetings. Actually, the process of giving the treatments was planned to be conducted three times per treatment. Due to the limited time provided by the school, so the process of giving treatment was done only twice per treatment. The time table of the process is shown in the following table.
Table 3.6
The Treatment Time Table
No Month Meeting Activity/Topic Time
35
No Month Meeting Activity/Topic Time
6. 7 Teaching Program II
The description of the teaching activities can be seen below. a. Preliminary phase of the teaching program
The researcher distributed the questionnaire to each class of the second grade to find sufficient number covered in the three classification of learning styles.
36
b. Classroom activities for session #1 (Picture Narrating Activity) Skill focus : Speaking
Level : Junior High School
Class : VIII
Time : 4 meetings @ 2x45’
Material and Equipment : Text (Home Life and Narrative event) Pictures to describe and narrate
Presentation
First Meeting
• Teacher gives pre-test i.e. asking the students one by one about
the description of their houses without giving them picture. (Oral Interview)
Second Meeting
• Teacher gives text about home life plus picture.
• Teacher explains the text.
• Teacher asks the students about home life through picture
describing.
• Students practice describing the pictures about home life in
groups.
Third Meeting
37 • Teacher explains the text.
• Teacher asks the students about life events through picture
narrating.
• Students practice narrating events in the pictures.
Fourth Meeting
• Teacher gives post-test i.e. asking the students to describe some
pictures and narrate some events in the pictures. c. Classroom activities for session #2 (Discussion Activity)
Skill focus : Speaking
Level : Junior High School
Class : VIII
Time : 4 meetings @ 2x45’
Material and Equipment : Text (Friendship and Teenager’s life Presentation
First Meeting
• Teacher gives pre-test i.e. asking the students one by one about
friendship.
Second Meeting
• Teacher gives text about friendship
• Teacher explains the text.
38
• Students discuss some issues about friendship in groups.
Third Meeting
• Teacher gives text about teenagers’ life
• Teacher explains the text.
• Teacher asks the students to discuss about teenagers’ life in
pairs.
• Students discuss some issues about teenagers’ life in pairs.
Fourth Meeting
• Teacher gives post-test i.e. asking the students one by one about
some issue in teenagers’ life.
d. Classroom activities for session #3 (Role Play Activity) Skill focus : Speaking
Level : Junior High School
Class : VIII
Time : 4 meetings @ 2x45’
Material and Equipment : Text (Travelling and Holidays) Asking Direction
39
First Meeting
• Teacher gives pre-test i.e. asking the students the way they get to
school.
• Second Meeting
• Teacher gives text about places to go during holiday.
• Teacher explains the text.
• Teacher asks the students to act out some dialogues.
• Students practice role play in the classroom.
Third Meeting
• Teacher gives text about travelling
• Teacher explains the text.
• Teacher asks the students to act out some dialogues.
• Students practice role play in the classroom.
Fourth Meeting
• Teacher gives post-test i.e. asking the students to do role play.
The whole description of the teaching program can be seen on appendix 2.
3.8. Conclusion
40