CHAPTER III
RESEARCH METHOD
In this chapter, research method is briefly outlined for this study including
research design, variable and hypothesis. This chapter also consists of population
and sample, data collection, evaluating test instrument (instrument validity and
instrument reliability with discrimination and difficulty index), treatment
implementation, data analysis (analyzing data on test score, pretest, posttest, and
from observation) and research procedure.
3.1. Brief Explanation to Research Method
Research method is clearly stated by Dawson (2009) as the way or means
to gather the data. Meanwhile research, as Creswell (2008) gives meaning, is as a
series of actions or steps used to collect and analyze information to enhance our
understanding of a topic or issue. Fraenkel and Wallen (1996) express that, the
essence of all research originates in curiosity, a desire to know how and why
things happen, including why people do the things they do, as well as whether or
not certain ways of doing things work better than other ways. In short, research is
simply defined as a systematic approach to finding answers to questions (Hatch
and Farhady, 1982). Therefore, it can be concluded that research method is the
way or means we use to collect the data in our research in order to find the answer
of the research problems.
There are three recognized methods for conducting research: quantitative,
Qualitative research is a term with various meanings in educational Research
(Savenye and Robinson, 2003). According to Hancock (1998), qualitative
research is concerned with the opinions, experiences and feelings of individuals
producing subjective data and it is concerned with developing explanations of
social phenomena as they occur naturally and no attempt is made to manipulate
the situation under study. Fraenkel & Wallen (1996) refer qualitative research as
the research studies that explore the quality of relationships, activities, situations
or materials. Moreover this method is given shape by the theory from Dawson
(2009: 14) who states that ―qualitative research explores attitudes, behavior and experiences.‖
Meanwhile, quantitative research is described as empirical, using numeric
and quantifiable data (Belli, 2008). Marczyk, DeMatteo, & Festinger (2005: 17),
state, ―Quantitative research involves studies that make use of statistical analysis to obtain their finding.‖ Experiment is frequently regarded as prime examples of
quantitative research and is evaluated against the strengths and weaknesses of
statistical, quantitative research methods and analysis (De Vaus, 2001).
The last one is mixed method. This method involves both collecting and
analyzing quantitative and qualitative data (Creswell, & Plano Clark, 2006).
Johnson, Onwuegbuzie, and Turner (2007: 112) express,
Bazeley (2002), argues that when thinking mixed method, in terms of some
combination of qualitative and quantitative approaches to research are considered
by most social scientists. And according to Bryman (2006: 97) ―There can be little doubt that research involves the integration of quantitative and qualitative
research has become increasingly common in recent years.‖
There are three types of mixed method according to Creswell (2008): 1.
triangulation mixed method (equal priority to both quantitative and qualitative
data), 2. embedded mixed method (priority to the major form of data collection, e.
g., often quantitative data, and secondary status to the supportive form, e. g. often
qualitative data collection as additional to the primary form), 3. explanatory
mixed method (a priority on quantitative data collection and analysis followed by
small qualitative data collection and analysis in the second phase of the research
or conversely)
This study used embedded mixed method (combining quantitative and
qualitative methods, priority to the major form of quantitative data collection, and
secondary status to the supportive form qualitative data collection as additional to
the primary form).
3.1.1. Research Design
There are eight research designs often used in educational research as
mentioned by Creswell (2008). He states the first three are quantitative, the next
three are qualitative, and the final two combine quantitative and qualitative
design, survey research design, grounded theory design, ethnography design,
narrative research design, mixed method design, action research design.
To find out the answer for the first research question, this study used
experimental research design. According to Marczyk, DeMatteo, & Festinger
(2005: 3), ―Experiment research involves comparing two groups on one outcome measure to test some hypothesis regarding causation.‖ In other words, it is a study
in which an intervention is intentionally introduced to observe its effects (Shadish,
Cook, & Campbell, 2001). Hatch and Farhady (1982) mention that there are major
classes of this design, as can be seen in the table below:
Table 3.1
Major Classes of Experimental Research Design
Class Explanation
Pre-experimental
design
It is not really considered model experiments because it
does not account of extraneous variables which may have
influenced the results.
True experimental
design
It has three basic characteristics:
(1) a control group (or groups) is present,
(2) the students are randomly selected and assigned to
the groups, and
(3) a pre-test is administered to capture the initial
Quasi-experimental
design
It is practical compromises between true experimentation
and the nature of human language behavior to be
investigated.
Ex post facto design
It is used when the researcher does not have control over
the selection and manipulation of the independent
variable. The researcher looks at the type and/or degree
of relationship between the two variables rather than at a
cause and effect relationship.
Factorial design
It is simply the addition of more variables to the other
designs. There will be more than one independent
variable (i. e., moderator variables) considered and the
variables may have one or many levels.
In this case, the type of experimental research design employed was
quasi-experimental design. This design as Fraenkel, & Wallen (1996); Creswell, (2008)
state, is an experiment in which units are not assigned randomly. It is two or more
intact groups (members of which were not randomly assigned) are compared after
one (or more) has been given a specified treatment (Fraenkel, & Wallen, 1996).
Therefore, to know whether TPR method is effective in English
vocabulary mastery of elementary school children this study employed a
quantitative method research and it used a quasi-experimental design because it
did not include the use of random selection involving two groups (control and
Table 3.2
Description of Research Design
Experiment
Class
Pretest X (treatment with TPR method) Posttest
Control Class Pretest X (treatment with conventional
method)
Posttest
Besides using quantitative method involving a quasi-experimental design,
this research employed qualitative method conducting observation using field
notes to investigate students‘ responses toward teaching English vocabulary using TPR method. Observation was employed to know students‘ behavior and
responses during the treatment given to the experiment group. The field note was
to describe their behavior and responses toward the method during the class. To
transcribe, classify and interpret the data from observation, therefore, qualitative
approach was used because in this research as according to Nunan (1992: 4),
qualitative research emphasizes ―understanding human behavior from the actor‘s
own frame of reference, naturalistic and uncontrolled observation, subjective close
to the data the ‗insider‘ perspective.‖
3.1.2. Variable
There are two variables involved in this research, independent and
from object to object.‖ They state that independent variable is major variable to be
investigated, which is selected, manipulated, and measured by the research. On
the other hands, in their opinion, dependent variable is variable to be observed and
measured to determine the effect of the independent variable. In line with their
opinion, Lane (2003: 1) mentions variables are as ―properties or characteristics of some event, object, or person that can take on different values or amounts.‖ He
states when conducting research, experimenters often manipulate variables. He
further explains that the variable manipulated by an experimenter is named
independent variable and dependent variable is the variable when the
experimenter seeks to determine the effect of the independent variable.
This research is about the effectiveness of Total Physical Response
method in English vocabulary mastery of elementary school children. Therefore
the independent variable of this research is Total Physical Response method, and
the dependent variable is English vocabulary mastery.
3.1.3. Hypothesis
Hypothesis, according to Marczyk, DeMatteo, & Festinger (2005: 8), is
―simply an educated—and testable—guess to your research question.‖ Based on
their opinion, it can be concluded that hypothesis is prediction about expected
relationship between two variables tested in our research.
Null hypothesis (H0)was used in this research as foundation. It means that
there will be no differences between groups being studied (Marczyk, DeMatteo, &
experiment and control group in English vocabulary mastery at the time the
pretest had given to both groups.
Alternative hypothesis (Ha), on the other hand, means that there will be
difference between groups being studied (Marczyk, DeMatteo, & Festinger,
2005), was used to indicate that there was significant difference between the
experiment and control group in English vocabulary mastery at the time the
posttest had given to both groups.
3.2. Population and Sample
A ―population‖ consists of all the subjects to be studied and ―sample‖ is a
(smaller) group of subjects which represents a (larger) population (Yount, 2006).
The population of this research was elementary school children in one
Islamic elementary school in Cibiru Bandung. The sample was students of the
first class, class A (21 students) as control group and class B (21 students) as
experiment group. The participant, as students involved in this research learnt
English only at school and received the subject of very basic English once in a
week. Hence the researcher hoped that materials given would be in line with their
English capacity.
3.3. Data Collection
The data or kinds of information obtained in this research were collected
3.3.1. Pretest
Pretest in the form of multiple choices with 17 items of vocabularies to be
taught was given to both control and experiment group after it had tested to other
group as pilot test (pretesting of research instrument), to know the students‘ initial ability in English vocabulary and to make sure that the initial ability of the two
groups was not significant difference.
3.3.2. Observation
To get additional data to support the data gained from pretest and posttest,
the researcher conducted observation herself during the treatment given to the
experiment group. It was employed to know students‘ behavior and responses
toward teaching English vocabulary using TPR method.
The observation was conducted in this research as it gathers first hand
information about social processes in a naturally occurring context as stated by
Silverman (1993). Besides, it is emphasized by Merriam (1998) who states that
one of the reasons why an investigator gathers data through observation is to
observe things which may lead to understanding the context. Moreover, in line
with Merriam, Alwasilah (2006) states that observation is performed to make a
conclusion about meaning respondents‘ perspective and event or processes
observed.
In conducting the observation, the researcher used field notes. This
instrument was used because the respondents were still the first graders and in
order to make them act naturally, so that they would not know that their activities
gained would answer the second question of this research, to know the students‘
response to teaching English vocabulary using TPR (Total Physical Response)
method.
Field notes here, as Fraenkel & Wallen (1996: 459) state, are as the
detailed notes observers take in the educational setting (classroom or school)
about what is going on, what they hear, see, experience, and think in the course of
collecting and reflecting on their data.
3.3.3. Posttest
Finally, posttest in the form of multiple choices with 17 items of
vocabularies the students had learnt was given to both control and experiment
group to know the progress of the students‘ vocabulary mastery. By comparing
the result of pretest and posttest, it would be known whether the use of TPR
method was effective or not.
3.4. Evaluating Test Instrument
To gain accurate data, the test instrument used in this research requires the
two most important and fundamental characteristics of any measurement
procedure, validity and reliability (Miller, 2009). Therefore, to investigate the
validity and reliability of the test instrument, pilot test was conducted before
implementing it to the research. The pilot test consisted of 20 multiple choice
questions (about the subject to be taught to experiment and control groups) and
was given to another group, the first grade of one state elementary school in
3.4.1. Instrument Validity
Miller (2009: 1) defines instrument validity as ―the extent to which the instrument measures what it purports to measure over time or across raters.‖
According to Burton & Mazerolle, (2011: 28), ―It refers to the degree that an
instrument actually measures what it is designed or intended to measure.‖ In other words, it is about finding out if a test actually does measure what is intended
(Fulcher and Davidson, 2007; Hughes, 2003).
The validity of each test item as Arikunto (2009: 78) states, can be
measured by the technique of Pearson‘s product moment. Therefore, the test instrument validity was measured by the technique above using Anates for
multiple choices and can be interpreted by the criteria from Arikunto (2009: 75),
in the table below:
Table 3.3
Interpretation of r Coefficient
Raw Score Interpretation
0. 800 – 1.00 Very high
0. 600 – 0.800 High
0.400 – 0.600 Moderate
0.200 – 0.400 Low
The measurement result of the test instrument validity is presented in the
subchapter below.
3.4.1.1. The Measurement Result of Test Instrument Validity
The validity of test instrument measured by the technique of Pearson‘s
product moment using Anates for multiple choices is 0.63. Based on the table 3.3,
it can be interpreted that the instrument has high validity. To give clearer
description, the result of test item validity is also provided in the table below:
Table 3.4
The Result of Test Item Validity
Validity
Item Numbers Score Interpretation
3, 4, 5, 6, 7, 8, 9, 11, 12, 13, 14,
16, 17, 18, 19, 20
>0.361 Valid
1, 2, 10 <0.361 Invalid
Note: The raw score of validity obtained from rcritical (2 - tailed) in the table of Pearson
Moment Correlation with N = 30 and the significance level of 0.05, is 0.361.
Based on the table above, considering the validity of each test item, the
items used in the pre-test were 17, number 3, 4, 5, 6, 7, 8, 9, 11, 12, 13, 14, 15, 16,
17, 18, 19, and 20. Whereas, the rest of the items, number 1, 2, 10 are not
appropriate to be used as the research test instrument.
Instrument reliability is defined by Miller (2009: 1), ―as the extent to which a questionnaire, test, observation or any measurement procedure produces
the same results on repeated trials.‖ According to Burton & Mazerolle, (2011: 27),
―It refers to consistency or repeatability of a test or measurement.‖ In short it is
consistent and dependable (Brown, 2004; Woodley, 2004).
The reliability of the test including discrimination index, ―a measure of how well an item is able to distinguish between examinees who are
knowledgeable and those who are not, or between masters and non-masters,‖
(Professional Testing Inc., 2006: 1) and difficulty index, ―a measure of the
proportion of examinees who answered the item correctly‖ (Professional Testing
Inc., 2000: 1) were computed using Anates for multiple choice.
For the reliability of a test, it can be interpreted by the following criteria
from Karlik (2002) in the next table.
Table 3.5
r Coefficient Corelation
r Coefficient Corelation
0.0-0.2 very weak or negligible
0.2-0.4 weak or low
0.4-0.7 moderate
0.7-0.9 strong, high, or marked
0.9-1.0, very strong or very high
For discrimination index, according to Arikunto (2009: 218), is
Table 3.6
Criteria of Discrimination Index
Discrimination index Interpretation
0.00 – 0.20 Poor
0.20 – 0.40 satisfactory
0.40 – 0.70 good
0.70 – 1.00 excellent
Moreover, in her opinion for difficulty index, it is often classified as:
Table 3.7
Criteria of Difficulty Index
Difficulty index Interpretation
0.00 – 0.30 difficult
0.30 – 0.70 moderate
0.70 – 1.00 easy
The measurement result of test instrument reliability and the results of
discrimination and difficulty index are presented in the subchapter below.
3.4.2.1. The Measurement Result of Test Instrument Reliability
The reliability test instrument measured by the technique of Pearson‘s
it can be interpreted that the instrument has high reliability. In addition, the results
of discrimination and difficulty index measured by the same technique are also
presented in the next table.
Table 3.8
The Result of Discrimination and Difficulty Index
Discrimination
Index
Item Numbers Score Interpretation
1, 10 < 0.20 Poor
2, 4, 17, 9 0.20 – 0.40 Satisfactory
3, 5, 6, 7, 8, 11, 12, 13, 14, 15,
16, 19, 20 0.40 – 0.70
Good
18, 0.70 – 1.00 Excellent
Difficulty
Index
8, 10, 12, 14, 17 0.00 – 0.30 Difficult
2, 3, 5, 7, 11, 13, 15, 18, 19 0.30 – 0.70 Moderate
1, 4, 6, 9, 16, 20 0.70 – 1.00 Easy
Based on the table above, considering the discrimination index of each test
item, the item numbers 1 and 10 are not appropriate to be used as the research test
instrument as they are poor to be able to distinguish between examinees who are
knowledgeable and those who are not, or between masters and non-masters.
For the difficulty index, from 20 test items, 6 items (number 1, 4, 6, 9, 16,
are categorized moderate, and 5 items (number 8, 10, 12, 14, and 17) are
categorized difficult.
3.5. Data Analyses
3.5.1. Analyzing Data on Test Score
There are two types of formula to analyze score of multiple choice tests,
with punishment and without punishment (Arikunto, 2009). In this research, the
score was analyzed without punishment with the formula:
S = R
S = raw score,
R = right answer (Arikunto, 2009: 120).
3.5.2. Analyzing Data on Pretest
The pretest was given to both experiment and control group before the
treatment (experiment group with TPR method, control group with conventional
method) to know the students‘ initial ability and students‘ initial equality between
the groups and to make sure that the initial ability of the two groups was not
significant difference.
The data on pretest were measured by independent t-test, also called a
between-subjects t-test to determine if the mean value on a given target variable
for one group differs from the mean value on the target variable for a different
group (DeCoster, 2004).
According to Hatch & Farhady (1982), in using t-test to compare two
―(1) the subject is assigned to one (and only one) group in the experiment; (2) the scores are continuous and that there are only to levels to the variable (i. e., only
two means; (3) the variances of the scores in the population are equal, and the scores are normally distributed.‖
In this case, they state that we need to state null hypothesis (H0, the
difference between the two sample means is zero or not significant) and
alternative hypothesis (Ha, the difference between the two sample means is
significant) and set our significance level at .05.
Next, they (ibid., p. 112) mention that we can find the t value with the
following formula:
xe - xc tobs = __________
s(xe – xc)
xe = score mean of experiment group
xc = score mean of control group
s(xe – xc) = standard error of differences between the means
At this point, in their opinion, we need the critical value for t to be
compared with the t value and if the t value is below t critical, the two groups are
not significant difference.
Besides, the data on pretest can be measured by independent t-test using
SPSS statistical analysis package with the steps as follows:
Step 1: A statement of statistical hypothesis
Ho : μ1 = μ2 or means for two groups are equal
Step 2: Setting the α level of risk associated with the null hypothesis (or Type I error). The level of Type I error is .05.
Step 3: Test statistic using SPSS
Step 4: Interpreting results.
(Hayes, 2000)
3.5.3. Analyzing Data on Post-test
The posttest was given to experiment and control groups after the
treatment (experiment group with TPR method, control group with conventional
method) to know the progress of the students‘ ability and students‘ equality
between the groups and to make sure that the ability of the two groups was
significant difference.
Like the data on pretest, the data on posttest was also measured by
independent t-test, also called a between-subjects t-test to determine if the mean
value on a given target variable for one group differs from the mean value on the
target variable for a different group (DeCoster, 2004). Besides, the data gained
from the posttest given to both experiment and control groups were measured by
matched t-test to determine whether the difference between the two mean (pretest
and posttest) scores of each group was significant.
The procedure for matched t-test according to Hatch & Farhady (1982) is
similar to the t-test for independent samples. They (1982: 115) state that ―the
difference is more conceptual rather than computational.‖ To make it clear they
obtained from two independent groups of students, while for matched t-test we
compare two means from the same students.
To measure the data using matched t-test, they also imply that we need to
state null hypothesis (H0, the difference between the pre-test and post-test means
is not significant) and alternative hypothesis (Ha, the difference between the
pre-test and post-pre-test means is significant) and set our significance level at .05.
Next, they (ibid., p. 117) mention that we can find the t value with the
following formula:
x1 – x2 t = __________
sD
x1 = score mean of pre-test
x2 = score mean of post-test
sD = standard error of differences between the means.
At this point, in their opinion, we need the critical value for t to be
compared with the t value and if the t value is above t critical, the two groups are
significant difference, there is significant difference between the pretest and
posttest means. Besides, the data gained from pretest and posttest can be measured
by matched t-test using SPSS statistical analysis package with the steps as
follows:
Step 1 : A statement of statistical hypothesis
Ho : μ1 = μ2 or means for pretest and posttest are equal
Ha: μ1 ≠ μ 2 (μ1 >μ 2 or μ1 < μ 2)
Type I error). The level of Type I error is .05.
Step 3 : Test statistic using SPSS
Step 4 : interpreting results.
(Hayes, 2000)
3.5.4. Determination of the Effect Size
Determining the effect size is important to know if the statistical test was
significant (Creswell, 2008). “Whereas statistical tests of significance tell us the
likelihood that experimental results differ from chance expectations, effect-size
measurements tell us the relative magnitude of the experimental treatment.‖ (Thalheimer, & Cook, 2002: 2)
In other words, the effect size is a measure of the magnitude of the strength of a
relationship between an independent (intervention) and dependent (outcome)
variable (Dunst, Hamby, & Trivette, 2004; Marczyk, DeMatteo, & Festinger,
2005; Fraenkel & Wallen, 1996), or as ―a means for identifying the practical
strength of the conclusion about the relationship among variables in a quantitative
study‖ (Creswell 2008: 195). Therefore, according to Thalheimer & Cook (2002),
effect sizes are especially important because they allow us to compare the
magnitude of experimental treatments from one experiment to another.
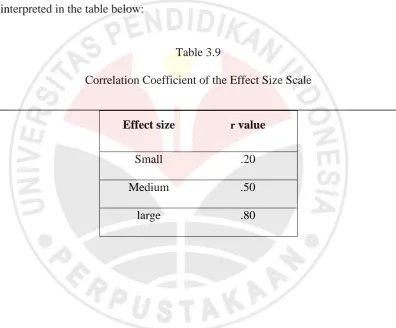
The formula to determine the effect size, as quoted from Rosenthal (1991:
19), is as follows:
r = __________
t2 _______
r = correlation coefficient of the effect size
t = t value
df = degrees of freedom
with the scale from Cohen‘s (1992, as cited in Thalheimer, & Cook, 2002) is
interpreted in the table below:
Table 3.9
Correlation Coefficient of the Effect Size Scale
Effect size r value
Small .20
Medium .50
large .80
3.5.5. Analyzing Data from Observation
The data obtained by the instrument of observation are qualitative data.
Therefore, they are analyzed by using basic concepts of analyzing qualitative data.
The data are transcribed, classified and interpreted.
After the pretest had been administered to experiment and control groups
and there was no difference of mean statistically between two groups based on
t-test calculation, treatment was given to both groups.
In conducting the treatment, the researcher did not do it by herself. There
were two teachers who gave the treatment. They taught the same English
vocabulary materials (single word vocabulary items) about numbers (1 up to 10),
colors (red, yellow, green, blue, brown, black, purple, orange, pink and white),
things in the classroom (chair, table, window, door, whiteboard, eraser, clock,
broom, lamp and dustbin), animals (bird, cat, dog, monkey, rabbit, cow, fish,
snake and horse), and fruits (apple, orange, grape, strawberry, tomato, avocado,
banana, melon and watermelon) for eight meetings but the first teacher
implemented Total Physical Response method as treatment to experiment group
by introducing some language instructions (stand up, follow me, jump, sit down,
draw, touch, point to, take, walk to, act like, imitate the sound of, and show us)
(the syllabus and lesson plan for this group are enclosed in the appendices).
Meanwhile, the other teacher treated conventional method to control group.
3.7.Research Procedures
In conducting this research, the procedure was divided into two phases as
follows:
1. Planning the research
- Identifying a research problem
- Planning an experimental research (conducting observation to school and
asking permission, making lesson plan, preparing material to be taught and
test instrument)
- Conducting pilot test
2. Conducting the research
- Conducting the experiment
. pretest to both groups (April 4, 2012)
. treatment with TPR method to experiment group (April 16 – May 28, 2012) . treatment with conventional method to control group (April 12 – May 31,
2012)
. observation to experiment group (April 16 – May 28, 2012) . posttest to both groups (June 2, 2012)
- Analyzing the data and making conclusion