Yuniarti, 2015
TEACHING ORAL COMMUNICATION STRATEGIES IN EFL SPEAKING CLASSES Indonesia | repository.upi.edu| perpustakaan.upi.edu
48
This chapter elaborates aspects related to the methods of the study. It contains the
description of research purposes and research questions, research design, research
site, population and sample, research instruments, variable and hypothesis,
research procedures, data collection techniques and data analysis. Afterward, the
explanations will be concluded in the concluding remark.
3.1 Research Design
Since this study seek to find out the effect of teaching OCSs on
undergraduate students’ speaking skill, it employed quasi-experimental method.
Quasi-experimental designs are similar to the experimental/ control group
approach except that they make comparisons between the mean performances of
groups that occur normally, or the sample naturally belong to one group or the
other (Brown, 1988; Hatch & Farhady, 1982) without random sampling (Hatch &
Lazaraton, 1991). In this kind of method, one group is given an experimental
treatment while the other did not (Hatch & Farhady, 1982, p. 22). In this study,
the treatment was the teaching of achievement or compensatory strategies of
OCSs in the speaking class. The strategies classified as achievement or
compensatory strategies are help-seeking, modified interaction, modified output,
time-gaining, maintenance and self-solving strategies, etc. Then,
quasi-experimental design was used to test the null-hypothesis (H0); there was no
difference in speaking ability between the experimental and control group and
both groups are from the same populations.
3.1.1 Variable and Hypothesis
Every standard research has at least one dependent and one independent
variable. According to Hatch and Farhady (1982), dependent variable is the
Yuniarti, 2015
TEACHING ORAL COMMUNICATION STRATEGIES IN EFL SPEAKING CLASSES Indonesia | repository.upi.edu| perpustakaan.upi.edu
independent variable. In this study, it was speaking ability. Then, independent
variable is the variable which is selected, manipulated, and measured by the
researcher. In this study, it was OCSs. This study itself aimed to reject the H0
where there was no difference in speaking ability between experimental and
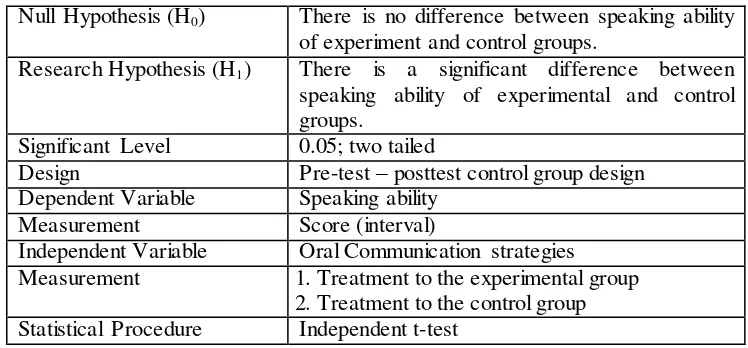
control group after the treatment. The detail characteristics of this study are shown
in the following table.
Table 3.1 The characteristics of the study
Null Hypothesis (H0) There is no difference between speaking ability
of experiment and control groups.
Research Hypothesis (H1) There is a significant difference between
speaking ability of experimental and control groups.
Significant Level 0.05; two tailed
Design Pre-test – posttest control group design Dependent Variable Speaking ability
Measurement Score (interval)
Independent Variable Oral Communication strategies Measurement 1.Treatment to the experimental group
2.Treatment to the control group Statistical Procedure Independent t-test
3.2 Research Site
This study was conducted in a private university in Kuningan, West Java,
Indonesia. It is one of two universities in Kuningan that has English Education
Program. There are three classes in each year, except for 2013, 2014 academic
year which have only two classes. The data was taken in this site because the
researcher works there, so the access was easier. As what Alwasilah (2009) said
that convenience factor should be taken into consideration to support the
researcher to carry out the research.
3.3 Population and Sample
Population can be defined as a group to whom the results of the study are
generalized (Fraenkel & Wallen, 2007). The population was English Department
Yuniarti, 2015
TEACHING ORAL COMMUNICATION STRATEGIES IN EFL SPEAKING CLASSES Indonesia | repository.upi.edu| perpustakaan.upi.edu
sampling because this kind of sampling method helped the researcher to gain
expected result. Fraenkel and Wallen (2007) stated that:
On occasion, based on previous knowledge of a population and the specific purpose of the research, investigators use personal judgment to select a sample. Researchers assume they can use their knowledge of the population to judge whether or not a particular sample will be representative. (Fraenkel and Wallen, 2007, p. 100)
The data was taken in the first year students’ speaking class. Actually, first
year students were only distributed into two classes and it was taken as the sample
of this research. Before taking this speaking class, the students had completed 6
years of English study in their junior and senior high school. However, they were
still considered as low proficiency learners. Each class consisted of 25 and 28
students, so the sample was 53 students in total. It was in line with what have been
recommended by Fraenkel, Wallen and Hyun (2012) that, in quasi-experimental
study, a minimum number of samples is 30 individuals per group, although
sometimes experimental studies with only 15 individuals in each group can be
defended if they are very tightly controlled.
3.4 Research Instruments
To collect the data, the first thing to do was developing the instruments.
Fraenkel and Wallen (2007) define instrumentation as the whole process of
preparing to collect data in research. Therefore, the instruments that were used to
collect the data for this research were speaking tests, learners’ strategy diary and
questionnaires.
Pilot test was conducted to test the validity and reliability of the speaking
tests. The questionnaires were also have been validated by consulting to the expert
to have logical validity. They can be stated to be valid if they are understandable
by many other people (Newman, 2003). For the detail explanations of the
instruments, it will be elaborated in the following sections.
Yuniarti, 2015
TEACHING ORAL COMMUNICATION STRATEGIES IN EFL SPEAKING CLASSES Indonesia | repository.upi.edu| perpustakaan.upi.edu
The speaking tests were pre-test and posttest in the experimental and
control group. They were in the form of spoken test and were video-recorded. The
scores of pre-test and posttest from both groups were used to find out the effect of
teaching OCSs in the EFL speaking class. They were calculated using t-test in
SPSS 18. Then, the recordings from the experimental group were transcribed. The
transcriptions were analyzed using OCSs proposed by Nakatani (2005) as the
framework to answer the first research question.
3.4.2 Learners’ Strategy Diary
Learners’ strategy diary was a note that the students should make to record their plans, monitor, and evaluate their performance. The diary was used for
self-reflective training by the students. So, in every rehearsal, they wrote down their
plan in using specific OCSs. When the students performed the task, they
monitored their own performance according to the guideline that was given by the
teacher (see Appendix D). This process was intended to encourage the students to
intentionally use OCSs in their speaking practices. In the evaluation stage, the
students checked and reflected their learning experiences to develop their
awareness of using OCSs in the communication. This procedure was done in
every session of the treatment, and it was only done by the experimental class
students.
3.4.3 Questionnaires
Questionnaire was essential to obtain data about students’ attitudes toward
the implementation of the technique and to answer the third research question.
The questionnaire covered three aspects: students’ experience of using OCSs in
their speaking practices/tests, students’ perspective on the usefulness of OCSs and
the effect of teaching OCSs to the improvement of their speaking skill. The
questionnaire itself was adapted from a study on the same field by Khan (2010).
The experimental group students were given the questionnaires twice, after the
Yuniarti, 2015
TEACHING ORAL COMMUNICATION STRATEGIES IN EFL SPEAKING CLASSES Indonesia | repository.upi.edu| perpustakaan.upi.edu
misunderstanding when filling it. After the pre-test, the questionnaire was about
strategies that the students used when doing the pre-test (See Appendix A). The
questionnaire consisted of 37 items with the following specification.
Table 3.2 The distribution of pilot questionnaire
No. Indicators Item
questionnaires. The first questionnaire was about students’ experience of using
OCSs, students’ perspective on the usefulness of OCSs and the effect of teaching
OCSs to the improvement of their speaking skill (see Appendix F). The
questionnaires consisted of 11 close-ended questions which use likert scale with
the options of strongly agree, agree, uncertain, disagree, and strongly disagree.
Likert scale, as part of attitude scale, allows the researcher to measure a subject’s
attitude toward a particular concept (Fraenkel, Wallen & Hyun, 2012).
The second questionnaire evaluated the strategies that the students used in
the posttest. It was consisted of 44 items with the following specification (see
Appendix E for detail).
Table 3.3 The distribution of the OCSs use questionnaire
No. Indicators Item
4. What they do when they don’t understand their partner.
19 – 25 7
5. How the students overcome problems with language while speaking.
Yuniarti, 2015
TEACHING ORAL COMMUNICATION STRATEGIES IN EFL SPEAKING CLASSES Indonesia | repository.upi.edu| perpustakaan.upi.edu
6. Reviewing speaking activity. 41 – 44 4
3.5 Research Procedure
In the effort of making the research run smoothly, a simple procedure was
made. Firstly, the speaking test instrument was tried out to test the validity and
reliability of the test items. Secondly, pre-test was conducted for experimental and
control group and the results were collected and analyzed as the preliminary data
about the students’ initial speaking skill. After pre-test, the experimental group
students were asked to fill the pre-test questionnaires.
Thirdly, the experimental and control group were given treatment,
different treatment. In general, teaching procedures for experimental and control
group were carried out in the same order started from pre-activities,
whilst-activities, and post-activities. The lesson was opened by a teacher’s presentation
of the material and was ended with an individual speaking task for each student.
The difference between experimental and control group lied on the way the
teacher conveyed OCSs materials. In the experimental group, the teacher
explicitly introduced and explained the use of OCSs along with some speaking
tasks related to the OCSs taught in that session. The process was like: review,
presentation, rehearsal, performance, and evaluation. Whereas, in the control
group, the teacher implicitly conveyed communication strategies, in other word,
used conventional technique. However, the speaking tasks were the same as in the
experimental group.
Then, after the treatment, posttest was conducted for both experimental
and control group to get the final output of the treatment. The final stage was
gathering data from questionnaires from the experimental group to assess how
they used the OCSs in their posttest and to get the students’ attitudes toward the
teaching of OCSs. In this session also, the students were asked to collect their
Yuniarti, 2015
TEACHING ORAL COMMUNICATION STRATEGIES IN EFL SPEAKING CLASSES Indonesia | repository.upi.edu| perpustakaan.upi.edu
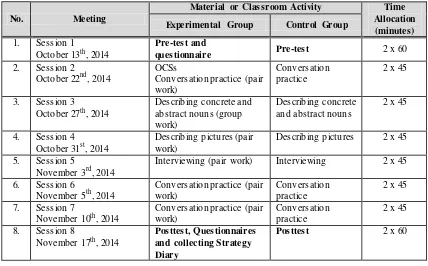
Table 3.4 The description of research procedure
No. Meeting
Material or Classroom Activity Time
Allocation
Interviewing (pair work) Interviewing 2 x 45
Yuniarti, 2015
TEACHING ORAL COMMUNICATION STRATEGIES IN EFL SPEAKING CLASSES Indonesia | repository.upi.edu| perpustakaan.upi.edu
(1979, as cited in Hughes, 2003). Then, the pre-test and posttest recording of
experimental class were transcribed, categorized, calculated and analyzed based
on the list of OCSs proposed by Nakatani (2005) to answer the first research
question (see Appendix G and H).
3.6.2 Score Data Analysis of the Test
This study aimed to find out the effect of teaching oral communication
strategies in EFL speaking class. Therefore, the quantitative analysis was used to
see whether the teaching of OCSs was effective to improve students’ speaking
ability. There were two tests (pre-test and posttest) that were applied during the
research. Since this research applied quasi-experimental design, the first step was
finding out the normality of data distribution in both of classes. The result of
pre-test and postpre-test were used to seek the normality of participants’ speaking scores.
The calculation were made using SPSS 18. With the hypothesis are as follows.
H0 : The distribution of pre-test/posttest score in the experimental
and control group are normally distributed.
H1 : The distribution of pre-test/posttest score in the experimental
and control group are not normally distributed.
There were some criteria to determine whether the result was accepting or
rejecting H0. According to Hatch and Farhady (1982), the level significance
criteria to determine normality distribution test are as follows.
If the probability > 0.05, H0 is accepted
If the probability < 0.05, H0 is rejected
The second step was seeking the homogeneity of data distribution in both
of classes. It was done by calculating the result of pretest and posttest from both
groups using Ftest. The test was conducted to reject H0 where Fcount > Ftable meant
Yuniarti, 2015
TEACHING ORAL COMMUNICATION STRATEGIES IN EFL SPEAKING CLASSES Indonesia | repository.upi.edu| perpustakaan.upi.edu
meant both element were homogenous. According to Hatch & Farhady (1982), the
variance formula is as follows:
Variance formula: Ftest= ∑( ̅)
Fcount =
Explanation:
x : Students’ score ̅ : Students’ score mean N : Total of students
Afterward, the results of posttest were compared to find out the significant
differences between two groups after the treatment (Hatch & Farhady, 1982;
Brown, 1988; Hatch & Lazaraton, 1994; Dӧrnyei, 2007). Then, the pre-test and
posttest score from both experimental and control group were analyzed using t
-test to seek the significance of the program by -testing the H0 that has been
determined before, since the t-test is aimed to compare two means of different
group (Hatch & Farhady, 1982; Hatch & Lazaraton, 1994; Dӧrnyei, 2007). The
pre-test and posttest score were calculated using SPSS 18.0 computer program.
The statistical analysis was used to compare the speaking performance of both
experimental and control groups and to find out whether the means of the two
groups were really different. It was intended to find out whether there was an
effect of teaching OCSs to the students’ speaking skill.
Then, the hypothesis was tested to see whether H0 was accepted or
rejected. Hatch and Farhady (1992) claimed that the H1 will be accepted if:
a. The mean of posttest score is higher than that of pre-test score of the two
classes.
b. The mean of pre-test score of the experimental class is not different from
that the control class.
c. The mean of posttest score of the experimental class is higher than that of
the control class.
There were also some considerations should be fulfilled to test the H0. The
H0 will be received if:
a. There is no significant difference between mean of the posttest score and
Yuniarti, 2015
TEACHING ORAL COMMUNICATION STRATEGIES IN EFL SPEAKING CLASSES Indonesia | repository.upi.edu| perpustakaan.upi.edu
b. There is no significant difference between mean of pre-test score of the
two classes.
c. There is no significant difference between mean of posttest score of the
two classes.
3.6.3 Questionnaire and Strategy Diary
After the questionnaires data were collected, the close-ended questions
results were calculated and analyzed by converting it into percentage using the
frequency base with the formula as follows.
The open-ended questions data were analyzed qualitatively. It was
summarized and categorized based on the classification.
After that, the students’ notes and responses in their strategy diaries were
categorized then analyzed using coding and categorizing. The analysis was
looking throughout the data, clustering or grouping similar idea and labeling
them. Afterwards, the data were compared with the result of questionnaires and presented in the discussion to explore students’ attitudes toward the teaching of OCSs in speaking class.
3.7 Concluding Remarks
The steps and procedures of data collection and analysis have been
elaborated specifically in this chapter. This present study involved 53 first year
students from the Department of English Education in a private university in
Kuningan. They were grouped into experimental and control group. Then, OCSs
proposed by Nakatani (2005) were given to the experimental group in the
treatment. The OCSs were also used as the framework to analyze the transcription
of pre-test and posttest recording. Questionnaires were distributed to the students
and strategy diary was also used to find out their strategy used and perspective
toward the teaching of OCSs in EFL speaking class. Furthermore, the findings and