Comparison of various lipid, lipoprotein, and bilirubin
combinations as risk factors for predicting coronary artery
disease
Harvey A. Schwertner *, Joseph R. Fischer Jr.
59MDW/MSRL,Clinical Research Squadron,Wilford Hall Medical Center,1255Wilford Hall Loop,Lackland AFB,TX78236-5319,USA Received 15 December 1998; received in revised form 23 July 1999; accepted 3 September 1999
Abstract
Studies were performed to determine if serum bilirubin, when combined with various lipid and lipoprotein risk factors, enhances our ability to predict coronary artery disease (CAD). This hypothesis was tested in a retrospective study of 644 middle-aged males who had undergone coronary angiography. The traditional risk factors of cholesterol, high density lipoprotein cholesterol (HDL-C), cholesterol/HDL-C ratios, triglycerides, age, cigarette smoking, and systolic blood pressure were tested by discriminant analysis, as were various cholesterol/bilirubin, cholesterol/(HDL-C+bilirubin), and low-density lipoprotein cholesterol (LDL-C)/ (HDL-C+bilirubin) ratios. Each of these bilirubin-containing ratios was found to be an independent risk predictor when tested with the traditional risk factors. When the LDL-C/(HDL-C+bilirubin) ratio was included with the traditional risk predictors, it improved the prediction of severe CAD from 28.4 to 35.3% and the overall correct classification of CAD from 68.3 to 71.1%. When the 75th percentile was used as a cut-point, the diagnostic sensitivities obtained with cholesterol/(HDL-C+bilirubin) ratios (52.1%) and LDL-C/(HDL-C+bilirubin) ratios (51.7%) were better than those obtained with cholesterol/HDL-C ratios (40.4%) (P=0.033 and 0.048, respectively). LDL-C/(HDL-C+bilirubin) ratios also improved the prediction of severe CAD over those obtained with LDL-C/HDL-C ratios (43.4%); however, the changes were not statistically significant (P=0.096). If confirmed in other populations, serum bilirubin may be combined with LDL-C/HDL-C ratios, cholesterol/HDL-C ratios, cholesterol, or with various apolipoproteins to improve the prediction of CAD. © 2000 Elsevier Science Ireland Ltd. All rights reserved.
Keywords:Bilirubin; Cholesterol; HDL-cholesterol; Coronary artery disease; Risk factors; Antioxidants; Prediction
www.elsevier.com/locate/atherosclerosis
1. Introduction
Low serum bilirubin concentrations have been shown to be independently and inversely associated with an increased risk for CAD [1]. The strength of the associa-tion between bilirubin and CAD appears to be similar to that of high-density lipoprotein cholesterol (HDL-C), smoking, systolic blood pressure, and CAD. The process by which bilirubin exerts its effect is not known, however, the endogenous antioxidant property of serum bilirubin has been proposed as a possible
mecha-nism [1]. The findings have been recently confirmed in a prospective study of middle-aged British men with is-chemic heart disease [2] and in a number of case-con-trol studies involving individuals with coronary artery disease [3 – 5]. While these studies have provided impor-tant information on serum bilirubin as an independent risk factor for CAD, studies involving an assessment of the accuracy of CAD classification with serum bilirubin have not been performed.
Cholesterol, HDL-C, and the cholesterol/HDL-C ra-tio are often considered to be the major risk factors for coronary artery disease [6 – 9]. Of these risk factors, the cholesterol/HDL-C ratio has been shown to be the most effective discriminator of coronary heart disease [6,8]. The clinical utility of these risk factors is well established for monitoring purposes and for assessing the risk of cardiovascular disease. Since the diagnostic
The views expressed in this article are those of the authors and do not reflect the official policy of the Department of Defense or other Departments of the US Government.
* Corresponding author. Tel.:+1-210-292-7268; fax:+ 1-210-292-6053.
E-mail address:[email protected] (H.A. Schwertner)
accuracy of serum bilirubin has not been determined, we sought to perform such studies. We specifically sought to determine if the ratio of either total choles-terol/(HDL-C plus bilirubin) or low-density lipoprotein cholesterol (LDL-C)/(HDL-C plus bilirubin) is better able to discriminate CAD than either ratio without serum bilirubin. Because both bilirubin and HDL-C have been shown to be inversely related to CAD, we combined them together in the denominator after ad-justing the weight of bilirubin. Such combinations of risk factors permit the use of single values for establish-ing risk thresholds and for comparestablish-ing the diagnostic efficiencies at various percentile levels.
The purpose of this cross-sectional study was to assess various serum lipid, lipoprotein, and bilirubin combinations for predicting coronary artery disease in middle-aged men and to compare them to the estab-lished lipid and lipoprotein risk factors. For this study, we first compared the existing and candidate laboratory risk factors by themselves to determine which might be most useful for monitoring and screening purposes independent of age, systolic blood pressure, and smok-ing. We then sought to determine if the various lipid, lipoprotein, and bilirubin ratios might improve our ability to predict CAD when combined with the estab-lished risk factors of age, systolic blood pressure, cigarette smoking, total cholesterol, HDL-C, choles-terol/HDL-C ratios, and triglycerides. A summary of CAD classification results is presented for all of the models studied. In addition, we determined the sensitiv-ities, specificsensitiv-ities, and efficiency of a test using the 75th percentile value as a cut-point for the various lipid, lipoprotein, and bilirubin combinations.
2. Materials and methods
2.1. Subjects
Subjects were 877 asymptomatic, male, United States Air Force flightcrew members, who had abnormal exer-cise tests and who underwent coronary angiography to rule out the presence of CAD. Information on labora-tory risk factors were available for all of these subjects, however, complete laboratory and clinical data were available for at least 644 subjects, depending on the risk factor being considered. Most subjects were initially identified by subtle serial changes on their routine resting 12-lead electrocardiogram (ECG) obtained dur-ing their biennial flight physical. Individuals with serial changes, such as nonspecific ST-T wave changes, under-went a local symptom-limited treadmill test. Those individuals with repolarization or rhythm abnormalities on local stress testing were referred to the USAF Aeromedical Consultation Service at Brooks AFB Texas.
The cohort used for this study contained 25 addi-tional subjects than the cohort in the earlier study [1]. The subjects were relatively young, physically fit, and few were overweight. None of the subjects had liver disease. Information on medications and vitamin intake was not recorded. The frequency of cigarette smoking was taken from the patients’ medical records. The data are from individuals who underwent coronary angiog-raphy and laboratory testing between August 1, 1978 and May 8, 1990.
2.2. Exercise test procedures and coronary angiography
All individuals underwent a cardiovascular screen, which included an ECG at rest, at least 16 h of ambula-tory ECG monitoring, a symptom-limited treadmill test, cardiac fluoroscopy (beginning October 1982), and a thorough history, physical examination, and extensive blood tests. The symptom-limited treadmill tests were performed after an overnight fast. The treadmill tests were abnormal if a ST segment depression of 1.0 mm or more occurred 80 ms after the j point. Elective coro-nary arteriography was performed for abnormal repo-larization, decreased thallium uptake, cardiac calcification demonstrated by fluoroscopy, tachycardia, acquired left branch block, or valvular abnormalities. Each angiogram was read jointly by at least two cardi-ologists. Coronary artery lesions were magnified, traced, and measured with calipers to determine the percentage of diameter narrowing of the artery.
2.3. Laboratory tests
All blood samples were collected after a 12-h fast and prior to other testing. HDL-C was analyzed after pre-cipitation of the apo-B lipoproteins with either phos-photungstate-magnesium reagents or dextran sulfate, Mr, 50 000. Total and HDL-C were determined enzy-matically with BMC Autoflo reagents (Boehringer Mannheim Diagnostics, Indianapolis, IN) or with Ciba Corning enzymatic reagents. LDL-C was calculated by the following formula [10]: LDL-C= cholesterol-HDL-C-(triglycerides/5). Total bilirubin was analyzed with diazotized sulfanilic acid reagent with blank correction (Malloy and Evelyn method; Abbott Laboratories and Ciba Corning).
2.4. Statistical methods
One-way ANOVA and stepwise discriminant analy-ses were calculated using SPSS statistical software. Mc-Nemar’s test (two-tail) was used to determine if bilirubin increases the diagnostic sensitivity of the vari-ous lipid and lipoprotein ratios. Coronary artery dis-ease was divided into three groupings according to the maximum coronary stenosis at angiography: 0 – 9% (no detectable disease), 10 – 49% (mild disease), and 50 – 100% (severe disease). All of the independent variables were treated as continuous variables. Cigarette smoking was measured as the reported average number of cigarettes smoked per day, provided the subject had not quit smoking at least 1 year prior to testing. In all of the total cholesterol or LDL-C/(HDL-C plus bilirubin) ratios, the bilirubin concentration was multiplied by 100 and then added to the HDL-C value before com-puting the ratios. There was no biological rationale for the weightings of bilirubin. This adjustment was neces-sary so that bilirubin values would be similar in magni-tude to those of HDL-C. All ratios, except for the cholesterol/bilirubin ratios, were expressed in mg/dl.
3. Results
3.1. Patient groups and summary statistics
Summary statistics are given for groups without CAD, with minimal CAD, and with severe CAD in
Table 1. In this group of 644, 430 (66.8%) were free of CAD, 98 (15.2%) had mild CAD, and 116 (18.0%) had severe CAD. All of the clinical and laboratory risk factors were significantly related to severity of CAD. Inverse associations were found for serum total biliru-bin and HDL-C. Summary statistics are not given for the group with 877 individuals. In this group, 597 (68.1%) were free of CAD, 134 (15.3%) had mild dis-ease, and 146 (16.6%) had severe disease.
3.2. Discriminant analysis models
When the traditional risk factors, age, systolic blood pressure, cigarettes per day, total cholesterol, HDL-C, cholesterol/HDL-C ratios, and triglycerides, were ana-lyzed by discriminant analysis, age, total cholesterol, cigarettes per day, and systolic blood pressure were found to be independent risk factors. Cholesterol/ HDL-C ratio, HDL-HDL-C, and triglycerides did not enter the model once the other four variables were selected. When the traditional risk factors and the various lipid-lipoprotein and lipid-lipid-lipoprotein-bilirubin combinations were analyzed by discriminant analysis, age, LDL-C/ (HDL-C+bilirubin) ratio, and systolic blood pressure were selected for inclusion into the model (Tables 2a,b). Summaries of the accuracy of CAD classification for the various risk factors and risk factor combinations analyzed by discriminant analysis either alone or with the traditional risk factors are presented in Table 3. When tested individually, the risk factors containing bilirubin were found to be more accurate in classifying
Table 1
Clinical and laboratory characteristics of 644 study subjects by degree of CAD
Maximum stenosis
CAD risk factorsa 0–9% (n=430) 10–49% (n=98) 50–100% (n=116) P-value 0.000 45.3 (5.4)
Age, years 39.9 (6.3) 45.3 (5.9)
0.000
Systolic blood pressure, mmHg 131.0 (13.3) 0.001
Total bilirubin,mmol/l 14.8 (7.1) 13.1 (4.7) 12.5 (5.8) 0.001
6.16 (1.15) 5.32 (0.99)
Total cholesterol, mmol/l 5.91 (0.93) 0.000
0.002 HDL-cholesterol, mmol/l 1.21 (0.31) 1.14 (0.26) 1.11 (0.24)
1.56 (1.11) 1.87 (0.88) 0.009
Triglyceridesb, mmol/l 1.76 (0.92)
0.000
Cholesterol/HDL-Cc 4.71 (1.62) 5.42 (1.47) 5.81 (1.59)
(Cholesterol/bilirubin) (}100)d 4.26 (1.91) 5.11 (1.95) 5.85 (2.56) 0.000 2.21 (0.66)
2.01 (0.57) 0.000
1.69 (0.59) Cholesterol/(HDL-C+bilirubin)c
3.64 (1.16) 3.97 (1.33) 0.000
LDL-C/HDL-Cc 3.01 (1.11)
1.51 (0.53) 1.35 (0.43)
1.08 (0.42)
LDL-C/(HDL-C+bilirubin)c 0.000
aValues are given as mean9SD. To convert values for cholesterol, triglycerides, and bilirubin to mg/dl, multiply by 38.66, 88.54, and 0.05847. Analysis of variance. AllF-values were significant atP=0.009.
bTriglyceride concentrations are expressed as mmol/l triolein.
cCholesterol/HDL-C, LDL-C/HDL-C, cholesterol/(HDL-C+bilirubin), and LDL-C/(HDL-C+bilirubin) ratios are presented on a mg/dl basis. Bilirubin concentrations were multiplied by 100 before combining with HDL-C. For example, the cholesterol/(HDL-C+bilirubin) ratio was calculated by taking each individual’s cholesterol concentration in mg/dl and dividing it by the sum of the HDL-C concentration in mg/dl plus the bilirubin concentration in mg/dl×100.
Table 2a
Results of discriminant analysis using traditional risk factors and various lipid-lipoprotein and lipid-lipoprotein-bilirubin combinationsa
Wilks’ lambda Variables accepted in model
Age 0.848
LDL-C/(HDL-C+bilirubin) 0.839 0.769 Systolic blood pressure
Variables not included in model
0.757 Cholesterol/(HDL-C+bilirubin)
0.757
aDiscriminant analysis showing variables tested for inclusion into model.
severe CAD than either the cholesterol/HDL-C ratios or the LDL-C/HDL-C ratios. The correct classification of severe CAD (diagnostic sensitivity) and the overall correct classification tended to increase in the following order: cholesterol/HDL-C ratio, LDL-C/HDL-C ratio, cholesterol/bilirubin ratio, cholesterol/(HDL-C+ biliru-bin) ratio, LDL-C/(HDL-C+bilirubin) ratio. We also multiplied HDL-C×bilirubin in the denominator, however, the correct classification was much less than that achieved by adding HDL-C and bilirubin.
When the risk factors containing bilirubin and the traditional risk factors were used to predict CAD, the model containing age, LDL-C/(HDL-C+bilirubin) ra-tios, and systolic blood pressure produced the highest diagnostic sensitivity and the highest percentage of correct results (Tables 2a,b and 3). Compared to the model containing only the traditional risk factors, the model containing LDL-C/(HDL-C+bilirubin) im-proved the diagnostic sensitivity for predicting severe CAD from 28.4 to 35.3% and improved the overall correct classification of CAD from 68.3 to 71.1%. The increase in sensitivity was not found to be statistically significant (P=0.15). If the LDL-C/(HDL-C+ biliru-bin) ratios were omitted from consideration, the choles-terol/(HDL-C+bilirubin) ratios entered the model and produced classification results much like that of LDL-C/(HDL-C+bilirubin) ratios (Table 3).
Discriminant analysis was performed using age and age with cholesterol as variables (Table 3). The overall correct classification improved only 0.9% when choles-terol was included with age. The diagnostic sensitivity, however, increased 10.5%.
Table 2b
Coronary artery disease classification results
Predicted group membership
Actual group No. cases 0–9% 10–49% 50–100%
457 430 24
Percent correct classification for each risk factor combination for predicting coronary artery diseasea
Overall correct % 0–9% specificity %
Risk factor variable 10–49% 50–100% sensitivity %
97.2 0 13.8 67.4
Age
95.1 4.1
Age, cholesterol 23.3 68.3
97.0
Cholesterol/HDL-C 0 6.8 67.2
97.5 0
LDL-C/HDL-C 6.9 67.6
Cholesterol/bilirubin 96.8 0 14.4 68.3
68.3 17.1
Cholesterol/(HDL-C+bilirubin) 96.1 0
96.0 0
LDL-C/(HDL-C+bilirubin) 17.9 68.4
Laboratory risk factorsb 95.1 0 19.2 68.0
28.4
92.8 8.2
Traditional risk factorsc 68.3
8.2
92.1 35.3
Traditional and cholesterol/(HDL-C+bilirubin)d 69.1
94.1 6.1 35.3 71.1
Traditional and LDL-C/(HDL-C+bilirubin)e
a95% confidence intervals for sensitivity, specificity, and overall correct are approximately 98, 92, and 93%, respectively. bLaboratory risk factors that entered the discriminant model were LDL/(HDL+bilirubin) and cholesterol.
cTraditional risk factors examined included cholesterol, cigarettes/day, systolic blood pressure, triglycerides, cholesterol/HDL-C, and HDL-C. Age, cholesterol, systolic blood pressure, and cigarettes/day entered the discriminant model.
Table 4
Diagnostic performance of various risk factors for predicting severe coronary artery disease using 75th percentile as a cut-point
Risk factor variablea,c Sensitivity (%) Specificity (%) Efficiency of test (%)b
(573/731) 78.4
Cholesterol/HDL-C (59/146) 40.4 (632/877) 72.1
(63/145) 43.4
LDL-C/HDL-C (577/731) 78.9 (640/877) 73.0
(584/730) 79.9
(71/146) 48.6 (655/877) 74.7
Cholesterol/bilirubin
(76/146) 52.1
Cholesterol/(HDL-C+bilirubin) (588/731) 80.4 (664/877) 75.7 (75/145) 51.7
LDL-C/(HDL-C+bilirubin) (587/731) 80.3 (662/877) 75.5
aNumbers in parentheses represent the actual subject counts. Cut-points (75th percentile) for the cholesterol/HDL-C ratio, LDL-C/HDL-C ratio, cholesterol/bilirubin ratio, cholesterol/(HDL-C+bilirubin) ratio, and LDL-C/(HDL-C+bilirubin) ratio were 6.04, 4.12, 3.84, 2.25, and 1.5, respectively.
bEfficiency of test was calculated as follows: TP+TN/(TP+TN+FP+FN).
c95% confidence intervals for sensitivity, specificity, and efficiency of a test are approximately 98, 94, and 93%, respectively.
3.3. Classification of CAD using quartiles of the indi6idual risk ratios
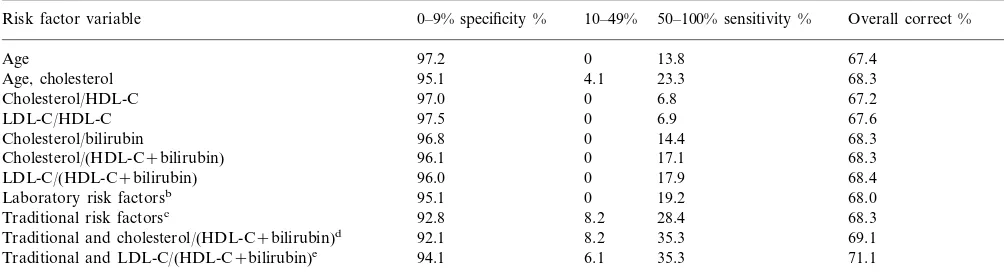
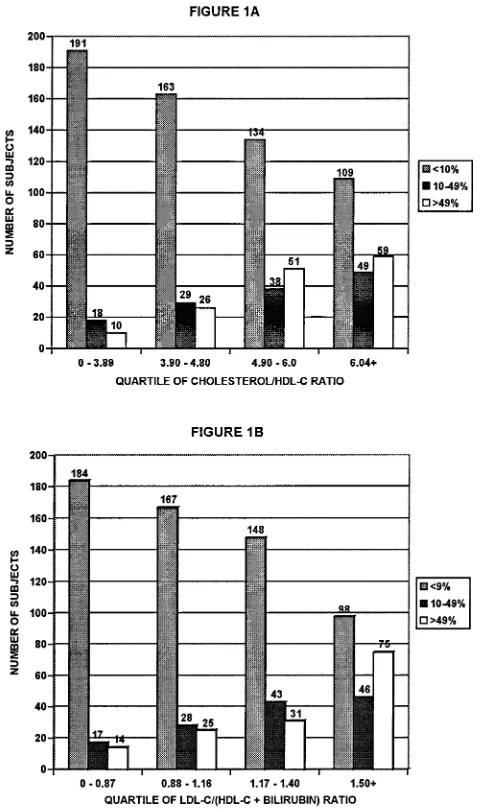
In this approach, the 75th percentile of each risk factor was used as the cut-point to screen for severe CAD. Summaries of diagnostic sensitivities, specific-ities, and the efficiency of a test for predicting severe CAD are presented in Table 4. The accuracy of choles-terol/(HDL-C+bilirubin) for predicting severe CAD was found to be similar to that obtained with the LDL-C/(HDL-C+bilirubin) ratios. The diagnostic sen-sitivities achieved with cholesterol/(HDL-C+bilirubin) and LDL-C/(HDL-C+bilirubin) ratios were higher than those obtained with cholesterol/HDL-C ratios (P=0.033 and 0.048, respectively). The diagnostic sen-sitivities obtained with LDL-C/(HDL-C+bilirubin) were also better than those obtained with LDL-C/ HDL-C ratios, however, the results were not quite significant (P=0.096). As shown in Fig. 1A and 1B, 59 subjects in the fourth quartile were correctly classified as having severe CAD when cholesterol/HDL-C ratios were used to predict CAD compared to 75 when results were based on LDL-C/(HDL-C+bilirubin) ratios.
4. Discussion
In this study, we found that serum bilirubin increases the predictive value of the major lipid and lipoprotein risk factors. Both the LDL-C/(HDL-C+bilirubin) and the cholesterol/(HDL-C+bilirubin) ratios were found to be more accurate in identifying severe CAD than either the cholesterol/HDL-C or LDL-C/HDL-C ra-tios. This was found to be true when analyzed by discriminant analysis, or when simply classifying CAD based on quartiles of the predictor variables. In addi-tion, both discriminant analyses and seventy-fifth per-centile cut-points produced similar results in ranking the various risk factors.
Numerous studies have been reported on the associa-tion between various lipids and lipoproteins and coro-nary artery disease, however, detailed information on their diagnostic performance have been determined in only a few studies [7 – 9]. In this study, we derived new risk factor combinations containing bilirubin and we showed how well these risk factors predict CAD. Since serum bilirubin concentrations were previously shown to be inversely related to CAD [1 – 5], we placed the positive risk factors in the numerator, e.g. cholesterol and LDL-C, and the negative risk factors, e.g. HDL-C and bilirubin, in the denominator. We also multiplied the serum bilirubin values by 100 so that they would be similar in magnitude to the HDL-C values. While we do not have specific scientific rationale as to why the ratios seem to work, it is clear that the ratios amplify changes in the numerator, in the denominator, or in both numerator and denominator.
Serum bilirubin increased the overall prediction of CAD approximately 3.0% over that achieved without bilirubin. Even though this increase in predictive ability is not large in absolute terms, none of the traditional risk factors, including cholesterol, produced large in-creases in overall predictive ability. For example, when we determined the overall prediction using age as a variable and then added cholesterol, the overall predic-tion of CAD increased only 0.9%. The sensitivities, however, increased 10.5% after adding cholesterol. We believe this study accurately depicts our ability to pre-dict CAD in this population and that it shows how much further we need to go to accurately predict CAD. Even though we would have liked a 10 or 20% increase in overall correct classification, we know that such increases are difficult to achieve with the current risk factors and risk factor combinations. New risk factors and risk factor combinations will have to be identified to achieve such increases in overall predictive ability. Further increases in diagnostic accuracy of serum bilirubin can be achieved if the intra- and inter-subject variability in serum bilirubin concentrations can be decreased. The factors that contribute to serum biliru-bin variability need to be identified and controlled, if possible, as smaller standard deviations would likely further increase the predictive ability of serum bilirubin. Some of the biological variability of serum bilirubin might be lowered by standardizing the fasting condi-tions and blood collection times and by using multiple analyses to determine bilirubin concentrations [1,3,11]. Although the variability of serum bilirubin is higher than that of cholesterol, it is similar to that of homo-cysteine, vitamin C, and the lipid soluble vitamins. A smaller portion of the variability is probably analytical in nature and probably results from changes in meth-ods, instruments and manufacturers’ calibrators during the 12-year data collection period.
Although LDL-C/HDL-C+bilirubin ratios were found to be the best predictors of CAD, cholesterol/ bilirubin ratios produced results similar to those achieved with cholesterol/HDL-C ratios. In those coun-tries that do not have the resources to analyze HDL-C, bilirubin should be evaluated as a possible substitute for HDL-C. Serum bilirubin analysis is simple to per-form, reagents and equipment are available in most clinics and hospitals worldwide, and the costs per test are much lower than the costs for analyzing HDL-C. In addition, serum bilirubin appears to be easier to dardize than HDL-C and reagent and laboratory stan-dardization procedures have already been established to insure accurate quantification of serum bilirubin con-centrations. Another advantage for using serum biliru-bin is that it appears to be a reflection of the antioxidant status of an individual [1,12 – 17]. Several studies have shown that serum bilirubin is highly corre-lated with the total antioxidant activity of serum and that bilirubin accounts for 10 – 30% of the plasma an-tioxidant activity [18,19]. Also, the anan-tioxidant capacity of bilirubin has been shown to be higher than that of the lipid soluble vitamins [13 – 16].
Confirmation of these results in women, in other cohorts, and in individuals with diabetes, obesity, or other chronic diseases are needed. Even though other studies are likely to show some variation in the ranking of the various risk factors containing serum bilirubin, we believe that serum bilirubin will increase the predic-tive value of a given lipid or lipoprotein test. Since our subjects represented a highly selected group of patients undergoing coronary angiography for the evaluation of suspected coronary artery disease, the tests described in this study may not be directly transferable to the gen-eral population. The results also need to be confirmed in prospective studies. Such studies would determine the usefulness of the various lipid-lipoprotein-bilirubin ratios as a screening test for predicting the future occurrence of coronary artery disease.
References
[1] Schwertner HA, Jackson WG, Tolan G. Association of low serum concentration of bilirubin with increased risk of coronary artery disease. Clin Chem 1994;40:18 – 23.
[2] Breimer LH, Wannamethee G, Ebrahim S, Shaper AG. Serum bilirubin and risk of ischemic heart disease in middle-aged British men. Clin Chem 1995;41:1504 – 8.
[3] Hopkins PN, Wu LL, Hunt SC, James BC, Vincent GM, Williams RR. Higher serum bilirubin is associated with de-creased risk for early familial coronary artery disease. Arte-rioscler Thromb Vasc Biol 1996;16:250 – 5.
[4] Levinson SS. Relationship between bilirubin, apolipoprotein B, and coronary artery disease. Ann Clin Lab Sci 1997;27:185 – 92. [5] Madhavan M, Wattingney WA, Srinivasan SR, Berenson GS. Serum bilirubin distribution and its relation to cardiovascular risk in children and young adults. Atherosclerosis 1997;131:107 – 13.
[6] Castelli WP, Garrison RJ, Wilson PW, Abbott RD, Kalousdian S, Kannel WB. Incidence of coronary heart disease and lipo-protein cholesterol levels. The Framingham Study. JAMA 1986;256:2835 – 8.
[7] Wilson PWF, D’Agostino RB, Levy D, Belanger AM, Silber-shatz H, Kannel WB. Prediction of coronary heart disease using risk factor categories. Circulation 1998;97:1837 – 47.
[8] Kinosian B, Glick H, Garland G. Cholesterol and coronary heart disease: predicting risks by levels and ratios. Ann Intern Med 1994;121:641 – 7.
[9] Ridker PM, Glynn RJ, Hennekens CH. C-Reactive protein adds to the predictive value of total and HDL cholesterol in determin-ing risk of first myocardial infarction. Circulation 1998;97:2007 – 11.
[10] Friedewald WT, Levy RI, Fredrickson DS. Estimation of the
concentration of low-density lipoprotein cholesterol in plasma, without use of the preparative ultracentrifuge. Clin Chem 1972;18:499 – 502.
[11] White GL, Nelson JA, Pederson DM, Ash KO. Fasting and gender (and altitude?) influence reference intervals for serum bilirubin in healthy adults (letter). Clin Chem 1981;27:1140 – 2. [12] Stocker R, Yamamoto Y, McDonagh AF, Glazer AN, Ames
BN. Bilirubin is an antioxidant of possible physiological impor-tance. Science 1987;235:1043 – 6.
[13] Stocker R, Glazer AN, Ames BN. Antioxidant activity of albu-min-bound bilirubin. Proc Natl Acad Sci USA 1987;84:5918 – 22. [14] Wu T-W, Fung K-P, Yang C-C. Unconjugated bilirubin inhibits the oxidation of human low density lipoprotein better than Trolox. Life Sci 1994;54:PL477 – 81.
[15] Wu TW, Fung KP, Wu J, Yang CC, Weisel RD. Antioxidation of human low density lipoprotein by unconjugated and conju-gated bilirubins. Biochem Pharmacol 1996;51:859 – 62.
[16] Neuzil J, Stocker R. Free and albumin-bound bilirubin are efficient co-antioxidants fora-tocopherol, inhibiting plasma and low density lipoprotein lipid peroxidation. J Biol Chem 1994;269:16712 – 9.
[17] Schwertner HA. Association of smoking and low serum bilirubin antioxidant concentrations. Atherosclerosis 1998;136:383 – 7. [18] Miller NG, Rice-Evans C, Davies MJ, Gopinathan V, Milner A.
A novel method for measuring antioxidant capacity and its application to monitoring the antioxidant status in premature neonates. Clin Sci 1993;84:407 – 12.
[19] Lamont J, Campbell J, FitzGerld P. Measurement of individual versus total antioxidants. Clin Chem 1997;43:852 – 3.
[20] Hulea SA, Wasowicz E, Kummerow FA. Inhibition of metal-catalyzed oxidation of low-density lipoprotein by free and albu-min-bound bilirubin. Biochim Biophys Acta 1995;1259:29 – 38. [21] Liu K, Cuddy E, Pierce GN. Oxidative status of lipoproteins in
coronary disease patients. Am Heart J 1992;123:285 – 90.