Regulation of plasma low density lipoprotein levels in
postmenopausal women
Anna Karjalainen
a, Jorma Heikkinen
b, Markku J. Savolainen
a,
Ann-Christine Ba¨ckstro¨m
c, Y. Antero Kesa¨niemi
a,*
aDepartment of Internal Medicine and Biocenter Oulu,Uni6ersity of Oulu,Kajaanintie 50,FIN-90220 Oulu, Finland bOulu Deaconess Institute,Oulu, Finland
cOrion Corporation Orion Pharma,Espoo, Finland
Received 23 March 1999; received in revised form 23 September 1999; accepted 13 October 1999
Abstract
To study the regulation of plasma low density lipoprotein (LDL) cholesterol in postmenopausal women (n=79), fasting plasma lipids and lipoproteins, the fractional catabolic rate (FCR) and production rate for LDL apolipoprotein B (apo B), cholesterol absorption, apolipoprotein E phenotype and polymorphisms of the apo B and 7a-hydroxylase genes were determined. The level of LDL cholesterol was related to FCR (r= −0.757,PB0.001) and the production (r=0.531,PB0.001) of LDL apo B and body mass index (r=0.265, PB0.05). In contrast, cholesterol absorption efficiency, apolipoprotein E phenotype, EcoRI and XbaI polymorphisms of the apo B gene and the polymorphism of 7a-hydroxylase gene were found to have no significance for the regulation of LDL cholesterol concentration in these postmenopausal women. © 2000 Elsevier Science Ireland Ltd. All rights reserved.
Keywords:Lipoproteins; Apolipoprotein B; Cholesterol absorption; Menopause
www.elsevier.com/locate/atherosclerosis
1. Introduction
Cardiovascular diseases are less common in fertile women than in men of the same age. After the menopause, however, the difference between men and women gradually levels off in about 10 years [1], and cardiovascular diseases also become a leading cause of morbidity and mortality in women.
Hypercholesterolemia, especially a high concentra-tion of plasma low density lipoprotein (LDL) choles-terol, is a well-known risk factor for atherosclerosis [2]. After the menopause, plasma total and LDL choles-terol in women tend to increase to the levels usually seen in men, while HDL cholesterol decreases [3].
The menopausal hormonal changes, particularly es-trogen deficiency, may contribute to the development of atherogenic lipid changes. This assumption is
sup-ported by the favourable metabolic effects observed during hormone replacement therapy (HRT) [4,5] and the lower incidence of cardiovascular diseases in women on HRT [1,6]. However, the latter finding has not been observed in all the studies [7].
In addition to age and gender, obesity, dietary fac-tors, smoking, alcohol consumption and physical activ-ity, are known to affect cholesterol metabolism. In several studies genetic factors, e.g. apolipoprotein (apo) E polymorphism [8,9], are also shown to regulate serum cholesterol levels. However, most of the studies
on the regulatory mechanisms of cholesterol
metabolism have been carried out in men and the mechanisms resulting in increased LDL cholesterol af-ter the menopause are poorly understood. Therefore, the aim of the present study was to elucidate the regulatory mechanisms of LDL metabolism in post-menopausal women. Specifically the following ques-tions were raised: first, what are the major factors associated with plasma LDL levels in postmenopausal females? and second, by what mechanisms are the plasma LDL levels regulated?
* Corresponding author. Tel.: +358-8-3154100; fax: + 358-8-3155423.
E-mail address:[email protected] (Y.A. Kesa¨niemi)
2. Subjects and methods
2.1. Subjects
Seventy-nine postmenopausal caucasian women seek-ing hormone substitution therapy for climacteric symp-toms volunteered to participate in the metabolic studies. Only hysterectomized women were included, because our subsequent study focused on unopposed estrogen replacement therapy. Written informed con-sent was obtained from all the subjects, and the study was approved by the Ethical Committees of the two hospitals involved.
Seventy-nine women in the age range 45 – 65 years were recruited. A previous hysterectomy with at least one remaining ovary, serum follicle-stimulating hor-mone (FSH) over 30 I.U./l, fasting blood glucose less than 6.7 mmol/l and body mass index (BMI) less than 30 kg/m2 were used as inclusion criteria. None of the
subjects were on any lipid-lowering drugs or had any clinical evidence of familial hypercholesterolemia. The latter possibility was also excluded by determining the two most common LDL receptor gene mutations in Finland among the subjects whose total cholesterol was over 7.0 mmol/l. None of the women were on post-menopausal hormone therapy.
Smoking habits, alcohol consumption and physical activity were documented using a standardized ques-tionnaire. Smoking was presented as the number of cigarettes smoked per day and alcohol consumption as grams of absolute alcohol consumed in a week. To estimate physical activity, both occupational and leisure time activities were documented by an interview and scored on a four-point scale, where one indicated a sedentary and four a highly active lifestyle. Sixteen participants were current smokers, and 63 subjects were ex-smokers or non-smokers. The mean alcohol intake of the subjects reporting some alcohol consumption was 26 g/week. Eighteen subjects were teetotalers. All the subjects continued their regular home diet and custom-ary physical activities during the study period.
2.2. Clinical characterization and hormone analyses
Height, weight, BMI (weight (kg)/height2 (m2)) and
waist and hip circumference were determined. Serum FSH was measured by the immunofluorometric method and serum estrone and estradiol by radioimmunogical assays in the laboratory of the Oulu Deaconess Institute.
2.3. Lipid and lipoprotein analyses
Blood samples for assays of cholesterol metabolism were drawn into EDTA-containing tubes between 07:00 and 09:00 after an overnight fast. The plasma was
separated by centrifugation at 1200×g (2600 rpm) for 15 min (+4°C). Total plasma cholesterol and triglyce-rides were determined by enzymatic colorimetric meth-ods (kits from Boehringer Diagnostica, Mannheim, Germany). Very low density lipoprotein (VLDL), inter-mediate density lipoprotein (IDL), LDL, HDL2 and HDL3 cholesterol were isolated by repeated ultracen-trifugations according to their densities [10]. HDL cholesterol was determined from VLDL-free plasma after precipitation of low density lipoproteins with hep-arin-manganese. LDL cholesterol was also calculated by the Friedewald formula [11], and these values, which turned out similar to the values obtained after ultracen-trifugation, were used in the analyses. For the lipid and lipoprotein analyses, blood samples were taken at the first visit and three times during the subsequent LDL turnover study. The mean value of the four measure-ments was used in the final analyses. The protein content of the lipoproteins was measured by the method of Lowry et al. [12] and the plasma LDL apo B level was determined with isopropanol precipitation [13]. Plasma total apo A1 and B concentrations were determined by immunoprecipitation methods. Plasma lipoprotein (a) (Lp(a)) concentration was measured with a solid-phase two-site immunoradiometric assay (Pharmacia Diagnostica, Uppsala, Sweden). The coeffi-cients of variation within and between assays were 5.0 and 6.6%, respectively.
2.4. Clearance and production of LDL apo B
Seventy-two women volunteered to participate in the LDL turnover study, which was carried out as previ-ously described [14,15]. Briefly, 100 ml of fasting blood was drawn for the isolation of LDL (d=1.019 – 1.060 g/ml). LDL protein was labeled with125I by the iodine
monochloride method of McFarlane [16] as modified by Bilheimer et al. [17]. Radiolabeled LDL was injected in the morning and blood samples were collected at 0, 15 and 30 min and 1, 2 and 3 h and thereafter three times a week for 14 days after the injection. The radioactivity of total plasma was measured from each sample. The fractional catabolic rate (FCR) was calcu-lated from the plasma decay curves using the Matthews method as previously described [15,18]. The production rate of LDL apo B was calculated from the FCR of LDL, pool volume and LDL apo B concentration, and expressed as milligrams of LDL apo B produced per day per kilogram of body weight.
2.5. Cholesterol absorption
(or [3H]b-sitostanol) three times a day with the major
meals for 7 days, keeping a dietary record during the same time. Stool collections were performed on the last 3 days. The dietary records were analysed by a dietician using the Finnish Food Database Program, Nutrica [20]. Absolute cholesterol absorption was calculated by multiplying the daily dietary cholesterol intake with the cholesterol absorption percentage and expressed as mil-ligrams per kilogram of body weight.
2.6. Determination of the apo E phenotype and polymorphisms of the apo B and7a-hydroxylase genes
The apo E phenotype was determined after delipida-tion with isoelectric focusing and immunoblotting tech-niques [21,22] using commercial antibodies. TheEcoRI and XbaI polymorphisms of the apo B gene were determined by the PCR method as previously described [23]. The polymorphism of the gene encoding 7a -hy-droxylase (CYP7) was also determined by PCR [24].
2.7. Statistical analysis
Power analysis was initially calculated for the estro-gen replacement study. In the retrospective power cal-culation the power of the study was 95% to find the difference in LDL cholesterol levels, FCR for LDL apo B and the LDL apo B production rate between high and low LDL groups. Twenty-four subjects turned out to be sufficient to show the observed differences in LDL cholesterol (a=b=0.05), 48 subjects to show the observed differences in the FCR values for LDL apo B and 64 subjects in the production of LDL apo B (a=b=0.05). However, for the polymorphism studies the power of our study design was lower.
The data analyses were performed with the Statistical Package for Social Sciences (SPSS/PC+statistical soft-ware). The results for continuous variables are
pre-sented as mean9S.D. of the mean. Before the
statistical analyses, natural logarithmic transformations were performed for plasma triglycerides, Lp(a) and the values of absolute cholesterol absorption because of the skewed distribution.
Because the main objective was to elucidate the regu-lation of the LDL cholesterol level, the study popula-tion was divided into two groups according to the LDL cholesterol concentration. The cut point to high and low LDL cholesterol was 4.05 mmol/l. The effect of obesity was estimated by comparing subjects having BMI equal or higher than 26 with those whose BMI was lower than 26. The significance of the differences between the two groups was tested by Student’s two-tailedt-test. The mean differences and their 95% confi-dence intervals are presented in the Tables 1 and 3. Pearson’s correlation coefficients were calculated to in-dicate the relationships between lipids, lipoproteins,
diet, cholesterol absorption and LDL kinetic parame-ters. A one-way ANOVA test was used to compare the effects of apo E and B and 7a-hydroxylase polymor-phisms. PB0.05 was considered to indicate statistical significance.
3. Results
3.1. Subject characteristics
The subjects’ ages ranged from 48 to 63 years, with a mean of 54.292.9 (mean9S.D.) years. The mean BMI was 26.092.5 kg/m2
and the average waist-to-hip ratio was 0.8090.05. The subjects had been postmenopausal on an average for 5.593.2 years. The high FSH levels (65922 I.U./l) and the low values for estradiol (959
150 pmol/l) and estrone (1989116 pmol/l) verified the menopause in all the subjects.
3.2. Plasma lipids and lipoproteins and LDL metabolism
Among all the subjects the mean plasma total choles-terol was 6.26 mmol/l (range, 3.9 – 8.80 mmol/l), LDL cholesterol 4.09 mmol/l (2.20 – 6.15 mmol/l), HDL cholesterol 1.58 mmol/l (0.85 – 2.56 mmol/l), and total triglycerides 1.31 mmol/l (0.61 – 3.26 mmol/l). The FCR values for LDL apo B ranged from 0.183 to 0.418 pools/day with a mean value of 0.300 pools/day, and the LDL apo B production rates ranged from 7.3 to 20.2 mg/kg per day with a mean value of 12.5 mg/kg per day. Cholesterol absorption efficiency varied among the subjects from 16.1 to 82.6% with an average value of 50.4%, and the mean absolute absorption of choles-terol was 2.0 mg/kg per day, ranging from 0.4 to 4.9 mg/kg per day.
In the high LDL cholesterol group the mean LDL cholesterol was 4.7690.58 mmol/l compared with 3.4190.51 mmol/l in the low cholesterol group (Table 1). BMI, total, VLDL and IDL cholesterol, triglyce-rides, total and LDL apo B and Lp(a) were higher, whereas HDL and HDL2, but not HDL3, cholesterol were lower, in the high LDL cholesterol group com-pared with the low LDL cholesterol subjects (Table 1). Also, the production of LDL apo B was significantly higher and the FCR value for LDL apo B lower in the high LDL cholesterol group than in the low LDL cholesterol subjects. No differences were noticed in the fractional and absolute absorption of cholesterol be-tween the high and low cholesterol groups.
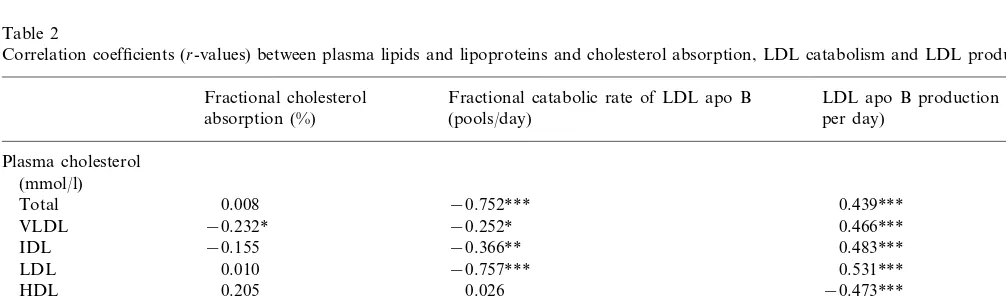
measured lipid values. Plasma triglycerides and VLDL cholesterol, but not LDL or HDL cholesterol values, were negatively associated with fractional cholesterol absorption (Table 2). No relationship was observed between absolute cholesterol absorption and any lipid or lipoprotein value (data not shown).
In this study population the lipid and lipoprotein levels were not significantly associated with smoking, alcohol consumption or physical activity, except the concentrations of HDL cholesterol which correlated with the amount of alcohol consumption (r=0.312,
PB0.01). The dietary intakes and habits for smoking,
Table 1
BMI, plasma lipids, lipoproteins, cholesterol absorption and FCR and production rate values for LDL apo B among subjects with low and high LDL cholesterola
Mean difference (95% CI of difference) LDL\4.05
LDLB4.05
(n=40) (n=39)
54.1 (2.9) 54.3 (3.0) −0.2 (−1.5;1.1) Age (years)
BMI (kg/m2) 25.4 (2.5) 26.7 (2.4) −1.2 (−2.4;−0.1)* 69.9 (7.0) −2.7 (−6.0;0.6) 67.2 (7.8)
Weight (kg)
−0.02 (−0.04;0.01)
Waist-to-hip ratio 0.79 (0.05) 0.81 (0.05)
Plasma cholesterol (mmol/l)
Total 5.59 (0.69) 6.91 (0.70) −1.32 (−1.63;−1.01)***
0.31 (0.16) 0.53 (0.28)
VLDL −0.21 (−0.31;−0.11)***
0.31 (0.13) −0.13 (−0.18;−0.08)*** 0.19 (0.09)
IDL
−1.34 (−1.59;−1.10)*** 3.41 (0.51)
LDL 4.76 (0.58)
1.68 (0.37)
HDL 1.47 (0.32) 0.21 (0.06;0.37)**
0.88 (0.35)
HDL2 1.16 (0.45) 0.29 (0.11;0.47)**
−0.01 (−0.06;0.04)
HDL3 0.56 (0.13) 0.57 (0.11)
Plasma triglycerides (mmol/l)
−0.43 (−0.66;−0.21)*** 1.53 (0.63)
Total 1.10 (0.30)
0.47 (0.20) 0.70 (0.40) −0.23 (−0.37;−0.09)** VLDL
0.08 (−0.09;0.25) 1.96 (0.38)
Plasma apo A1 (g/l) 1.88 (0.38)
−0.35 (−0.46;−0.24)*** 0.91 (0.20)
Plasma apo B (g/l) 1.26 (0.28)
−9.8(−17.3;−2.2)* 24.4 (20.4)
Lp(a) (mg/dl) 14.6 (12.4)
0.043 (0.026;0.061) Fractional cholesterol absorption (%) 50 (12) 51(16)
2.1 (1.1)
Absolute cholesterol absorption (mg/kg per day) 1.8 (0.9) −0.3 (−0.7;0.2)) 0.327 (0.039) 0.284 (0.036) 0.043 (0.026;0.061)*** FCR for LDL apo B (pools/day)
11.2 (2.3) 13.6 (2.5)
Production rate of LDL apo B (mg/kg per day) −2.5 (−3.6;−1.3)*** −32.3 (−41.9;−22.6)*** 108.4 (24.6)
76.1 (14.0) LDL apo B (mg/dl)
aThe values for the LDL subgroups are expressed as mean (S.D.). *PB0.05.
**PB0.01. ***PB0.001.
Table 2
Correlation coefficients (r-values) between plasma lipids and lipoproteins and cholesterol absorption, LDL catabolism and LDL production rate
LDL apo B production (mg/kg Fractional catabolic rate of LDL apo B
Fractional cholesterol
per day) absorption (%) (pools/day)
Plasma cholesterol (mmol/l)
0.008
Total −0.752*** 0.439***
−0.252*
−0.232* 0.466***
VLDL
−0.155
IDL −0.366** 0.483***
0.531*** 0.010
LDL −0.757***
0.205
HDL 0.026 −0.473***
Plasma triglycerides (mmol/l)
0.509***
Total −0.324** −0.222
VLDL −0.295 −0.204 0.460***
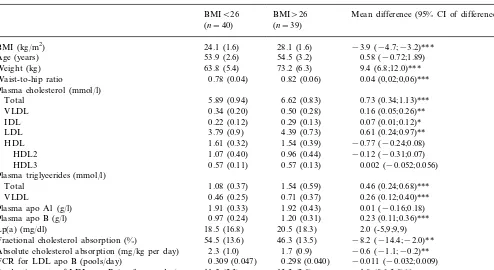
Table 3
BMI, plasma lipids, lipoproteins, cholesterol absorption and the FCR and production rate values for LDL apo B among subjects with low and high BMIa
BMI\26
BMIB26 Mean difference (95% CI of difference) (n=39)
(n=40)
BMI (kg/m2) 24.1 (1.6) 28.1 (1.6) −3.9 (−4.7;−3.2)*** 54.5 (3.2)
53.9 (2.6) 0.58 (−0.72;1.89) Age (years)
63.8 (5.4)
Weight (kg) 73.2 (6.3) 9.4 (6.8;12.0)***
0.78 (0.04)
Waist-to-hip ratio 0.82 (0.06) 0.04 (0,02;0,06)***
Plasma cholesterol (mmol/l)
Total 5.89 (0.94) 6.62 (0.83) 0.73 (0.34;1.13)***
0.50 (0.28)
0.34 (0.20) 0.16 (0.05;0.26)** VLDL
0.22 (0.12)
IDL 0.29 (0.13) 0.07 (0.01;0.12)*
3.79 (0.9)
LDL 4.39 (0.73) 0.61 (0.24;0.97)**
1.54 (0.39)
1.61 (0.32) −0.77 (−0.24;0.08) HDL
0.96 (0.44)
HDL2 1.07 (0.40) −0.12 (−0.31;0.07)
0.57 (0.13)
0.57 (0.11) 0.002 (−0.052;0.056) HDL3
Plasma triglycerides (mmol/l)
1.08 (0.37)
Total 1.54 (0.59) 0.46 (0.24;0.68)***
0.71 (0.37)
0.46 (0.25) 0.26 (0.12;0.40)*** VLDL
Plasma apo A1 (g/l) 1.91 (0.33) 1.92 (0.43) 0.01 (−0.16;0.18) 1.20 (0.31)
0.97 (0.24) 0.23 (0.11;0.36)*** Plasma apo B (g/l)
18.5 (16.8)
Lp(a) (mg/dl) 20.5 (18.3) 2.0 (-5,9;9,9)
54.5 (13.6)
Fractional cholesterol absorption (%) 46.3 (13.5) −8.2 (−14.4;−2.0)** 1.7 (0.9)
2.3 (1.0) −0.6 (−1.1;−0.2)** Absolute cholesterol absorption (mg/kg per day)
0.298 (0.040) −0.011 (−0.032;0.009) FCR for LDL apo B (pools/day) 0.309 (0.047)
13.3 (2.8)
11.5 (2.3) 1.8 (0.6;3.0)**
Production rate of LDL apo B (mg/kg per day)
85.4 (24.9)
LDL apo B level (mg/dl) 100.9(25.0) 15.5 (3.8;27.3)*
aThe values for the BMI subgroups are expressed as mean (S.D.). *PB0.05.
**PB0.01. ***PB0.001.
alcohol consumption and physical activity did not dif-fer between the high and low LDL cholesterol groups (data not shown).
3.3. Effect of obesity on lipids, lipoproteins and metabolic factors
Since BMI was positively associated with total cholesterol (r=0.288,PB0.01), VLDL (r=0.385,PB
0.01), IDL (r=0.354, PB0.001) and LDL (r=0.265,
PB0.05) cholesterol and both total (r=0.497, PB
0.001) and VLDL (r=0.424, PB0.001) triglycerides, the study population was divided into two groups with BMIB26 kg/m2 and BMI]26 kg/m2 (Table 3). The
obese women had higher plasma total, VLDL, IDL and LDL cholesterol, total and VLDL triglyceride and apo B levels than the non-obese subjects. No significant differences between the two groups were observed for HDL, HDL2, HDL3, apo A1 and Lp(a) concentra-tions. The obese subjects also had a higher LDL apo B production rate and lower fractional and absolute ab-sorption of cholesterol than the non-obese individuals, but no differences were observed in the FCR values for LDL apo B between the two groups.
3.4. Effects of apo E phenotype
The women with apo E phenotype 2 (E 2/2, 2/3 and 2/4) (n=4) tended to have lower total (5.939
1.11 mmol/l) and LDL cholesterol (3.5491.21 mmol/
l) and higher VLDL (0.5390.21 mmol/l), IDL (0.3490.10 mmol/l) and HDL (1.8190.34 mmol/l) cholesterol levels than the women with the phenotypes E 3/3 (n=49) or E 4 (E 4/3, 4/4) (n=26), while the women with the phenotype E 4 tended to have the highest total (6.590.88 mmol/l) and LDL (4.279
3.5. Effects of EcoRI, XbaI and7a-hydroxylase polymorphisms
Fifty-three subjects had the EcoRI genotype + / +
(presence of cutting site), 24 were heterozygous (+ / −) and 2 homozygous (− / −, absence of cutting site). For the XbaI polymorphism 13 had the XbaI genotype
+ / +, 45 were heterozygotes (+ / −) and 21 had the
XbaI genotype − / −. TheEcoRI and XbaI polymor-phisms of the apo B gene had no significant effect on cholesterol metabolism in these subjects (data not shown).
No significant differences in cholesterol metabolism in relation to the polymorphism of 7a-hydroxylase were observed between the subjects homozygous for the A allele (AA, n=21) compared with those having only one (AC, n=40) or none of this allele (CC, n=18) (data not shown).
4. Discussion
All the women of our study were hysterectomized and had at least one ovary left. There is no evidence that hysterectomy alone without oophorectomy would
alter the hormonal menopause, while surgical
menopause after bilateral oophorectomy is followed by menopausal symptoms and metabolic changes. In the present study, all the women were postmenopausal, and premenopausal subjects would have been needed to investigate the changes related to the menopause itself. At any rate, the difference observed in the lipid values of premenopausal women compared with females with surgical or natural menopause suggests the importance of estrogen deficiency and is supported by the positive effect of hormone replacement therapy shown in several studies with unopposed estrogen replacement therapy [1,25 – 27].
In the present study high LDL cholesterol levels were related to atherogenic lipid profiles, high total choles-terol, triglycerides, Lp(a) and low HDL and HDL2 cholesterol. Low FCR for LDL apo B and high pro-duction rates of LDL apo B were shown to mainly explain these differences. Our finding that FCR for LDL apo B is important in the regulation of plasma cholesterol level in postmenopausal women is in agree-ment with a previous study [28], which showed the hypercholesterolemia in postmenopausal women to be primarily attributable to a reduced activity of LDL receptors, when hypercholesterolemic postmenopausal women were compared with normocholesterolemic women and men. In contrast to the present study, no difference in the production rate of LDL apo B was noticed by Arca et al. [28]. An association between LDL cholesterol and FCR for LDL apo B and LDL production has also been previously observed in studies
on the regulation of serum cholesterol in middle-aged and elderly men [14,29]. However, in contrast to the findings made in middle-aged men [30] cholesterol ab-sorption efficiency was not related to the plasma LDL cholesterol level in our female subjects.
BMI was one factor that segregated the low and high LDL cholesterol groups. Obesity is known as an impor-tant risk factor for lipid alterations in postmenopausal women [3,31 – 33]. In fact, a tendency to weight gain and abdominal fat distribution during menopause has also been observed [34]. How does obesity alter the plasma lipid and lipoprotein values in postmenopausal women? The absorption efficiency of cholesterol does not seem to be important since both the fractional and absolute cholesterol absorption values were lower in the obese than in the non-obese women. An increase in LDL apo B production rate seemed to be a significant mechanism for the high LDL cholesterol levels in the obese subjects, while FCR for LDL apo B was similar in these two groups. High LDL apo B production in obesity has also been shown in male subjects [35].
A relationship between LDL cholesterol and choles-terol absorption efficiency and apo E phenotypes has been observed in men [8,9]. The apo E2 group had lower total and LDL cholesterol levels, LDL apo B production rate and cholesterol absorption, and higher FCR for LDL apo B compared with the apo E3 and apo E4 groups [9]. In fact, similar trends were also seen in the present study, but the differences between the apo E phenotypes were not significant. Apo E polymor-phism has been estimated to account about 5 – 10% of the variance in plasma LDL cholesterol [36]. Another study suggested 5.0% of the LDL cholesterol level variance being explained by apo E polymorphism in
postmenopausal women and only 0.5% in
In conclusion, FCR for LDL apo B (an indicator of LDL receptor activity), LDL apo B production rate and BMI were the main determinants of lipoprotein metabolism among the present postmenopausal female subjects. Compared with the previous findings in men of similar age, cholesterol absorption efficiency and apo B and apo E polymorphisms did not seem to have any important role in the lipoprotein metabolism of these postmenopausal women.
Acknowledgements
The authors are grateful to Dr Jonathan Cohen, Centre for Human Nutrition, Department of Clinical Nutrition, Dallas, TX, USA, for the analysis of 7a -hy-droxylase polymorphisms. We also thank Kaisa Ke-tonen, Saija Kortetja¨rvi, Marja-Leena Kyto¨kangas, Tiina Lapinkari, Anna-Riitta Malinen, Liisa Manner-maa, Eila Saarikoski and Leena Ukkola for skillful technical assistance.
References
[1] Barrett-Connor E, Bush TL. Estrogen and coronary heart dis-ease in women. J Am Med Assoc 1991;265:1861 – 7.
[2] Kannel WB. Metabolic risk factors for coronary heart disease in women: perspective from the Framingham Study. Am Heart J 1987;114:413 – 9.
[3] Stevenson JC, Crook D, Godsland IF. Influence of age and menopause on serum lipids and lipoproteins in healthy women. Atherosclerosis 1993;98:83 – 90.
[4] Nabulsi AA, Folsom AR, White A, et al. Association of hor-mone-replacement therapy with various cardiovascular risk fac-tors in postmenopausal women. The Atherosclerosis Risk in Communities Study Investigators. New Engl J Med 1993;328:1069 – 75.
[5] The Writing Group for the PEPI Trial. Effects of estrogen or estrogen/progestin regimens on heart disease risk factors in postmenopausal women. The Postmenopausal Estrogen/ Progestin Interventions (PEPI) Trial. J Am Med Assoc 1995;273:199 – 208.
[6] Grodstein F, Stampfer MJ, Manson JE, et al. Postmenopausal estrogen and progestin use and the risk of cardiovascular disease. New Engl J Med 1996;335:453 – 61.
[7] Hulley S, Grady D, Bush T, et al. Randomized trial of estrogen plus progestin for secondary prevention of coronary heart dis-ease in postmenopausal women. Heart and Estrogen/Progestin Replacement Study (HERS) Research Group. J Am Med Assoc 1998;280:605 – 13.
[8] Kesa¨niemi YA, Ehnholm C, Miettinen TA. Intestinal cholesterol absorption efficiency in man is related to apoprotein E pheno-type. J Clin Invest 1987;80:578 – 81.
[9] Miettinen TA, Gylling H, Vanhanen H, Ollus A. Cholesterol absorption, elimination, and synthesis related to LDL kinetics during varying fat intake in men with different apoprotein E phenotypes. Arterioscler Thromb 1992;12:1044 – 52.
[10] Lipid Research Clinics Program. Manual of Laboratory Opera-tions. Lipid and Lipoprotein Analysis. Bethesda: DHEW Publi-cations (NIH), 1974:75 – 82.
[11] Friedewald WT, Levy RI, Fredrickson DS. Estimation of the concentration of low-density lipoprotein cholesterol in plasma, without use of the preparative ultracentrifuge. Clin Chem 1972;18:499 – 502.
[12] Lowry OH, Rousebrough NJ, Farr AL, Randall RJ. Protein measurement with the Folin phenol reagent. J Biol Chem 1951;193:265 – 75.
[13] Egusa G, Brady DW, Grundy SM, Howard BV. Isopropanol precipitation method for the determination of apolipoprotein B specific activity and plasma concentrations during metabolic studies of very low density lipoprotein and low density lipo-protein apolipolipo-protein B. J Lipid Res 1983;24:1261 – 7. [14] Kesa¨niemi YA, Grundy SM. Significance of low density
lipo-protein production in the regulations of plasma cholesterol level in man. J Clin Invest 1982;70:13 – 21.
[15] Ho¨rkko¨ S, Huttunen K, Korhonen T, Kesa¨niemi YA. Decreased clearance of low-density lipoprotein in patients with chronic renal failure. Kidney Int 1994;45:561 – 70.
[16] McFarlane AS. Efficient trace-labelling of proteins with iodine. Nature 1958;182:53.
[17] Bilheimer DW, Goldstein JL, Grundy SM, Brown MS. Reduc-tion in cholesterol and low density lipoprotein synthesis after portacaval shunt surgery in a patient with homozygous familial hypercholesterolemia. J Clin Invest 1975;56:1420 – 30.
[18] Matthews CME. The theory of tracer experiments with iodine-131-labelled plasma proteins. Phys Med Biol 1957;2:36 – 53. [19] Crouse JR, Grundy SM. Evaluation of a continuous isotope
feeding method for measurement of cholesterol absorption in man. J Lipid Res 1978;19:967 – 71.
[20] Rastas M, Seppa¨nen R, Knuts L, Karvetti R, Varo P. Nutrient Composition of Foods. Helsinki: Social Insurance Institution, 1993.
[21] Menzel H, Utermann G. Apolipoprotein E phenotyping from serum by Western blotting. Electrophoresis 1986;7:492 – 5. [22] Ehnholm C, Lukka M, Kuusi T, Nikkila¨ E, Utermann G.
Apolipoprotein E polymorphism in the Finnish population: gene frequencies and relation to lipoprotein concentrations. J Lipid Res 1986;27:227 – 35.
[23] Ukkola O, Savolainen MJ, Salmela PI, von Dickhoff K, Ke-sa¨niemi YA. Apolipoprotein B gene DNA polymorphisms are associated with macro- and microangiopathy in non-insulin-de-pendent diabetes mellitus. Clin Genet 1993;44:177 – 84. [24] Wang J, Freeman DJ, Grundy SM, Levine DM, Guerra R,
Cohen JC. Linkage between cholesterol 7alpha-hydroxylase and high plasma low-density lipoprotein cholesterol concentrations. J Clin Invest 1998;101:1283 – 91.
[25] Vaziri SM, Evans JC, Larson MG, Wilson PW. The impact of female hormone usage on the lipid profile. The Framingham Offspring Study. Arch Intern Med 1993;153:2200 – 6.
[26] Wakatsuki A, Sagara Y. Lipoprotein metabolism in post-menopausal and oophorectomized women. Obstet Gynecol 1995;85:523 – 8.
[27] Lip GY, Blann AD, Jones AF, Beevers DG. Effects of hormone-replacement therapy on hemostatic factors, lipid factors, and endothelial function in women undergoing surgical menopause: implications for prevention of atherosclerosis. Am Heart J 1997;134:764 – 71.
[28] Arca M, Vega GL, Grundy SM. Hypercholesterolemia in post-menopausal women. Metabolic defects and response to low-dose lovastatin. J Am Med Assoc 1994;271:453 – 9.
[29] Gylling H, Strandberg T, Tilvis R, Miettinen TA. Regulation of serum cholesterol level in middle-aged and elderly men. Relation of cholesterol absorption and synthesis to lipoprotein metabolism. Arterioscler Thromb 1994;14:694 – 700.
[31] Matthews KA, Meilahn E, Kuller LH, Kelsey SF, Caggiula AW, Wing RR. Menopause and risk factors for coronary heart disease. New Engl J Med 1989;321:641 – 6.
[32] Haarbo J, Hassager C, Schlemmer A, Christiansen C. Influence of smoking, body fat distribution, and alcohol consumption on serum lipids, lipoproteins, and apolipoproteins in early post-menopausal women. Atherosclerosis 1990;84:239 – 44.
[33] Wing RR, Matthews KA, Kuller LH, Meilahn EN, Plantinga PL. Weight gain at the time of menopause. Arch Intern Med 1991;151:97 – 102.
[34] Haarbo J, Marslew U, Gotfredsen A, Christiansen C. Post-menopausal hormone replacement therapy prevents central distri-bution of body fat after menopause. Metabolism 1991;40:1323 – 6. [35] Kesa¨niemi YA, Grundy SM. Increased low density lipoprotein production associated with obesity. Arteriosclerosis 1983;3:170 – 7.
[36] Boerwinkle E, Sing CF. The use of measured genotype informa-tion in the analysis of quantitative phenotypes in man. III. Simultaneous estimation of the frequencies and effects of the apolipoprotein E polymorphism and residual polygenetic effects on cholesterol, betalipoprotein and triglyceride levels. Ann Hum Genet 1987;51:211 – 26.
[37] Schaefer EJ, Lamon-Fava S, Johnson S, et al. Effects of gender and menopausal status on the association of apolipoprotein E phenotype with plasma lipoprotein levels. Results from the Framingham Offspring Study. Arterioscler Thromb 1994;14:1105 – 13.
[38] Bosner MS, Lange LG, Stenson WM, Ostlund RE. Percent cholesterol absorption in normal women and men quantified with dual stable isotopic tracers and negative ion mass spec-trometry. J Lipid Res 1999;40:302 – 8.