* C orresponding author
D ept. of Geomatics E ngineering, F aculty of C ivil E ngineering and Planning;
b
D ept. of Urban and R egional Planning, F aculty of C ivil E ngineering and Planning;
c
D ept. of Marine E ngineering, F aculty of Marine T echnology;
d
D ept. of Naval A rchitecture and S hipbuilding E ngineering, F aculty of Marine T echnology, Institut T eknologi S epuluh Nopember, Surabaya, 60111, Indonesia. E mail: aldila.syariz11@ mhs.geodesy.its.ac.id, lmjaelani@ geodesy.its.ac.id
,
[email protected],
eddy-koen@ its.ac.id,
sulisea@ na.its.ac.id
e
R esearch C entre for L imnology, Indonesian Institute of S ciences, C ibinong S cience C entre, 16911, Indonesia. E mail: luki@ limnologi.lipi.go.id algorithms in the North J ava Island W ater. T he data used are in-situ data measured on A pril 22, 2015 and also estimated brightness temperature data from L andsat 8 T hermal B and Image (band 10 and band 11) . T he algorithm was established using 45 data by important oceanic environmental factors in determining the change of marine environments and ecological activities ( K ang especially the atmospheric effects. T he difficulty of atmospheric correction limits the use of T M/E T M + T IR bands in coastal and inland water (R itchie and C ooper, 2001; S chott et al., 2001) . S ome researchers have established S S T inversion usually difficult to apply these algorithms to different atmospheric conditions. T risakti et al. ( 2013) developed an algorithm to estimate S S T by using the thermal band of L andsat. T his model can be applied to obtain SS T distribution from data with different seasonal condition in northern and southern water of J ava and B ali. B ut, this is an alternative method in the case of lack of in-situ data.
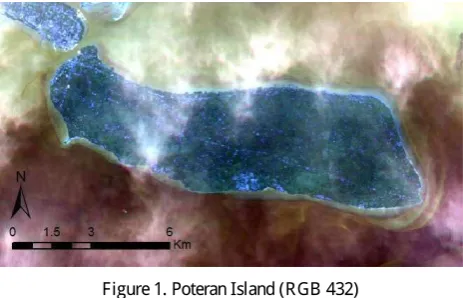
T his research was to develop SS T algorithm model from S outheast Madura Island, E ast J ava, Indonesia.
F igure 1. Poteran Island ( R GB 432)
T able 1. Metadata of S atellite Image
T hermal C onstant B and 10 B and 11
K 1 774.89 480.89
K 2 1321.08 1201.14
T able 2. K 1 and K 2 V alue
The International Archives of the Photogrammetry, Remote Sensing and Spatial Information Sciences, Volume XL-2/W4, 2015 Joint International Geoinformation Conference 2015, 28–30 October 2015, Kuala Lumpur, Malaysia
This contribution has been peer-reviewed.
R escaling F actor B and 10 B and 11
M 3.3420E -04 3.3420E -04
A 0.10000 0.10000
T able 3. R escaling F actor
T he digital number of B and 10 and B and 11 were converted to the brightness temperature by using that metadata. F irst, it had to be converted to radiance by using following formula.
(1) is top of atmosphere spectral radiance. is band-specific multiplicative rescaling factor. is digital number. A nd is band-specific additive scaling factor. ( United States Geological S urvey, 2013)
T hen, converted them to the brightness temperature by using this formula.
(2) is at-satellite brightness temperature. and are band-specific thermal conversion constant. (United States Geological S urvey, 2013)
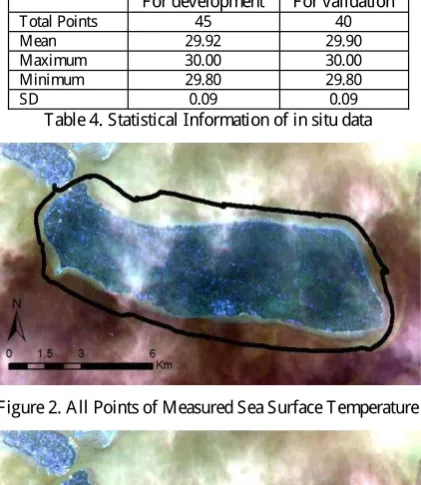
T he measured data was obtained by using the GA R MIN A qua Map on W ednesday, A pril 22, 2015. T his instrument recorded not only water depth but also sea surface temperature. It recorded 21147 data in total. F or this research, we just used 85 points in developing and validating the algorithm. T able 4 shows the statistical attribute of those points. F igure 2 and 3 shows all points and 85 points.
F or development F or validation
T otal Points 45 40 Mean 29.92 29.90 Maximum 30.00 30.00 Minimum 29.80 29.80
SD 0.09 0.09
T able 4. S tatistical Information of in situ data
F igure 2. A ll Points of Measured S ea S urface T emperature
F igure 3. 85 Points for D eveloping and V alidating the A lgorithm
2.3 S tatistical A nalysis
T o test the accuracy of L andsat 8 T hermal S ensor B rightness T emperature, coefficient of determination ( R
2
) and R oot Mean S quare E rror ( RMSE ) were used. T he formula of which was shown below.
(3)
In the case of developing an algorithm, is the brightness temperature based on thermal bands of L andsat. But, in validating the algorithm, is the estimated S ea S urface T emperature. W hile, is the measured S ea S urface T emperature.
( 4) is the estimated value of S ea S urface T emperature by the algorithm. is measured value of S ea S urface T emperature by G armin A qua Map. is total validating points of the algorithm. B y using RMSE , we can know how well the algorithm performance
3. R E S UL T A ND D I SC US S I O N
3.1 R elation of L andsat T her mal B r ightness T emper atur e and M easur ed S ea S ur face T emper atur e
T able 5 shows the relationship between L andsat 8 T hermal S ensor B rightness T emperature and S ea Surface T emperature by Garmin A qua Map. A nd, that table shows the algorithm of S ea S urface T emperature. F igure 4 and 5 shows the relation graphics of them.
R egression Model
R
2
B and 10 B T B and 11 B T
L inear 0.691 0.801
Poly-2 0.717 0.809
Poly-3 0.717 0.861
T able 5. R egression Model of B and 10 or B and 11 B T and Measured Sea S urface T emperature
The International Archives of the Photogrammetry, Remote Sensing and Spatial Information Sciences, Volume XL-2/W4, 2015 Joint International Geoinformation Conference 2015, 28–30 October 2015, Kuala Lumpur, Malaysia
This contribution has been peer-reviewed.
F igure 4. R elation of band 10 B T and Measured S ea Surface T emperature
F igure 5. R elation of band 11 B T and Measured Sea Surface T emperature
T he brightness temperature and the measured sea surface temperature had a good relation. It could be seen by the value of R
2
which was above 0.690. 3.2 A lgor ithm D evelopment
A fter knew the relationship of L andsat T hermal S ensor B rightness T emperature and Measured S ea Surface
T emperature, we developed an algorithm. T able 6 and 7 shows the T S S retrieval algorithm for band 10 and 11.
R egression model
B and 10 B rightness T emperature
A lgorithm R
2
L inear y = -0.0835x + 31.192 0.691 Poly-2 y = -0.0273x
2
+ 0.7474x + 24.882
0.717 Poly-3 y = -0.0054x
3
+ 0.2166x
2
-2.9425x + 43.461
0.717
T able 6. S S T A lgorithm based on B and 10 R egression
model
B and 11 B rightness T emperature
A lgorithm R
2
L inear y = -0.0996x + 30.899 0.801 Poly-2 y = -0.0197x
2
+ 0.2881x + 29.004
0.809 Poly-3 y = 0.0798x
3
- 2.3596x
2
+23.093x + 44.861
0.861
T able 7. S S T A lgorithm based on B and 11
W here, x is the dependence variable and y is the independence variable. x is the value of brightness temperature of which bands and y is the estimated value of sea surface temperature. 3.3 V alidation of A lgor ithm
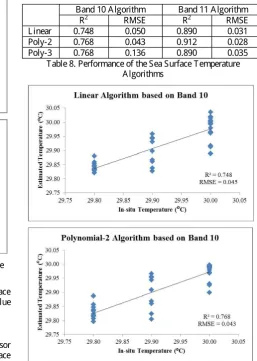
A fter developed an algorithm, we needed to assess the performance by validated it using 40 remaining data points. T able 8 shows the value of R
2
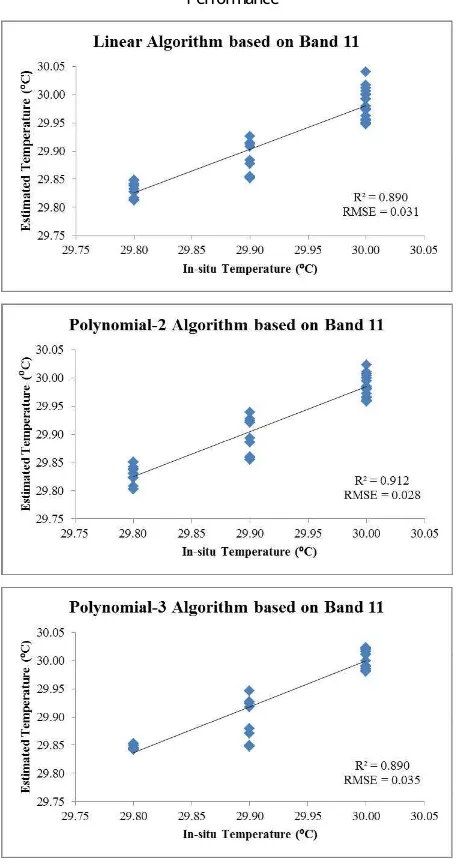
and RMSE of the algorithms. F igure 6 and 7 shows the graphics of the algorithms validation.
B and 10 A lgorithm B and 11 A lgorithm R
2
RMSE R
2
RMSE
L inear 0.748 0.050 0.890 0.031
Poly-2 0.768 0.043 0.912 0.028
Poly-3 0.768 0.136 0.890 0.035
T able 8. Performance of the S ea S urface T emperature A lgorithms
The International Archives of the Photogrammetry, Remote Sensing and Spatial Information Sciences, Volume XL-2/W4, 2015 Joint International Geoinformation Conference 2015, 28–30 October 2015, Kuala Lumpur, Malaysia
This contribution has been peer-reviewed.
F igure 6. B and 10 S ea S urface T emperature A lgorithms Performance
F igure 7. B and 11 S ea S urface T emperature A lgorithms Performance
T he algorithm based on band 11 polynomial-2 with coefficient of -0.0197, 0.2881, and 29.004 had a good performance. It could be seen by its R
2
and RMSE value. T he R
2
is 0.912 and the RMSE is 0.028.
4. C ONC L US I ON
T he L andsat 8 thermal sensor brightness temperature had a good relationship with the measured sea surface temperature. T he R
2
was above 0.600, the development of algorithms reach the optimum performance if made based on band 10 or 11. T he algorithm based on band 11 polynomial2 with coefficient of -0.0197, 0.2881, and 29.004 achieved the best performance. Using this algorithm, a routine monitoring of sea surface temperature can be conducted by using satellite data with sufficient accuracy.
A C K NO W L E D G E M E NT S
T his research is a part of S ustainable Island D evelopment Initiatives ( S ID I) Program, a collaborative research in small island development between Indonesia and Germany.
R E F E R E NC E S
A hn, Y u-hwan, et al. 2006. A pplication of S atellite Infrared D ata for Mapping of T hermal Plume C ontamination in C oastal E cosystem of K orea. Marine E nvironmental Research, 61(2), 186-201.
C hen C , Shi P, Mao Q. 2003. A pplication of R emote S ensing T echniques for Monitoring the T hermal Pollution of C ooling-water D ischarge from Nuclear Power Plant. J ournal of E nvironmental Science and Health, V ol. A 38(3), Part A - T oxic/Hazardous S ubstances and E nvironmental E ngineering, A 38(8), pp. 1659-1668.
K ang, K i-mook, et al. 2014. C omparison of C oastal S ea S urface T emperature derived from S hip-, A ir-, and Space-borne T hermal Infrared S ystems. International G eoscience and Remote Sensing Symposium, pp. 4419-4422.
Mao, Z , Q. Z hu, D . Pan. 2004. A n Operational S atellite R emote S ensing S ystem for Ocean F ishery. Acta Oceanologica, 23(3), pp. 427-436.
Qianguo, X ing, et al. 2006. A tmospheric C orrection of L andsat D ata for the R etrieval of S ea S urface T emperature in C oastal W ater. Acta Oceanologica, 25(3), pp. 25-34.
R itchie, J erry C ., C harles M. C ooper. 2001. R emote Sensing T echnique for D etermining W ater Quality: A pplications to T MD L s. T MD L Science Issues C onference, pp. 367-374. S chott, J ohn R ., et al. 2001. C alibration of L andsat T hermal D ata and A pplication to W ater R esource S tudies. Remote Sensing E nvironment, 78(1-2), pp. 108-117.
T homas, A ndrew, D eirdre B yrne, R yan W eatherbee. 2002. C oastal S ea S urface T emperature V ariability from L andsat Infrared D ata. Remote Sensing of E nvironment, 81(2-3), pp. 262-272.
T risakti, B ambang, S ayidah S ulma, S yarif B udhiman. 2013. S tudy of S ea S urface T emperature ( S S T ) using L andsat-7 E T M (In C omparison with S ea S urface T emperature of NOA A -12 A V HR R ) . T he T hirteen Workshop of OMISAR , pp. 181-185. United S tates Geological S urvey. 2013. Using the USGS
L andsat 8 Product.
http://landsat.usgs.gov/L andsat8_ Using_ Product.php (29 J un. 2015.
The International Archives of the Photogrammetry, Remote Sensing and Spatial Information Sciences, Volume XL-2/W4, 2015 Joint International Geoinformation Conference 2015, 28–30 October 2015, Kuala Lumpur, Malaysia
This contribution has been peer-reviewed.