S. Mulyani et al./Agroindustrial Journal Vol. 1 Issue 1 (2012) 7-14
Profile Review of Grapes Horticulture Cultivation in the
Buleleng
Sri Mulyani
1, Bambang Admadi
2, Ketut Satriawan
3and Made Hendra Mardiana
4Department of
Agroindustrial Technology, Faculty of Agricultural Technology,
Udayana University, Jl. Kampus Bukit Jimbaran. Bali
Email: moel [email protected] ba [email protected]
Abstract
Buleleng as a centre of grape commodity in Bali has experienced a decrease in the number of grapes production. Grapes horticultural profile should be made based on 6 (six) pillars of the horticulture development. The aim of this study is to determine cultivation profile of the grapes horticulture in Buleleng. This research uses purposive sampling method to determine sample location. The respondents consist of farmers, stakeholders and other relevant agencies which chosen by using random sampling method. The results show respondents’ opinion related to the pillar program compatibility and incompatibility: 1) development of horticultural area 78.88% and 20.00%, 2) application of GAP / SOP 68.88% and 29.63%, 3) implementation of supply chain management (SCM) 59.10% and 40.90%, 4) implementation of integrated horticultural facility 64.18% 33.32%, 5) Institutional development 19.99% and 79.18%, and 6a) increase on horticultural consumption 44.06% and 51.48%, while 6b) on the export acceleration 7.91% and 92.09%. Based on the six pillars development program implementation, only four programs namely program 1, 2, 3, and 4 that have high average of compatibility (67.76%) while the other two programs, namely the program 5 and 6 have lower average of compatibility (22.99%).
Key word: 6 pillars of the horticulture development. grape, Buleleng
1. INTRODUCTION
Indonesia produces a wide range of tropical fruits with various and excellent taste (Anonim. 2006). Nevertheless the development of grapes commodity in Indonesia is limited. The centers of grapes cultivation in Indonesia are only in Buleleng, Palu and Probolinggo (Setiadi, 1986). Anonymous (2010) stated that Buleleng is the center grapes cultivation in Bali where grapes have been planted since 1984. The varieties of grapes planted in Buleleng are: Gross Colman, Frankenthaler, Isabella, Alphonso Lavalle, and Brilliant. Based on data in 2009, grapes planting area in Buleleng is around 1118.51 ha with 592.668 vine trees that can produce 14 841 tons of grapes. The main grape producers in Buleleng are: District Banjar (6486 tons), District Seririt (4501
tons) and the District of Gerogak (3851 tons). The current issue that they face is grapes production is decreasing (Anon, 2009).
Horticulture grapes profile needs to be prepared for a proper development which based on 6 (six) pillar horticulture development, namely: 1) development of the horticulture agribusiness, 2) implementation of supply chain management (SCM), 3) application of good agricultural cultivation (GAP) and (SOP), 4) facilitation of integrated horticultural investment, 5) institutional development efforts, and 6) an increase in consumption and exports (Anonymous, 2008).
carried out simultaneously and integrated between the central, provincial and district levels to facilitate and simplify access to the private sector / entrepreneurs (Anonymous, 2008). The aim of this study is to determine the profile of grape horticulture cultivation in Buleleng. Data base of grapes horticulture area development in Buleleng as a scientific information is expected from this research.
2. RESEARCH METHOD
This research uses purposive sampling method to determine sample location. Respondents consisted of farmers, stakeholders, local collectors, village collectors, wholesalers, and related institutions which are determined by a simple random sampling. The study sites are in the District of Banjar, District of Seririt and District of Gerokgak Buleleng. This study begins from December 2010 until February 2011. Source of data used in this study is the primary data and secondary data.
3. RESULTS AND DISCUSSION
3.1. Development of Horticulture Agribusiness Areas.
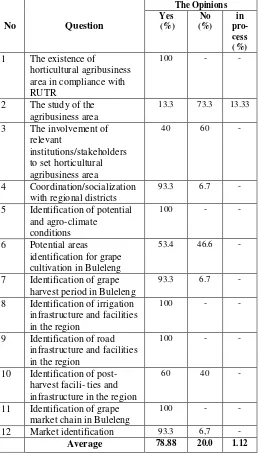
The purpose of developing horticulture agribusiness area is to increase production, productivity and quality of agricultural products. An average of 78.88 % respondents said that the development of horticulture area was compatible while 20.00% of the respondents said it was incompatible as can be seen in table 1. Around 73% of the respondents said that there has been no previous study done because the involvement of relevant agencies/stakeholders to set the agribusiness area is only 40%. In relation to the potential development of the grapes commodities area, 46.6% the respondents said there is no socialization and training from BPTP or training centers. 40% of respondents thought it was because of the lack of grapes post-harvest facilities which were necessary to maintain grapes quality.
Table 1. The Average of Respondent’s Opinion in The Development of Grape Horticulture Area.
The Opinions
No Question
Yes (%)
No (%)
in pro-cess (%)
1 The existence of
horticultural agribusiness area in compliance with RUTR
100 - -
2 The study of the agribusiness area
13.3 73.3 13.33
3 The involvement of relevant
institutions/stakeholders to set horticultural agribusiness area
40 60 -
4 Coordination/socialization with regional districts
93.3 6.7 -
5 Identification of potential and agro-climate
conditions
100 - -
6 Potential areas identification for grape cultivation in Buleleng
53.4 46.6 -
7 Identification of grape harvest period in Buleleng
93.3 6.7 -
8 Identification of irrigation infrastructure and facilities in the region
100 - -
9 Identification of road infrastructure and facilities in the region
100 - -
10 Identification of post-harvest facili- ties and infrastructure in the region
60 40 -
11 Identification of grape market chain in Buleleng
100 - -
12 Market identification 93.3 6,7 -
Average 78.88 20.0 1.12
3.2. Application of Good Agriculture Practices (GAP) & Standard Operating Procedure (SOP)
S. Mulyani et al./Agroindustrial Journal Vol. 1 Issue 1 (2012) 7-14
respondents had problems in implementing SOP. There is 60% of respondents who did not have the farmer group partnership in the implementation of GAP/SOP with the private sector. These things lead to the lack of application of the GAP/SOP.
Tabel 2. The Average of Respondent’s Opinion in Relation to the Implementation of GAP and SOP
The opinions
No Question
Yes (%)
No (%)
in pro-cess (%) 1 Is there any GAP
implementation to the institution and stakeholders?
100 - -
2 Has government reproduced and distributed the book of GAP implementation to farmers' groups
13.3 86.7 -
3 In the implementation GAP/SOP, are there any trained personnel?
93.3 6.7 -
4 In the implementation GAP/SOP, is there any sample farm available?
80 13.3 6.7
5 In the implementation SOP, are the steps already meet the standards in accordance to the guidelines that have been made?
60 33.3 6.7
6 Is there any obstacle in the implementation SOP?
60 40 -
7 Is there any Direction for running GAP /SOP farm?
100 - -
8 Is there any
partnership between the farmer group that implement GAP/SOP with the private sector?
46.7 53.3 -
9 In the implementation GAP/SOP, has the Provincial Agriculture Office registered GAP /SOP farm to the expand the implementation GAP/SOP
66.7 33.3 -
Average 68.88 29.6 1.49
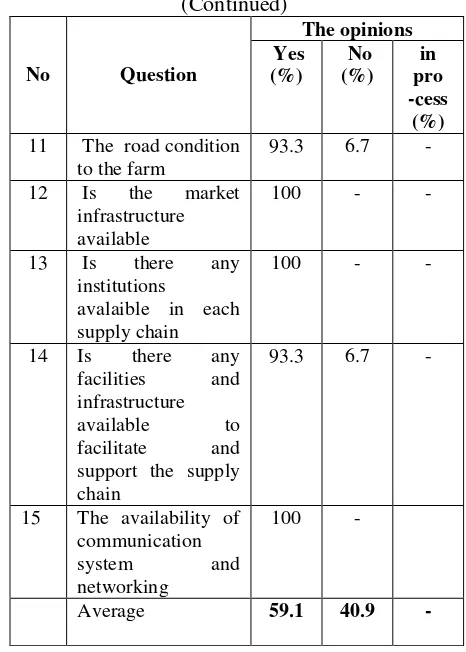
3.3. Implementation of Supply Chain
Management (SCM)
Table 3. The Average of Respondent’s Opinion on The Implementation of Supply Chain Management
The opinions grape’s market supply chain
26.7 73.3 -
3 Are there any business agents who have roles in grape supply chain
100 - -
4 Does the supply chain condition of grape commodity market have been efficient,
transparent and the communication between actors has been going well
20 80 -
5 Is there any market survey that has ever done to find out the willingness of consumers towards the quality of the grapes
20 80 -
6 Does the grapes have been fulfilling customer needs in terms of price and quality
10 Infrastructure condition off arm roads
100 - -
Table 3. The Average of Respondent’s Opinion on The Implementation of Supply Chain Management
(Continued) facilities and infrastructure available to facilitate and support the supply
3.4. Implementation of the integrated facilities horticulture investment
S. Mulyani et al./Agroindustrial Journal Vol. 1 Issue 1 (2012) 7-14
Table 4. The Average of Respondent’s Opinion on IFHI Design of Road Map development of the area from the Department of Agriculture
- 80 20
Are public service facilities available
services (bank / nonbank) Land services and
Quarantine
13.3 86.7 - 4
average 64.18 33.32 2.5
The high percentage in terms of technology (93.3%), licenses (66.7%) and quarantine services (86.7%) are due to the lack of socialization from the government and the lack of providing facilitator for relevant learning.
3.5 Development of institutions
Table 5 shows the average respondents' opinions on the institutions development. Only 19.99 % of the respondents said that the institutions have developed while 79.18% of respondents said it has not developed yet. The farmer group is still limited in developing grape commodity. The institutional development only
formed in the group of farmers and groups of farmers' groups (Gapoktan), but no networking or partnerships between them with merchant/businessman. Farmers were also lacking institutional role in the supply chain, as well as the merchants association. This situation suggests that institutional development only occurs at the level of farmer group and limited to the commodity, while the institutions development of the others has been done but in small percentage. This causes the grape commodity does not have clear development, because the development of institutions is only 19.19% done
Table 5. The Average of Respondent’s Opinion in The Institution Development
The Opinions group of farmer group (Gapoktan) in getting the best commodity
4 Partnerships between farmer’s groups with the merchant/business
6 Meetings between the
farmers-association in the region
3.6. Increased and accelerated consumption of horticultural exports
Table 6. The Average Respondents' Opinions on The Improvement of Horticultural Consumption
The opinions 1 Land availability to
develop commodity
73.3 26.7 -
2 Manufacturers understand the types of product of consumer necessary
73.3 20 6.7
3 Manufacturers understand the volume accordance with the consumer required
- 93.3 6.7
4 Manufacturers understand the quality products accordance with the consumer required
33.3 60 6.7
5 Manufacturers knows the needs and the timing required by consumers.
- 93.3 6.7
6 Infrastructure availability for availability for fresh produce.
86.7 13.3 -
8 Producers know the delivery time to the market.
13.3 86.7 -
9 Producers know the volume of market demand.
26.7 73.3 -
Table 6. The Average Respondents' Opinions on The Improvement of Horticultural Consumption
(Continued) freshness of the product
66.7 33.3 -
11 Regulations availability to support the distribution
6.7 93.3 -
12 Marketing facilities available within easy reach
80 20 -
13 Products always available on the market.
15 Socialization of the health benefits of products
13.3 60 26.7
16 Product available with reasonable
expensive price of product
73.3 26.7 -
average 44.06 51.48 4.46
S. Mulyani et al./Agroindustrial Journal Vol. 1 Issue 1 (2012) 7-14
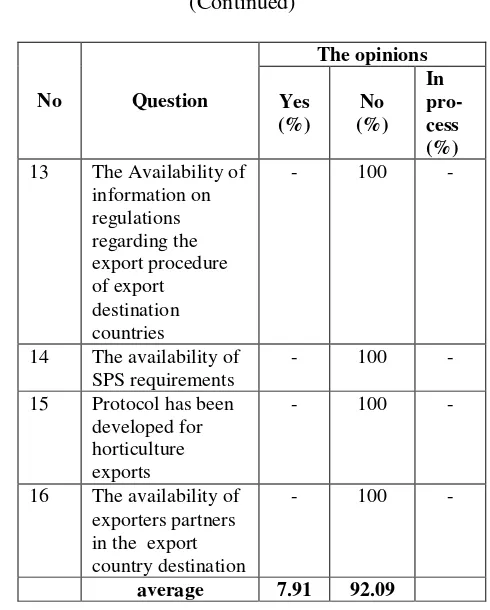
Table 7. The Average of Respondents Opinion in Increasing The Acceleration of Export Commodity
The opinions
No Question Yes
(%)
No (%)
In pro-cess (%) 1 Land availability to
develop export commodities
20 80 -
2 Manufacturers understand the standard of quality of export market
- 100 -
3 Producer know the demand from the country export destinations
66.7 33.3 -
4 Committed exporters - 100 - 5 Exporters
understand the procedure of export of horticultural commodities in each country of
destination
- 100 -
6 Exporters know the quality standards of each country's export destination
- 100 -
7 Exporter provide training to the manufacturers
- 100 -
8 Exporter knows the needs and the timing of horticultural commodities in the country of export destination
- 100 -
9 The availability of infrastructure to facilitate the
distribution of export product
- 100 -
10 The availability of registered packing houses
- 100 -
11 The availability storage area
- 100 -
12 The availability of the adequate transportation facilities
40 60 -
Table 7. The Average of Respondents Opinion in Increasing The Acceleration of Export Commodity
(Continued)
The opinions
No Question Yes
(%)
No (%)
In pro-cess (%) 13 The Availability of
information on regulations regarding the export procedure of export destination countries
- 100 -
14 The availability of SPS requirements
- 100 -
15 Protocol has been developed for horticulture exports
- 100 -
16 The availability of exporters partners in the export country destination
- 100 -
average 7.91 92.09
The campaign and the benefits of the product are expected to increase the consumption. The availability of infrastructure, good transportation and distribution of the product will also support the development of grapes commodity.
CONCLUSSIONS
1. The results shows the average opinion of the respondents who declared compatibility and incompatibility of the program: 1)the development of horticulture 78.88% and 20.00%, 2) the implementation GAP/SOP 68.88% and29.63%, 3) the implementation of supply chain management 59.10% and 40.90%, 4) the implementation of integrated facilities horticulture investment 64.18% and 33.32%, 5)institutions development 19.99% and 79.18%, 6a) increase in consumer horticulture 44.06 % and 51.48%, while 6b) on the acceleration of exports of 7.91% and 92.09%.
2. Based on the implementation of the six pillars of the development program, only four programs: 1) the development of horticulture area, 2) the implementation GAP/SOP, 3) the implementation of supply chain management, and 4) the implementation an integrated facilities horticultural investment that have carried out an average of 67.76% compliance. Two programs, namely 5) institutional development, and 6) increased consumption of horticultural exports in the implementation and acceleration have lower average of 22.99% compliance.
Suggestions
Based on this research, it is suggested that there is a need of continuity in developing and socializing horticulture sustainable development and dissemination. The programs that need to be fostered are: horticulture development program and the increased of horticulture consumption and horticultural exports acceleration.
ACKNOWLEDGEMENT
Our thanks to the Provincial Agriculture Office of Bali which has funded this research.
REFERENCES
Anonymous, 2006. Kebijakan Pembangunan Pertanian Pemerintah Kabupaten Buleleng (Strategi Pengelolaan Pertanian Lahan Kering). Paper presented at the Workshop on Stabilization and Synchronization Primatani, 12-13 July 2006. Buleleng District Government. Bappeda
Anonymous, 2008. Membangun Hortikultura Berdasarkan Enam Pilar
Pengembangan. Directorate General of Horticulture. Department of Agriculture, Jakarta
Anonymous, 2010, Buah Anggur sumber antioksidan. (http://E:/anti aging/ buah anggur sumber anti oksidan) Accessed on October 12, 2010.
Anonymous, 2010. Sistem Pertanian Organik Pada Tanaman Anggur Di Kabupaten Buleleng. Department of Agriculture and Animal Husbandry. Buleleng District Government.
Christopher M, 1998. Logistics and Supply Chain Management: trategies for Reducing Cost and Improving Services. London: Prentice-Hall, Inc.
Irawan, B. 2003. Membangun Agribisnis Hortikultura Terintegrasi dengan Basis Kawasan Pasar. Agro Economic Research Forum. Research Center for Agricultural Economic and Social Development. Bogor Pujawan, IN, 2005. Supply Chain Management.
Guna Widya.