KONSUMSI KALORI DAN PROTEIN
PENDUDUK INDONESIA DAN PROVINSI
Consumption of Calorie and Protein of Indonesia and Province
Survei Sosial Ekonomi Nasional National Socio-Economic Survey Katalog BPS: 3202001
STATISTICS - INDONESIA
Buku 2 Book 2
Berdasarkan Hasil Susenas Maret 2012 Based on Susenas March 2012
2012
KONSUMSI KALORI DAN PROTEIN
PENDUDUK INDONESIA DAN PROVINSI
Consumption of Calorie and Protein of Indonesia and Province
Survei Sosial Ekonomi Nasional National Socio-Economic Survey
Buku 2 Book 2
Berdasarkan Hasil Susenas Maret 2012 Based on Susenas March 2012
2012
KONSUMSI KALORI DAN PROTEIN
PENDUDUK INDONESIA DAN PROVINSI
Consumption of Calorie and Protein of Indonesia and Province
Berdasarkan Hasil Susenas Maret 2012 Based on Susenas March 2012
2012
ISSN: 1979-6250
No. Publikasi/Publication Number: 04210.1209 Katalog BPS/BPS Catalogue: 3202001
Ukuran Buku/Book Size: 29 cm x 21 cm
Jumlah Halaman/Total Pages: xiv + 212 Halaman/Pages Naskah/Manuscript:
Sub Direktorat Statistik Rumah Tangga Sub Directorate of Welfare Statistics Gambar Kulit/Cover Design:
Subdirektorat Publikasi dan Kompilasi Statistik Subdirectorate of Statistical Publication and Compillation Diterbitkan oleh/Published by:
Badan Pusat Statistik, BPS - Statistics Indonesia Dicetak oleh/Printed by:
Boleh dikutip dengan menyebut sumbernya
May be cited with reference to the source
KATA PENGANTAR
Survei Sosial Ekonomi Nasional (Susenas) merupakan salah satu survei yang diselenggarakan oleh BPS. Hasil dari Susenas merupakan data mengenai berbagai aspek sosial ekonomi dan pemenuhan kebutuhan hidup seperti sandang, pangan, papan, pendidikan, kesehatan, keamanan dan kesempatan kerja. Data tersebut sangat dibutuhkan oleh Pemerintah sebagai gambaran proses dan capaian hasil program pembangunan, serta untuk mengetahui seberapa jauh program pembangunan yang diimplementasikan tersebut telah dinikmati oleh berbagai lapisan masyarakat.
Tujuan Susenas adalah mengumpulkan data sosial-ekonomi penduduk diantaranya tentang pendidikan, kesehatan/gizi, perumahan, sosial-budaya, dan konsumsi/pengeluaran rumah tangga yang pengumpulan datanya melalui pendekatan rumah tangga. Seiring dengan meningkatnya frekuensi permintaan data tersebut untuk kebutuhan PDB/PDRB dan penghitungan kemiskinan serta untuk meningkatkan akurasi data, maka pengumpulan data konsumsi/pengeluaran rumah tangga mulai tahun 2011 dilaksanakan setiap triwulan. Susenas Triwulan I dilaksanakan pada bulan Maret, Triwulan II pada bulan Juni, Triwulan III pada bulan September, dan Triwulan IV dilaksanakan pada bulan Desember. Data yang dipublikasikan merupakan hasil dari Susenas Maret 2011 dan Maret 2012.
Hasil Susenas Maret 2012 (Triwulan I) diterbitkan dalam bentuk tiga buku publikasi, yaitu Buku 1 (konsumsi/pengeluaran tingkat nasional), Buku 2 (konsumsi kalori dan protein tingkat nasional dan provinsi), dan Buku 3 (konsumsi/pengeluaran tingkat provinsi). Buku ini merupakan publikasi data keadaan ekonomi penduduk hasil Susenas Maret 2012. Publikasi ini dimaksudkan untuk memberikan gambaran mengenai tingkat konsumsi serta perilaku konsumen di berbagai lapisan masyarakat pada tingkat nasional dan provinsi. Konsumsi penduduk dalam satuan kalori dan protein, serta data hasil Susenas Maret 2011 sebagai data pembanding juga disertakan dalam publikasi ini.
Terbitnya buku ini diharapkan dapat memperkecil kesenjangan antara ketersediaan dan kebutuhan data, khususnya data kesejahteraan rakyat. Kepada semua pihak yang telah ikut berpartisipasi dalam mewujudkan publikasi ini, baik langsung maupun tidak langsung, diucapkan terima kasih.
Jakarta, September 2012
KEPALA BADAN PUSAT STATISTIK REPUBLIK INDONESIA
Dr. Suryamin, M.Sc
PREFACE
The National Socio-Economic Survey (Susenas) is one of the survey carried out by BPS every year. Results from the Susenas are data on various aspects of socio- economic and subsistence such as food, clothing, shelter, education, health, security, and employment. Such data are needed by the Government as an overview of the process and achievements of the development programs, and to find out to what extent national development benefits the various layers of society.
Susenas aimed to gather socio-economic data, among the data were about education, health/nutrition, housing environment, socio-cultural, and household consumption/expenditure, collected through household approach. Along with the increasing frequency of the consumption/expenditure data demand to the needs of GDP and the calculation of poverty and to improve data accuracy, then the collection of data consumption/expenditures beginning in 2011 carried out every quarter. The First Quarterof Susenas held in March, The Second Quarter held in June, The Third Quarter held in September and the Fourth Quarter held in December. Published data are the result of Susenas March 2011 and March 2012.
The results of March 2012 (first quarter) Susenas were published in the form of three volumes, i.e., volume 1 (consumption/expenditure at national level), volume 2 (calories and protein consumption at national and the province level), and volume 3 (consumption/expenditure at province level). This book contains data on socio- economic condition of population resulted from the March 2012 Susenas, this publication meant for providing an overview of consumption level and consumer behavior in various layers of society both at national and province level.
Consumption of residents in units of calories and protein, as well as data from March 2011 Susenas are also presented as a comparison.
Publication of the book is expected to reduce the gap between data availability and needs. We would like on this occasion to extend our deep gratitude to those who have contributed, either directly or indirectly, in the endeavour to realize the publication.
Jakarta, September 2012 BPS – STATISTICS INDONESIA
Dr. Suryamin, M.Sc
Chief Statistician
Buku 2 – Konsumsi Kalori dan Protein Penduduk Indonesia dan Provinsi, Susenas Maret 2012
vii
RINGKASAN / SUMMARY
Publikasi Konsumsi Kalori dan Protein Penduduk Indonesia dan Provinsi hasil Susenas Maret 2012 memberikan gambaran mengenai pola konsumsi penduduk Indonesia. Selain itu, publikasi ini dapat pula menggambarkan tingkat kecukupan gizi penduduk yang digambarkan dalam kecukupan kalori dan protein.
Hasil Susenas Maret 2012 menunjukkan bahwa:
Secara nasional rata-rata konsumsi kalori penduduk Indonesia bulan Maret 2012 masih berada di bawah standar kecukupan, yaitu hanya sekitar 1 852,64 kkal, sedangkan konsumsi protein sudah berada di atas standar kecukupan, yaitu sebesar 53,14 gram protein.
Rata-rata konsumsi kalori penduduk perkotaan lebih rendah dibandingkan penduduk perdesaan, sebaliknya rata- rata konsumsi protein penduduk perkotaan lebih tinggi dibandingkan perdesaan.
Ada penurunan konsumsi kalori dan protein pada tahun 2012 dibandingkan tahun 2011. Penurunan kalori tertinggi terdapat pada makanan dan minuman jadi, yaitu mencapai 38,80 kkal.
The publication of Calorie and Protein Consumption among Indonesian Population and Province from the results of the March 2012 Susenas give an overview about the consumption pattern. This publication was able to give an overview about the level of nutrition adequacy which was presented in the adequacy of calorie and protein.
The result of March 2012 Susenas shows that:
Nationally, the average consumption of calorie in March 2012 has below the adequacy standard, that is, calorie for 1 852.64 kcal.
Meanwhile, average consumption of protein has above the adequacy standard, that is, 53.14 gram.
The average consumption of calorie among urban population is lower than rural population, but on the contrary, the average consumption of protein among urban population is higher than rural population.
There are an decline in calorie and
protein consumption in 2012, as
compared 2011. The most significant
decline can be seen in prepared food
and beverages, i.e.38,80 kkal.
viii
Buku 2 – Konsumsi Kalori dan Protein Penduduk Indonesia dan Provinsi, Susenas Maret 2012 Pada tingkat provinsi, rata-rata konsumsi kalori penduduk di 3 provinsi berada di atas standar kecukupan kalori. Sedangkan 30 provinsi lainnya berada di bawah standar kecukupan kalori. Provinsi dengan konsumsi kalori tertinggi terdapat di provinsi Nusa Tenggara Barat, dan yang terendah terdapat di provinsi Maluku Utara.
Selama periode 2011-2012 telah terjadi perubahan pola konsumsi penduduk yang ditandai dengan penurunan konsumsi kalori dan protein yang berasal dari makanan dan minuman jadi, dan terjadi pula penurunan konsumsi kalori dan protein untuk makanan yang dimasak di rumah.
At the provincial level, the average consumption of calorie among people in 3 provinces is above the adequacy standard of calorie. In 30 other provinces, it is below the adequacy standard. The province with the highest calorie intake found in the province of West Nusa Tenggara, and the lowest was in the province of North Maluku.
During the period of 2011-2012, there
has been a shift in the pattern of
consumption, indicated by the decline
in the consumption of calorie and
protein from prepared food and
beverages, and the decline in
consumption of calorie and protein
from food prepared at home.
Buku 2 – Konsumsi Kalori dan Protein Penduduk Indonesia dan Provinsi, Susenas Maret 2012 ix
DAFTAR ISI / CONTENTS
Halaman Pages
KATA PENGANTAR / PREFACE v
RINGKASAN / SUMMARY vii
DAFTAR ISI / CONTENTS ix
DAFTAR TABEL / LIST OF TABLE x
I. PENDAHULUAN / INTRODUCTION 1.1 Umum / General
1.2 Metode Survei / Survey Method
1.3 Konsep dan Definisi / Concept and Definition
3 3 6 8
II. PENJELASAN TEKNIS / TECHNICAL NOTES 2.1 Konversi Zat Gizi / Nutrient Conversion
2.2 Zat Gizi Kalori dan Protein / Nutrient of Calorie and Protein
17 17 18
III. ULASAN SINGKAT / OVERVIEW OF THE RESULTS 3.1 Standar Kecukupan Konsumsi Kalori dan Protein Adequacy Standard of Calorie and Protein Intake 3.2 Konsumsi Kalori dan Protein pada Tingkat Nasional
Consumption of Calorie and Protein at National Level 3.3 Konsumsi Kalori dan Protein pada Tingkat Provinsi
Consumption of Calorie and Protein at Provincial Level
21 21
22
30
LAMPIRAN A / APPENDIX A: TABEL-TABEL / TABLES 37 LAMPIRAN B / APPENDIX B: KUESIONER VSENP11.M
QUESTIONNAIRE VSENP11.M
149
x
Buku 2 – Konsumsi Kalori dan Protein Penduduk Indonesia dan Provinsi, Susenas Maret 2012
DAFTAR TABEL / LIST OF TABLE
Halaman Pages TABEL
1.1 VARIABEL/KLASIFIKASI, SKOR & KRITERIA DESA 2000
TABLE THE 2000 URBAN/RURAL VARIABLES/CLASSIFICATION, SCORE, AND10
VILLAGE’S CRITERIA
TABEL 3.1
RATA-RATA KONSUMSI KALORI (KKAL) DAN PROTEIN (GRAM) PER KAPITA PER HARI, MARET 2012
TABLE DAILY AVERAGE CONSUMPTION OF CALORIE (KCAL) AND PROTEIN
22
(GRAMS) PER CAPITA, MARCH 2012TABEL 3.2
RATA-RATA KONSUMSI KALORI (KKAL) DAN PROTEIN (GRAM) PER KAPITA SEHARI MENURUT KELOMPOK MAKANAN,
MARET 2011 DAN 2012 26
TABLE DAILY AVERAGE CONSUMPTION OF CALORIE (KCAL) AND PROTEIN (GRAMS) PER CAPITA BY FOOD GROUP, MARCH 2011 AND 2012
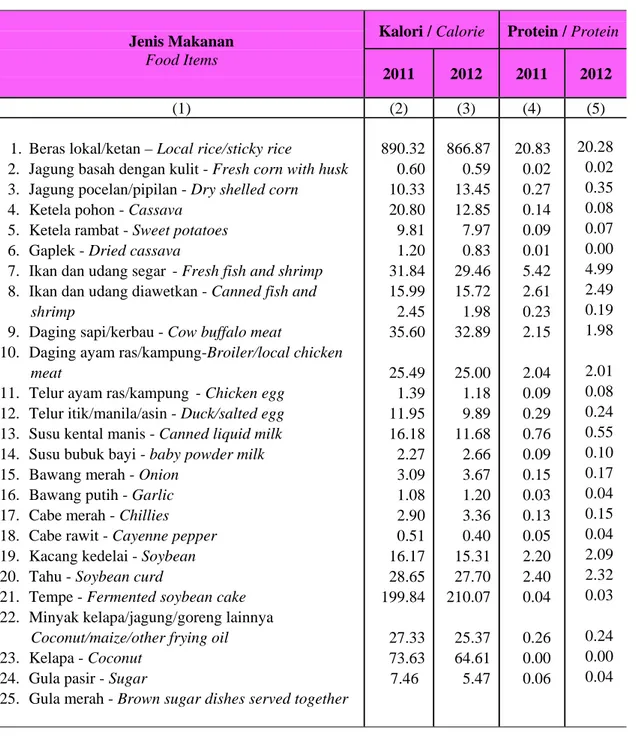
TABEL 3.3
RATA-RATA KONSUMSI KALORI (KKAL) DAN PROTEIN (GRAM) PER KAPITA SEHARI BEBERAPA JENIS MAKANAN,
MARET 2011 DAN 2012 29
TABLE DAILY AVERAGE CONSUMPTION OF CALORIE (KCAL) AND PROTEIN (GRAMS) PER CAPITA FOR SEVERAL FOODS, MARCH 2011 AND 2012
TABEL 3.4.1
RATA-RATA KONSUMSI KALORI (KKAL) DAN PROTEIN (GRAM) PER KAPITA PER HARI MENURUT PROVINSI, MARET 2012,
PERKOTAAN 32
TABLE DAILY AVERAGE CONSUMPTION OF CALORIE (KCAL) AND PROTEIN (GRAMS) PER CAPITA BY PROVINCE, MARCH 2012, URBAN
TABEL 3.4.2
RATA-RATA KONSUMSI KALORI (KKAL) DAN PROTEIN (GRAM) PER KAPITA PER HARI MENURUT PROVINSI, MARET 2012,
PERDESAAN 33
TABLE DAILY AVERAGE CONSUMPTION OF CALORIE (KCAL) AND PROTEIN (GRAMS) PER CAPITA BY PROVINCE, MARCH 2012, RURAL
Buku 2 – Konsumsi Kalori dan Protein Penduduk Indonesia dan Provinsi, Susenas Maret 2012 xi TABEL 3.4.3
RATA-RATA KONSUMSI KALORI (KKAL) DAN PROTEIN (GRAM) PER KAPITA PER HARI MENURUT PROVINSI, MARET 2012,
PERKOTAAN DAN PERDESAAN 34
TABLE DAILY AVERAGE CONSUMPTION OF CALORIE AND PROTEIN
(GRAMS) PER CAPITA BY PROVINCE, MARCH 2012, URBAN AND RURAL
TABEL 3.5
RATA-RATA KONSUMSI KALORI (KKAL) DAN PROTEIN (GRAM) PER KAPITA PER HARI MENURUT PROVINSI, MARET 2011
35
TABLE DAILY AVERAGE CONSUMPTION OF CALORIE (KCAL) AND PROTEIN(GRAMS) PER CAPITA BY PROVINCE, MARCH 2011
TABEL
TABLEA.1
RATA-RATA KONSUMSI KALORI PER KAPITA SEHARI (KKAL)
39 MENURUT KELOMPOK MAKANAN DAN DAERAH TEMPAT
TINGGAL, MARET 2011 DAN 2012
DAILY AVERAGE CONSUMPTION OF CALORIE PER CAPITA (KCAL) BY FOOD GROUP AND URBAN-RURAL CLASSIFICATION, MARCH 2011 AND 2012
TABEL
TABLEA.2
RATA-RATA KONSUMSI PROTEIN PER KAPITA SEHARI (GRAM)
73 MENURUT KELOMPOK MAKANAN DAN DAERAH TEMPAT
TINGGAL, MARET 2011 DAN 2012
DAILY AVERAGE CONSUMPTION OF PROTEIN PER CAPITA (GRAMS) BY FOOD GROUP AND URBAN-RURAL CLASSIFICATION, MARCH 2011 AND 2012
TABEL
TABLEA.3
RATA-RATA KONSUMSI KALORI (KKAL) DAN PROTEIN (GRAM)
107 PER KAPITA SEHARI BEBERAPA JENIS MAKANAN,
MARET 2011 DAN 2012
DAILY AVERAGE CONSUMPTION OF CALORIE (KCAL)AND PROTEIN (GRAM) PER CAPITA FOR SEVERAL FOODS,
MARCH 2011 AND 2012
TABEL
A.4 DAFTAR KONVERSI ZAT GIZI (KALORI DAN PROTEIN)
141
TABLE NUTRIENT CONVERSION TABLE (ENERGY AND PROTEIN)PENDAHULUAN
INTRODUCTION
Buku 2 – Konsumsi Kalori dan Protein Penduduk Indonesia dan Provinsi, Susenas Maret 2012 3 I. PENDAHULUAN / INTRODUCTION
1.1 Umum
Salah satu survei yang diselenggarakan BPS dan sangat dibutuhkan pemerintah sebagai alat monitoring program pembangunan khususnya bidang sosial adalah Survei Sosial Ekonomi Nasional (Susenas). Mulai tahun 2011, pengumpulan data konsumsi/
pengeluaran rumah tangga pada Susenas dilaksanakan triwulanan. Hal ini dilakukan untuk meningkatkan akurasi data yang dihasilkan, selain itu juga karena peningkatan frekuensi permintaan data konsumsi/pengeluaran rumah tangga untuk PDB/PDRB triwulan dan penghitungan angka kemiskinan
Pelaksanaan Susenas 2012 mencakup 300 000 rumah tangga sampel yang tersebar di seluruh provinsi di Indonesia, pada setiap triwulan didistribusikan sampel sebanyak 75 000 rumah tangga. Susenas Triwulan I dilaksanakan pada bulan Maret, Triwulan II pada bulan Juni, Triwulan III pada bulan September, dan Triwulan IV dilaksanakan pada bulan Desember 2012.
1.1 General
The National Socio-Economic Survey (Susenas) is one of survey conducted by BPS which is very considered necessary as examining for development program. Starting 2011, the collection of consumption/expenditure data in Susenas carry out quarterly. It has done to increase the Susenas data accuracy, because the increase of consumption/expenditure data request for quarterly GDP/RGDP and also for the calculation of poor index.
The 2012 Susenas covers 300 000 households sample spread all over Indonesia where each quarter distribute about 75 000 households sample. The First Quarter of 2012 Susenas held in March, the Second Quarter held in June, the Third Quarter held in September, and the Fourth Quarter held in December 2012.
Data hasil pencacahan setiap triwulan dapat disajikan baik untuk tingkat nasional maupun provinsi, sedangkan hasil kumulatif pelaksanaan pencacahan selama empat triwulan, datanya dapat disajikan sampai dengan tingkat kabupaten/kota.
Pengumpulan data Susenas 2012 menggunakan 2 (dua) jenis kuesioner, yaitu
The result from each quarter can produce national and provincial level estimates. Meanwhile, the result of cummulative four quarter, the data can be presented until the district/municipality level.
The 2012 Susenas data collection
use 2 (two) types of questionnaires, namely
Buku 2 – Konsumsi Kalori dan Protein Penduduk Indonesia dan Provinsi, Susenas Maret 2012 4
Kor dan Modul Konsumsi. Hasil pengumpulan data Kor Susenas 2012 tidak dipublikasikan secara triwulanan, namun akan dipublikasikan secara tahunan.
Data konsumsi/pengeluaran yang dikumpulkan pada Susenas 2012 dibagi menjadi 2 (dua) kelompok, yaitu konsumsi makanan dan bukan makanan. Konsumsi/
pengeluaran makanan dirinci menjadi sebanyak 215 komoditas, masing-masing dikumpulkan data kuantitas dan nilainya.
Untuk konsumsi bukan makanan pada umumnya yang dikumpulkan hanya data nilainya, kecuali untuk beberapa jenis pengeluaran tertentu, seperti penggunaan listrik, air, gas, dan bahan bakar minyak (BBM), juga dikumpulkan kuantitasnya.
Core and Module Consumption. The results of Core data collection 2012 Susenas are not published quarterly, but will be published annually.
The 2012 Susenas data collected on 2 (two) groups of consumption, i.e. food and non food consumption. There are 215 items of household food consumption appeared in the questionnaire for each of which data on quantities and values were gathered. For non food consumption items, only value data were collected, except for some consumption items such as electricity, water, gas, and fuel oil for which quantity questions were included.
Seperti Susenas sebelumnya, perangkat data empiris Susenas 2012 juga berguna untuk penelitian penerapan hukum ekonomi atau pengujian hipotesis baru.
Salah satunya hukum ekonomi yang dinyatakan oleh Ernst Engel (1857), yaitu bila selera tidak berbeda maka persentase pengeluaran untuk makanan menurun dengan semakin meningkatnya pendapatan.
Engel menemukan hukum tersebut dari perangkat data survei pendapatan dan pengeluaran. Oleh karena itu data Susenas 2012 juga berguna untuk mendapatkan gambaran tentang kesejahteraan penduduk.
Like the previous Susenas, the 2012 Susenas also provides an empirical consumption data set which may be useful for economic theory application or testing new hypothesis. One useful theory that has already been widely applied is that of Ernst Engel (1857) which stated that, given that taste is unchanged, the percentage of expenditure on food declines as income increases. Engel discovered the law using income and expenditure data set as the basis of investigation. Consequently, the 2012 Susenas data might also be useful to measure the level of population welfare.
Publikasi hasil Susenas Modul Konsumsi 2012 disajikan dalam tiga buku.
Buku 1, Pengeluaran untuk Konsumsi Penduduk Indonesia berdasarkan hasil Susenas Maret 2012, berisi tabel-tabel tingkat nasional, disajikan menurut daerah perkotaan dan perdesaan, memuat rata-rata pengeluaran per kapita sebulan (rupiah) menurut kelompok barang dan daerah
The results of the 2012 Susenas
Consumption Module are published in
three volumes. Book 1, Expenditure for
Consumption of Indonesia based on
March 2012 Susenas, contains tables,
aggregated at national level, distinct
between urban and rural areas, featuring
monthly average expenditure per capita
(rupiahs) by commodity group and urban
Buku 2 – Konsumsi Kalori dan Protein Penduduk Indonesia dan Provinsi, Susenas Maret 2012 5 tempat tinggal bulan Maret 2011 dan 2012
pada Tabel A.1.1, persentase rata-rata pengeluaran per kapita sebulan (rupiah) menurut kelompok barang dan daerah tempat tinggal bulan Maret 2011 dan 2012 pada Tabel A.1.2, rata-rata konsumsi dan pengeluaran per kapita seminggu menurut jenis makanan dan daerah tempat tinggal bulan Maret 2011 dan 2012 pada Tabel A.3.1 s.d Tabel A.3.3, serta rata-rata pengeluaran per kapita sebulan menurut jenis barang bukan makanan dan daerah tempat tinggal bulan Maret 2011 dan 2012 pada Tabel A.4.
rural classification on March 2011 and 2012, see Table A.1.1, percentage of monthly average expenditure per capita by commodity group and urban rural classification on March 2011 and 2012, see Table A.1.2, weekly average consumption and expenditure per capita by type of food and urban rural classification on March 2012, see Table A.2, weekly average consumption and expenditure per capita by type of food and urban rural classification on March 2011 and 2012 see Table A.3.1 to A.3.3 , monthly average expenditure per capita by type of non food and urban rural classification on March 2011 and 2012, see Table A.4.
Buku 2, Konsumsi Kalori dan Protein Penduduk Indonesia dan Provinsi berdasarkan hasil Susenas Maret 2012, berisi tabel-tabel tingkat provinsi dan nasional yang menyajikan data mengenai rata-rata konsumsi kalori (kkal) dan protein (gram) per kapita sehari menurut kelompok makanan dan daerah tempat tinggal, disandingkan dengan data bulan Maret 2011 pada Tabel A.1 dan Tabel A.2, sedangkan pada Tabel A.3 dan Tabel A.4 menurut kelompok makanan dan golongan pengeluaran per kapita sebulan (rupiah).
Book 2, Consumption of Calorie and Protein of Indonesia and Province based on March 2012 Susenas, contains both provincial and national tables show daily average calorie (kcal) and protein (grams) consumption per capita by commodity group and urban-rural classification, juxtaposed with March 2011 data, see Table A.1 and Table A.2, whereas by food groups and monthly expenditure per capita class (rupiahs), see Table A.3 and Table A.4.
Buku 3, Pengeluaran untuk Konsumsi Penduduk Indonesia per Provinsi berdasarkan hasil Susenas Maret 2012 berisi tabel-tabel tingkat provinsi (dibedakan menurut daerah perkotaan dan perdesaan), mengenai persentase penduduk menurut provinsi dan golongan pengeluaran per kapita sebulan pada Tabel A.1, rata-rata pengeluaran per kapita sebulan menurut kelompok barang
Book 3, Expenditure for
Consumption of Indonesia by Province
based on March 2012 Susenas, contains
provincial tables (with urban-rural area)
show percentage of population by province
and monthly expenditure per capita class,
see Table A.1, monthly average
expenditure per capita by commodity group
and urban-rural classification, juxtaposed
with data March 2011, see Table A.2, and
Buku 2 – Konsumsi Kalori dan Protein Penduduk Indonesia dan Provinsi, Susenas Maret 2012 6
dan daerah tempat tinggal, disandingkan dengan data bulan Maret 2011 pada Tabel A.2, dan pengeluaran rata-rata per kapita sebulan beberapa jenis bahan makanan menurut daerah tempat tinggal Tabel A.3.
monthly average expenditure per capita of food items by urban rural classification, see Table A.3.
Perlu dicatat bahwa data yang dimuat dalam ketiga publikasi terbatas hanya untuk memenuhi keperluan yang umum saja berdasarkan hasil pengumpulan data modul konsumsi/pengeluaran. Institusi atau peneliti yang menginginkan analisis yang lebih mendalam, rinci atau data-data kor dapat menggunakan data individu yang berada dalam media komputer atau membuat tabel yang berbeda dengan isi publikasi. BPS membuka peluang bagi keduanya.
Buku publikasi ini merupakan buku ketiga dari tiga buku hasil Susenas Maret 2012. Buku ini terdiri atas dua bab, yaitu Pendahuluan dan Ulasan Singkat. Tabel rinci pada ulasan singkat terdapat dalam tabel lampiran.
It is worth noting that the purpose of the three publications are only meant to fulfill the needs of the general public based on consumption/expenditure module. Those who wish to conduct more profound analysis or need more detailed data (core data) may prefer to work with individual data available in computer media. Others may wish to tabulate differently from those appear in the publication. Statistics Indonesia welcomes both type of data users and will be glad to serve them.
This publication is the third book of the three series of the March 2012 Susenas publications. It consists of two chapters i.e.
Introduction and Overview of the Results.
More detail data could be seen in the appendix tables.
1.2 Metode Survei 1.2.1 Ruang Lingkup
Seperti dijelaskan sebelumnya, Susenas Maret 2012 mencakup 75 000 rumah tangga sampel yang tersebar di seluruh wilayah geografis Indonesia. Hasil Susenas Maret 2012 dapat disajikan baik pada tingkat nasional maupun tingkat provinsi dan dibedakan menurut daerah tempat tinggal (perkotaan dan perdesaan).
1.2 Survey Method 1.2.1 Coverage
As mentioned before, sample size of the March 2012 Susenas is 75 000 households for which sample is selected in order to represent all parts of the country.
It used for obtaining both national and
provincial level estimates, which
independently, independent estimates for
urban and rural, respectively, are also
obtainable.
Buku 2 – Konsumsi Kalori dan Protein Penduduk Indonesia dan Provinsi, Susenas Maret 2012 7 1.2.2 Kerangka Sampel
Kerangka sampel yang digunakan terdiri atas tiga, yaitu:
Kerangka sampel pemilihan tahap pertama adalah daftar wilayah pencacahan (wilcah) SP2010 yang disertai dengan informasi banyaknya rumah tangga hasil listing SP2010 (Daftar RBL1), muatan blok sensus dominan (pemukiman biasa, pemukiman mewah, pemukiman kumuh), informasi daerah sulit/tidak sulit, dan klasifikasi desa/kelurahan (perdesaan/perkotaan).
Kerangka sampel pemilihan tahap kedua adalah daftar blok sensus pada setiap wilcah terpilih.
Kerangka sampel pemilihan tahap ketiga adalah daftar rumah tangga biasa tidak termasuk institutional household (panti asuhan, barak polisi/
militer, penjara, dsb) dalam setiap blok sensus sampel hasil pencacahan lengkap SP2010 (SP2010-C1) yang telah dimutakhirkan menjelang pelaksanaan survei.
1.2.2 Sampling Frame
The sampling frame used consist of three:
Sampling frame for selection of the first stage is list of enumeration area 2010 Population Census (SP2010) with the number of households result from SP2010 listing (RBL1), content of dominant census block (ordinary residential, luxury housing, slum settlements), information difficult/not difficult area, and the classification of village (rural/urban).
Sampling frame for selection of the second stage is a list of census blocks in each selected enumeration areas.
Sampling frame for selection of the third stage is a list of common household does not include institutional household (orphanages, police/military barracks, prison, etc) in each block of the full sample census enumeration SP2010 (SP2010-C1) which has been updated on each before the survey.
1.2.3 Metode Pengumpulan Data
Pengumpulan data dari rumah tangga terpilih dilakukan melalui wawancara tatap muka antara pencacah dengan responden. Untuk pertanyaan- pertanyaan dalam kuesioner Susenas 2012 yang ditujukan kepada individu diusahakan agar individu bersangkutan yang diwawancarai. Keterangan dalam rumah tangga dikumpulkan melalui wawancara dengan kepala rumah tangga, suami/istri kepala rumah tangga atau anggota rumah tangga lain yang mengetahui tentang karakteristik yang ditanyakan.
1.2.3 Procedure of Data Collection
The data collection from the
selected households conducted by face to
face interview between respondents and
enumerator. Questions for individual in
2012 Susenas Questionnaire are for the
relevant individual. Informations in the
household are collected by interviewing the
head of the household or one of the
household member who is familiar with the
household’s characteristics.
Buku 2 – Konsumsi Kalori dan Protein Penduduk Indonesia dan Provinsi, Susenas Maret 2012 8
Referensi waktu survei yang digunakan adalah selama seminggu yang lalu untuk konsumsi makanan, dan sebulan atau tiga bulan yang lalu untuk konsumsi bukan makanan.
The survey reference period is one week before to enumeration date for food consumption and one months or three months for non food consumption.
1.2.4 Pengolahan Data
Sejak tahun 2007, proses pengolahan data Susenas sampai menghasilkan data mentah (raw data) sepenuhnya menjadi tanggung jawab BPS daerah. Hal ini dimaksudkan untuk lebih memaksimalkan kualitas data melalui proses pengecekan data yang lebih dekat ke sumber utamanya.
1.2.4 Data Processing
Since 2007, Susenas data processing to get raw data are conducted fully by Statistics Indonesia regional office.
This is due to maximize the data quality in order to do checking data close to its source.
Proses pengolahan dimulai dengan editing (cek kelengkapan isian, kewajaran, konsistensi) terhadap 72 737 dokumen yang masuk (96,98 persen dari target), dilanjutkan dengan proses data entri untuk menghasilkan data mentah (raw data).
Setelah terbentuk raw data, proses pengolahan selanjutnya dilakukan di BPS RI.
Data processing begins with editing i.e. checking for completeness, contents sensibility and consistency to the 72 737 documents arrived (96.98 percent from the target), then continue with entry data and computer processing to get raw data. The next processing data will be carried out by Statistics Indonesia.
Setelah raw data terbentuk, maka dilakukan pengecekan terhadap data-data pencilan (outlier), antara lain konsumsi kalori per kapita per hari di bawah 1 000 kalori dan di atas 4 500 kalori, selanjutnya data pencilan tersebut dikeluarkan dari proses tabulasi. Total data record hasil Susenas Maret 2012 yang diproses dalam tabulasi tercatat sebanyak 71 138 rumah tangga.
In termed of the raw data, was to undergo checked against outlier data, i.e.
the daily per capita calorie consumption was below 1 000 calories and over 4 500 calories the records for the household is excluded from the file used for tabulation.
Furthermore, the actual sample for the March 2012 Susenas is 71 138 households.
1.3 Konsep dan Definisi 1.3.1 Daerah Tempat Tinggal
Untuk menentukan apakah suatu desa tertentu termasuk daerah perkotaan atau perdesaan dilakukan penghitungan
1.3 Concept and Definition 1.3.1 Urban-Rural Classification
To determine whether a certain
village is either urban or rural a composite
indicator, whose value is based on the
Buku 2 – Konsumsi Kalori dan Protein Penduduk Indonesia dan Provinsi, Susenas Maret 2012 9 skor terhadap tiga variabel potensi desa
yaitu kepadatan penduduk, persentase rumah tangga pertanian, dan akses fasilitas umum (lihat Tabel Variabel/Klasifikasi, Skor dan Kriteria Kota/ Desa 2000).
values of three variables, i.e., population density, percentage of agricultural household and access of public facilities (see The 2000 Urban/Rural Variables/
Classification, Score and Village’s Criteria Table).
1.3.2 Blok Sensus
Blok sensus merupakan wilayah kerja dari sebuah tim petugas lapangan pada Susenas Maret 2012. Blok sensus terpilih sudah ditentukan oleh BPS RI dan terdapat pada Daftar Sampel Blok Sensus (DSBS). Suatu blok sensus memenuhi kriteria sebagai berikut:
(1) Setiap wilayah desa/kelurahan dibagi habis menjadi beberapa blok sensus.
1.3.2 Census Block
Census blocks is an enumeration area, which is generally assigned to one team enumerator in the March 2012 Susenas. Census blocks are selected by Statistics Indonesia and are listed in Census Block List Sample. Every census block must meet the following criteria:
(1) Each village consists of several census blocks.
(2) Blok sensus harus mempunyai batas- batas yang jelas/mudah dikenali, baik batas alam maupun buatan. Batas satuan lingkungan setempat (SLS seperti RT, RW, dusun, lingkungan, dsb.) diutamakan sebagai batas blok sensus bila batas SLS tersebut jelas (batas alam atau buatan).
(3) Satu blok sensus harus terletak dalam satu hamparan.
(2) Each census block should be identifiable by its natural or man-made boundaries, locally formed unit such as neighbourhood association (RT), community association (RW), hamlet, and other local associations are given the first priority to become census block if their boundaries are clear.
(3) One census block must be an integrated
geographical area.
Buku 2 – Konsumsi Kalori dan Protein Penduduk Indonesia dan Provinsi, Susenas Maret 2012 10
Tabel 1.1
Variabel/Klasifikasi, Skor dan Kriteria Perkotaan/Perdesaan 2000
Table The 2000 Urban/Rural Variables/Classification, Score and Village’s CriteriaVariabel/Klasifikasi Skor
(1) (2) Total skor
Skor minimum
Skor maksimum 2
26 1. Kepadatan penduduk/Km2
< 500 500 - 1 249 1 250 - 2 499 2 500 - 3 999 4 000 - 5 999 6 000 - 7 499 7 500 - 8 499 8 500 +
1 2 3 4 5 6 7 8 2. Persentase rumah tangga pertanian
70.00 + 50.00 - 69.99 30.00 - 49.99 20.00 - 29.99 15.00 - 19.99 10.00 - 14.99 5.00 - 9.99 < 5.00
1 2 3 4 5 6 7 8 3. Akses fasilitas umum 0,1,2,...10
A) Sekolah Taman Kanak-Kanak (TK)
Ada atau 2.5 Km
> 2.5 Km
1 0 B) Sekolah Menengah Pertama
Ada atau 2.5 Km
> 2.5 Km
1 0 C) Sekolah Menengah Umum
Ada atau 2.5 Km
> 2.5 Km
1 0 D) Pasar
Ada atau 2 Km
> 2 Km
1 0 E) Bioskop
Ada atau 5 Km
> 5 Km
1 0 F) Pertokoan
Ada atau 2 Km
> 2 Km
1 0 G) Rumah Sakit
Ada atau 5 Km
> 5 Km
1 0 H) Hotel/Biliar/Diskotek/Panti
Pijat/Salon
Ada
Tidak ada
1 0 I) Persentase rumah tangga yang
mempunyai telepon
8.00
< 8.00
1 0 J) Persentase rumah tangga yang
mempunyai listrik
90.00
< 90.00
1 0
Variable/Classification Score
(1) (2) Total score
Minimum score
Maximum score
2 26 1. Population density/Km2
< 500 500 - 1 249 1 250 - 2 499 2 500 - 3 999 4 000 - 5 999 6 000 - 7 499 7 500 - 8 499 8 500 +
1 2 3 4 5 6 7 8 2. Percentage of agriculture household
70.00 + 50.00 - 69.99 30.00 - 49.99 20.00 - 29.99 15.00 - 19.99 10.00 - 14.99 5.00 - 9.99 < 5.00
1 2 3 4 5 6 7 8
3. Access to public facilities 0,1,2,...10 A) Kindergarten
Yes or 2.5 Km
> 2.5 Km
1 0 B) Junior high school
Yes or 2.5 Km
> 2.5 Km
1 0 C) Senior high school
Yes or 2.5 Km
> 2.5 Km
1 0 D) Traditional market
Yes or 2 Km
> 2 Km
1 0 E) Theatre
Yes or 5 Km
> 5 Km
1 0 F) Shopping centre
Yes or 2 Km
> 2 Km
1 0 G) Hospital
Yes or 5 Km
> 5 Km
1 0 H) Hotel/Billyard/Discotheque/
Massage Parlor/Salon
Yes
No
1 0 I) Percentage of household which has
phone
8.00
< 8.00
1 0 J) Percentage of household which has
electricity
90.00
< 90.00
1 0
Buku 2 – Konsumsi Kalori dan Protein Penduduk Indonesia dan Provinsi, Susenas Maret 2012 11 Ada 3 (tiga) jenis blok sensus yaitu:
Blok sensus biasa adalah blok sensus yang sebagian besar muatannya antara 80 sampai 120 rumah tangga atau bangunan sensus tempat tinggal atau bangunan sensus bukan tempat tinggal atau gabungan keduanya dan sudah jenuh.
Blok sensus khusus adalah blok sensus yang mempunyai muatan sekurang-kurangnya 100 orang, kecuali lembaga pemasyarakatan tidak ada batas muatannya. Tempat-tempat yang biasa dijadikan blok sensus khusus, antara lain
- asrama militer (tangsi), dan
- perumahan militer dengan pintu keluar masuk yang dijaga.
Here are 3 (three) types of census block, i.e.:
Ordinary census block contains between 80 to 120 households or either houses, buildings or both.
Specific census block contains at least 100 persons except prison, for which there is no set limit of content. Those usually included in specific census block are:
- army dormitories
- army compounds, the later indicated by guarded entrance.
Blok sensus persiapan adalah blok sensus yang kosong seperti sawah, kebun, tegalan, rawa, hutan, daerah yang dikosongkan (digusur) atau bekas permukiman yang terbakar.
Prepared census block, may contain rice field, farm, swamp, forest or abandoned area.
Blok sensus khusus dan blok sensus persiapan bukan merupakan bagian dari kerangka sampel Susenas Triwulanan
Specific census block and prepared census block are excluded from sampling frame of the Quarter Susenas
Segmen adalah bagian dari blok sensus yang mempunyai batas jelas. Besarnya segmen tidak dibatasi oleh jumlah rumah tangga atau bangunan fisik.
A segment is a part of census block having identifiable boundaries. Segment size is unlimited by a particular number of households or buildings.
1.3.3 Rumah Tangga dan Anggota Rumah Tangga
Rumah tangga dibedakan menjadi dua, yaitu rumah tangga biasa dan rumah tangga khusus.
1.3.3 Household and Member of House- hold
Household consists of two types, i.e., ordinary household and special household.
a. Rumah tangga biasa adalah seorang atau sekelompok orang yang mendiami sebagian atau seluruh bangunan fisik/
sensus, dan biasanya makan bersama dari satu dapur. Makan dari satu dapur adalah
a. The ordinary household is defined as a
person or a group of persons living in a
(physical/census) building or a part of
and usually share the same pot. Sharing
the same pot means that every day’s
Buku 2 – Konsumsi Kalori dan Protein Penduduk Indonesia dan Provinsi, Susenas Maret 2012 12
mengurus kebutuhan sehari-hari bersama menjadi satu. Ada bermacam-macam bentuk rumah tangga biasa, di antaranya:
common needs of the group are managed together as one unit. Examples of ordinary household are:
1) Orang yang tinggal bersama istri dan anaknya;
1) A man or woman who lives together with his or her spouse and children;
2) Orang yang menyewa kamar atau sebagian bangunan sensus dan mengurus makannya sendiri;
2) A person who rents a room or a part of census building and manage his or her own meals;
3) Keluarga yang tinggal terpisah di dua bangunan sensus, tetapi makannya dari satu dapur, asal kedua bangunan sensus tersebut masih dalam satu segmen;
3) A family who lives in two separated buildings, but shared the same pot, provided that both buildings are located in the same segment;
4) Rumah tangga yang menerima pondokan dengan makan (indekos) yang pemondoknya kurang dari 10 orang;
4) A boarding house with not more than 10 boarders;
5) Pengurus asrama, panti asuhan, lembaga pemasyarakatan dan sejenisnya yang tinggal sendiri maupun bersama anak, isteri serta anggota rumah tangga lainnya, makan dari satu dapur yang terpisah dari lembaga yang diurusnya;
5) The household of the manager of a boarding institution when it is separated from institution they manage, e.g., residence hall, dormitory, hospital, prison, orphanage, and the like.
6) Masing-masing orang yang bersama-sama menyewa kamar atau sebagian bangunan sensus tetapi mengurus makannya sendiri- sendiri.
6) Each of a group of persons who rents a room or part of a census building together, but manages his or her meal individually.
b. Rumah tangga khusus adalah (i) orang- orang yang tinggal di asrama, tangsi, panti asuhan, lembaga pemasyarakatan, atau rumah tahanan yang pengurusan kebutuhan sehari-harinya dikelola oleh suatu yayasan atau lembaga, dan (ii) kelompok orang yang mondok dengan makan (indekos) dan berjumlah 10 orang atau lebih.
Rumah tangga khusus tidak dicakup dalam Susenas.
b. Specific household includes (i) people living in dormitory, hostel, residence hall, orphanage, prison, military barracks, and the like. However, a military personnel who lived with his or her family in a barrack but manage his or her own meals separate from that of the barrack, and (ii) people living in boarding houses where the number of boarders is 10 persons and more.
Special household is excluded from the
survey.
Buku 2 – Konsumsi Kalori dan Protein Penduduk Indonesia dan Provinsi, Susenas Maret 2012 13 Anggota rumah tangga adalah semua orang
yang biasanya bertempat tinggal di suatu rumah tangga, baik yang berada di rumah pada saat pencacahan maupun sementara tidak ada. Anggota rumah tangga yang telah bepergian 6 bulan atau lebih, dan anggota rumah tangga yang bepergian kurang dari 6 bulan tetapi bertujuan pindah/akan meninggalkan rumah, tidak dianggap sebagai anggota rumah tangga. Orang yang telah tinggal di suatu rumah tangga 6 bulan atau lebih atau yang telah tinggal di suatu rumah tangga kurang dari 6 bulan tetapi berniat menetap di rumah tangga tersebut dianggap sebagai anggota rumah tangga.
Household member includes each of the persons who form a household regardless of whether he or she is present or temporarily absent at the date of enumeration. However, a household member who is on journey for 6 months or longer, or less than 6 months but intended to move away, is not regarded as household member. On the other hand, a person who has stayed for 6 months or longer, or has stayed for less than 6 months but intends to stay, is regarded as the member of the household.
Pengeluaran rata-rata per kapita adalah biaya yang dikeluarkan untuk konsumsi semua anggota rumah tangga selama sebulan dibagi dengan banyaknya anggota rumah tangga.
Monthly average expenditure per capita of a household is obtained by dividing the number of household members into total consumption expenses of the household.
Konsumsi rumah tangga dibedakan atas konsumsi makanan dan bukan makanan tanpa memperhatikan asal barang dan terbatas pada pengeluaran untuk kebutuhan rumah tangga saja, tidak termasuk konsumsi/
pengeluaran untuk keperluan usaha atau yang diberikan kepada pihak lain.
Household consumption, distinguish- hed between food and non food, is limited to goods and services used for household purposes, omitting those purchased for business or to be given away, regardless of their source or origin.
Pengeluaran untuk konsumsi makanan dihitung selama seminggu terakhir, sedangkan konsumsi bukan makanan dihitung sebulan dan tiga bulan terakhir. Baik konsumsi makanan maupun bukan makanan selanjutnya dikonversikan ke dalam pengeluaran rata-rata sebulan. Angka-angka konsumsi/pengeluaran rata-rata per kapita yang disajikan dalam publikasi ini diperoleh dari hasil bagi jumlah konsumsi seluruh rumah tangga (baik mengkonsumsi makanan maupun tidak) terhadap jumlah penduduk.
The reference period for food
consumption is one week, and for non food
consumption is one month and three months
prior to enumeration. Both food and non
food consumption are tabulated on a
monthly basis for which purpose conversion
may be required. Quantity consumed, or
expenditure there of per capita per month is
obtained by dividing total consumption (or
expenditure) of all households over total
number of persons corresponding to the area
of aggregation.
PENJELASAN TEKNIS
TECHNICAL NOTES
Buku 2 – Konsumsi Kalori dan Protein Penduduk Indonesia dan Provinsi, Susenas Maret 2012 17
II. PENJELASAN TEKNIS / TECHNICAL NOTES
2.1 Konversi Zat Gizi
Sebelum tahun 1996, untuk menghitung besarnya konsumsi gizi hasil Susenas digunakan daftar konversi zat gizi yang berpedoman pada “Daftar Komposisi Bahan Makanan” yang dikeluarkan oleh Direktorat Gizi Departemen Kesehatan R.I. pada tahun 1972 dan tahun 1981. Berdasarkan hasil- hasil penelitian yang terbaru daftar konversi zat gizi tersebut perlu diperbaharui. Maka sejak Susenas 1996 daftar konversi zat gizi yang digunakan untuk menghitung besarnya konsumsi gizi berpedoman pada beberapa sumber, yaitu:
1. Daftar Komposisi Bahan Makanan, Direktorat Gizi - Departemen Kesehatan, 1981;
2. Daftar Komposisi Zat Gizi Pangan Indonesia, Departemen Kesehatan, 1995;
3. Daftar Kandungan Gizi Bahan Makanan (dalam bentuk hasil print- out), Puslitbang Gizi-Bogor, 1996.
2.1 Conversion Of Nutrition Substance
Before 1996, to calculate the consumption of nutrition, Susenas used the conversion list of nutrition substance, referring to “List of Food Composition”
issued by the Directorate of Nutrition Ministry of Health in 1972 and 1981. Based on the recent research, the list should be updated. So, since Susenas 1996, the list of conversion used to calculate the consumption of nutrition refer to some sources, such as:
1. List of Food Composition, Directorate of Nutrition – Ministry of Health, 1981;
2. List of Food Nutrition of Indonesia, Ministry of Health, 1995;
3. List of Nutrition Content of Food (in
the form of print-out paper), Puslitbang
Gizi-Bogor, 1996.
Buku 2 – Konsumsi Kalori dan Protein Penduduk Indonesia dan Provinsi, Susenas Maret 2012 18
Faktor konversi untuk nama makanan jadi yang digunakan dalam Susenas 1996 tidak semuanya tersedia.
Untuk itu dibuat perkiraan dari makanan sejenis yang tersedia konversinya dalam buku referensi 1996. Namun demikian perkiraan konsumsi zat gizi sejak Susenas 1996 tentu jauh lebih baik dibandingkan hasil Susenas sebelumnya yang diperkirakan dengan metode yang sangat kasar.
The conversion factor for the name of prepared food used in Susenas 1996 is not available for all prepared food. Therefore, estimation was made from the same food whose conversion is available in 1996 reference book. However, the estimation of consumption of nutritious substance since Susenas 1996 is better than the results of previous Susenas, which are estimated with a rough method.
2.2 Zat Gizi Kalori dan Protein
Makanan yang dikonsumsi pendu- duk dalam Susenas Maret 2012 (Triwulan I) mengandung banyak zat gizi seperti kalori, protein, karbohidrat dan lemak. Dalam publikasi ini yang disajikan hanya dua zat gizi penting yakni kalori dan protein. Pengguna data yang ingin melihat kandungan konsumsi zat gizi karbohidrat dan lemak dapat menghubungi Subdit Statistik Rumah Tangga, BPS RI.
Tembakau dan sirih dalam Susenas termasuk bahan makanan yang dikonsumsi penduduk, namun karena tidak mengandung kalori dan protein (konversi gizi kalori maupun proteinnya bernilai nol) maka tidak termasuk yang disajikan dalam publikasi ini.
2.2 Nutritious Substance of Calorie and Protein
The food consumed by the people in Susenas March 2012 (First Quarter) contains much nutritious substance such as calorie, protein, carbohydrate and fat. In this publication, there are only two important nutritious substances presented, namely calorie and protein. Users who wish to know the content of other nutritious substances, like carbohydrate and fat, can contact households sub-directorate of statistics, BPS RI.
Tobacco and betel vine (sirih) in
Susenas are regarded as food consumed by
the people. But as they do not contain
calorie and protein (their conversion of
calorie and protein is zero), they are not
included in this publication.
ULASAN SINGKAT
OVERVIEW OF THE RESULTS
Buku 2 – Konsumsi Kalori dan Protein Penduduk Indonesia dan Provinsi, Susenas Maret 2012 21
III. ULASAN SINGKAT / OVERVIEW OF THE RESULTS
Konsumsi kalori dan protein pada tingkat nasional dan provinsi akan diulas pada bab ini. Acuan kecukupan kalori dan protein yang digunakan masih sama dengan tahun- tahun sebelumnya.
3.1 Standar Kecukupan Konsumsi Kalori dan Protein
Salah satu indikator untuk menunjukkan tingkat kesejahteraan penduduk adalah tingkat kecukupan gizi, yang dihitung berdasarkan besarnya kalori dan protein yang dikonsumsi.
Besarnya konsumsi kalori dan protein dihitung dengan mengalikan kuantitas setiap makanan yang dikonsumsi dengan besarnya kandungan kalori dan protein setiap jenis makanan
1), kemudian hasilnya dijumlahkan.
Angka kecukupan konsumsi kalori dan protein penduduk Indonesia berdasarkan Widyakarya Nasional Pangan dan Gizi VIII (2004)
2)menetapkan patokan kecukupan konsumsi kalori dan protein per kapita per hari masing-masing 2 000 kkal dan 52 gram protein.
__________________
1) Menggunakan “Daftar Konversi Zat Gizi” seperti dijelaskan pada Bab II.
2) Hardinsyah dan Victor Tambunan: Angka Kecukupan Energi, Protein, Lemak, dan Serat Makanan, Widyakarya Nasional Pangan dan Gizi VIII, Jakarta, 17-19 Mei 2004, LIPI-Jakarta.
The consumption of calorie and protein at the provincial and national levels will be discussed in this chapter. The reference for adequacy of calorie and protein used is still the same as the previous years.
3.1 Adequacy Standard of Calorie and Protein Consumption
One of the indicators that shows the level of people’s welfare is the level of nutrition adequacy, calculated based on the amount calorie and protein consumed by the people.
The amount of calorie and protein consumption is calculated by multiplying the quantity of each food consumed with the amount of content of calorie and protein of each food
1), then summarizing the results.
The adequacy rate of calorie and protein consumption of Indonesian people based on Widyakarya Nasional Pangan dan Gizi VIII (2004)
2)decided the standard of adequacy of calorie and protein consumption per capita per day for 2 000 kcal and 52 grams of protein.
_________________
1) Use “Conversion List of Nutritious Substance” as explained in Chapter II
2) Hardinsyah dan Victor Tambunan: Angka Kecukupan Energi, Protein, Lemak, dan Serat Makanan, Widyakarya Nasional Pangan dan Gizi VIII, Jakarta, 17-19 Mei 2004, LIPI-Jakarta.
Buku 2 – Konsumsi Kalori dan Protein Penduduk Indonesia dan Provinsi, Susenas Maret 2012 22
3.2 Konsumsi Kalori dan Protein pada Tingkat Nasional
Jika berpedoman pada batas standar kecukupan konsumsi kalori dan protein per kapita per hari, yaitu 2 000 kkal dan 52 gram protein, maka angka nasional rata-rata konsumsi kalori penduduk Indonesia pada tahun 2012 masih berada di bawah standar kecukupan yakni hanya sebesar 1 852,64 kkal.
Sebaliknya rata-rata konsumsi protein sudah berada di atas standar kecukupan yakni sebesar 53,14 gram protein (lihat Tabel 3.1).
3.2 Consumption of Calorie and Protein at The National level
With reference to the adequacy standard of calorie and protein consumption per capita per day of 2 000 kcal and 52 grams of protein, the national average consumption of calorie in Indonesia in 2012 is below the adequacy standard, that is 1 852.64 kcal. In the contrary, average consumption of protein is already above the adequacy standard, that is, 53.14 grams of protein (see Table 3.1).
Tabel
3.1
Rata-Rata Konsumsi Kalori (kkal) dan Protein (gram) per Kapita per Hari, Maret 2012 Table Daily Average Consumption of Calorie (kcal) and Protein (grams) per Capita, March 2012Rincian / Items
Kalori / Calorie Protein / Protein
Perkotaan Urban
Perdesaan Rural
Perkotaan + Perdesaan
Urban + Rural
Perkotaan Urban
Perdesaan Rural
Perkotaan + Perdesaan
Urban + Rural
(1) (2) (3) (4) (5) (6) (7)
1. Makanan dimasak di rumah Food prepared at home
2. Makanan dan minuman jadi Prepared food and
beverages
1 509.64 (82.97 persen)
309.81 (17.03 persen)
1 663.94 (88.25 persen)
221.63 (11.75 persen)
1 587.09 (85.67 persen)
265.55 (14.33 persen)
44.49 (81.80 persen)
9.90 (18.20 persen)
45.94 (88.50 persen)
5.97 (11.50 persen)
45.21 (85.08 persen)
7.93 (14.92 persen)
Jumlah / Total 1 819.45
(100.00 persen)
1 885.57 (100.00 persen)
1 852.64 (100.00 persen)
54.39 (100.00 persen)
51.91 (100.00 persen)
53.14 (100.00 persen)
Sumber: BPS, Susenas Maret 2012 Source: BPS, March 2012 Susenas