PAWEES 2014 International Conference
Sustainable Water and EnvironmentalManagement in Monsoon Asia 30-31 October 2014, Kaohsiung, Taiwan
Predicting Greenhouse Gas Emissions of SRI Paddy Fields under Different
Soil Conditions using Artificial Neural Networks
Chusnul Arif*1, Budi Indra Setiawan1, Yudi Chadirin1, I Wayan Budiasa2, Masaru Mizoguchi3, Junpei Kubota4, Hisaaki Kato4
1
Department of Civil and Environmental Engineering, Bogor Agricultural University, Bogor,
Indonesia
2
Faculty of Agriculture, Udayana University, Bali, Indonesia
3
Department of Global Agricultural Sciences, the University of Tokyo, Japan
4
Research Institute for Humanity and Nature, Kyoto, Japan
ABSTRACT
Conventional paddy field is a major source of greenhouse gas emissions particularly methane and Nitrous Oxide. Increasing CH4 and N2O concentrations in the atmosphere contributes to
global warming. However, it is not easy measured in the fields particularly in Indonesia when the instrumentation is limited. The current study proposes the model to predict CH4 and N2O
emissions using artificial neural network (ANN) with easily measurable inputs such as soil moisture, soil temperature and soil electrical conductivity. To verify the model, two experiments were conducted in the pot and paddy field. The pot experiment was conducted in the greenhouse of Meiji University, Kanagawa Prefecture, Japan from 4 June to 21 September 2012, while the paddy field experiment was conducted in Umejero village, Buleleng district, Bali, Indonesia during first rice season in 2014. In the pot experiment, three irrigation regimes called wet, medium and dry regimes were applied for different pots, while in the paddy field experiment, there were two rice cultivation practices, i.e., conventional and system of rice intensification (SRI) with three different irrigation regimes, i.e., continuous flooding for conventional cultivation, wet and dry regimes for SRI management. The results showed that CH4 and N2O emissions were fluctuated with different soil conditions. Better
prediction with higher R2 was obtained in the paddy field experiment. Since the field experiments were conducted under certain soil and climatic conditions, so they cannot necessarily be generalized. In addition, more field measurements are needed that represented any soil and climatic conditions to rich the observed data, so the model can be trained well under wider interval of soil and climatic conditions.
Keywords: Greenhouse gas emissions, artificial neural networks, paddy fields, soil moisture, soil temperature, soil electrical conductivity
I. INTRODUCTION
Water management of rice production influences the dynamic changes of soil moisture and
temperature that implied on enhancing/reducing soil microbial activities in which their
PAWEES 2014 International Conference
Sustainable Water and EnvironmentalManagement in Monsoon Asia 30-31 October 2014, Kaohsiung, Taiwan
gases i.e. CO2, CH4 and N2O, which are commonly emitted from paddy fields. However, only
two of them, CH4 and N2O, are attracted considerable attention during the last decades
because of their contribution to global warming (Bouwman, 1990; Neue et al., 1990).
Methane (CH4) and nitrous oxide (N2O) gases have potential contributing to global warming
at 23 and 296 times greater than carbon dioxide, respectively (Snyder et al. 2007).
Many research findings have been published regarding CH4 and N2O emission from paddy
fields over the past 25 years both under conventional rice farming with continuous flooding
irrigation and alternative rice cultivation such as System of Rice Intensification (SRI) with
intermittent or non-flooded irrigations (e.g. Akiyama et al., 2005; Cai et al., 1997; Dong et
al., 2011; Husin et al., 1995; Keiser et al., 2002; Li et al., 2011; Minamikawa and Sakai,
2005; Nugroho et al., 1994; Setiawan et al., 2014; Setiawan et al., 2013; Towprayoon et al.,
2005; Tyagi et al., 2010; Zou et al., 2005). There is clear findings that CH4 emission enhance
when anaerobic soil condition is developed under flooded water, conversely, N2O emission
dramatically increase under aerobic condition with non-flooded water in the fields. Recent
studies showed that SRI paddy field with the intermittent wetting-drying irrigation reduced
CH4 emission up to 32% (Rajkishore, et.al, 2013), but N2O emission increased by an
insignicantly 1.5% (Dill, et al., 2013). Hence, SRI paddy fields can used as mitigation option
for rice production.
CH4 gas is produced by methanogens during organic matter decomposition, under an
environment where the oxygen and sulfate are scare. Meanwhile, N2O gas is primarily
produced from aerobic microbial processes, nitrification and denitrification in soil (Mosier et
al., 1996). In fact, CH4 and N2O emissions are not only influenced by water availability (soil
moisture) in the fields but also rice varieties (Husin et al., 1995; Setyanto et al., 2004) and
fertilizer applications (Cai et al.,1997; Nishimura et al., 2004). Different application of water
management and fertilizer affected on soil parameters level such as soil moisture,
temperature, pH, redox potential (Eh) and electrical conductivity (EC) varies at particular
time. CH4 flux varies diurnally with its maximum value occurring in the afternoon when soil
temperature reach peak value (Miyata et al., 2000; Purkait et al., 2007). Higher soil pH was
also observed releasing higher CH4 emission (Babu et al., 2005), but its values reduces as the
soil Eh becomes more negative (Lee et al., 2005; Setyanto and Bakar, 2005; Tyagi et al.,
PAWEES 2014 International Conference
Sustainable Water and EnvironmentalManagement in Monsoon Asia 30-31 October 2014, Kaohsiung, Taiwan
emissions. However, the relationship between those parameters and CH4 and N2O emissions
are very complex and it’s difficult to characterize into deterministic mathematical model.
Commonly, CH4 and N2O emissions are measured manually using closed chamber that is
placed over single/some paddies rice. Then, the gas sample is taken from the chamber
periodically and the gas sampling is analyzed using a gas chromatograph in the lab. However,
even if this method given the results accurately, the method is time consuming and
complicated with more expensive equipments. Setiawan et al. (2013) have developed
interrelationship model between soil moisture (volumetric water content), soil pH and soil
temperature with CH4 and N2O emissions using an artificial neural network (ANN) model,
that producing accuracy with an R2 about 0.70. However, those three soil parameters were measured separately with different sensors. In addition, one of those parameters, soil pH, is
usually measured discontinuously by handheld sensor.
The current study propose ANN model to estimate CH4 and N2O emissions with easily
measurable inputs i.e. soil moisture, soil temperature and soil EC that are measured by single
sensor. The specific objectives of this study were 1) to identify different water irrigation
regimes on CH4 and N2O emissions with SRI management, 2) to develop the model in
estimating CH4 and N2O emissions using ANN model, 3) to characterize greenhouse gas
emissions under different soil parameters.
II. MATERIALS AND METHODS
2.1 Field Experiments
There were two different experiments, i.e., pot and field experiments. The pot experiment
was conducted in the greenhouse of Meiji University, Kanagawa Prefecture, Japan from 4
June to 21 September 2012. The greenhouse was located at 35°36'39.67"N and
139°32'52.38"E, at an altitude of 76 m above mean sea level. Meanwhile, field experiment
was conducted in the paddy field in Umejero village, Buleleng district, Bali, Indonesia during
first rice season in 2014 (6 February – 22 May 2014). The paddy field was located at
PAWEES 2014 International Conference
Sustainable Water and EnvironmentalManagement in Monsoon Asia 30-31 October 2014, Kaohsiung, Taiwan
(a) (b)
Fig.1 Experimental fields: (a) Greenhouse of Meiji University, (b) Paddy field in Bali
In the pot experiment, six pots were used with a Japonica rice variety (Koshihikari). The
diameter of the pot was 25 cm and the height was 30 cm. For the paddy experiment, three
plots were used with different rice cultivation, i.e., conventional and SRI with the same rice
cultivar, Sintanur. The elements of conventional rice farming were 21 days of seedling time,
spacing at 20 x 20 cm2, and using three seeds per hill. For the SRI, the elements were 6 days of seedling time, spacing 30 x 30 cm2, and using single seed per hill.
2.2 Water Management
For the pot experiment, the water level was kept at the soil surface until 20 days after
transplanting. Then, the regime was divided into three regimes, i.e., wet, medium, and dry
regimes. The water level was kept at 0 cm, -5 cm and -10 cm from the soil surface for the
PAWEES 2014 International Conference
Sustainable Water and EnvironmentalManagement in Monsoon Asia 30-31 October 2014, Kaohsiung, Taiwan
Fig.2 Water management regime: a) the pot experiment, b) the paddy field experiment
Meanwhile, for the experiment in the paddy field, the three plots were supplied with different
regimes. The first plot was continuous flooding regime (CF regime) for conventional rice
farming. The ground water level was kept at 2 and 5 cm water depth above the soil surface
from the beginning cultivation period to one week before harvesting, and then the water was
drained until harvesting time. For the second plot was wet irrigation regime (WET regime)
for SRI in which the soil moisture was kept at saturated level or at 0 cm water depth from the
beginning to one week before harvesting, and then the water was drained until harvesting
time. The last plot was dry irrigation regime for SRI (DRY regime) in which the ground
water level was kept at 0 cm water depth from the beginning to 60 days after transplanting,
then the water was drained at -5 cm water depth until one week before harvesting time, and
finally the water was drained until harvesting time.
2.3 Field Measurement
There were three parts of measurements, i.e., soil and weathers parameters, greenhouse gas
emissions and plant growth. Soil parameters to estimate greenhouse gas emissions consisting
of soil moisture, soil temperature and soil Electrical Conductivity (EC). All soil parameters
were measured by 5-TE sensor from Decagon Device Corp at 5 cm soil depth for both the pot
and paddy field experiments. For weather parameters, a Davis weather station consisted of
rain gauge, pyranometer, air temperature, humidity, air pressure, and wind speed and
direction sensors was used in both field experiments. Meanwhile, greenhouse gas emissions
PAWEES 2014 International Conference
Sustainable Water and EnvironmentalManagement in Monsoon Asia 30-31 October 2014, Kaohsiung, Taiwan
greenhouse gas emissions, i.e. methane and nitrous oxide can be analyzed using Gas
Chromatography in which sampling gases were collected using closed chamber with the size
30 cm in diameter and 100 cm in high. Unfortunately, for the paddy field experiment, only
methane emission can be analyzed in the vegetative growth stage. In the paddy field
experiment there were two kinds of chamber box, short and taller ones. The size of short one
was 30 x 30 x 30 cm3, while the taller one was 30 x 30 x 130 cm3. Each chamber box was equipped with the fan to circulate the air inside the box during measurement.
During measurement, the chamber is placed over single paddy rice. After placement of the
chamber (time = 0), the gas sample is taken from the chamber as well as from the ambient.
Then, every 10 minutes, the gas sample is taken from the chamber within 30 minutes. Then,
the sampling gas was analyzed using a gas chromatograph in the lab. The fluxes of the gases
were calculated from temporal increase/decrease of gas concentration inside of the chamber
per unit time. A positive value of the flux indicates gas emission, while a negative value
indicates gas uptake. The total emissions were calculated by integrating the fluxes for the
period of cultivation using Simpson’s role numerical analysis described by the following
equation:
where a and b are time points in the cultivation period (d)
Then, global warming potential calculated based on the following formula (Snyder et al.,
where GWP is global warming potential (g CO2– C equivalent).
2.4 Artificial Neural Network (ANN) Model
Since soil type and climatic condition in the pot and paddy field experiments were totally
different, we developed two kinds of ANN models. The first model was developed for the pot
experiment to find interrelationships between CH4 and N2O emissions with soil moisture, soil
temperature and soil EC. Meanwhile, since there is no N2O gas analyzer for the paddy field
PAWEES 2014 International Conference
Sustainable Water and EnvironmentalManagement in Monsoon Asia 30-31 October 2014, Kaohsiung, Taiwan
The ANN model was constructed based on the model developed previously (Setiawan, et al.,
2013) with some modification and improvement. MS. Excel 2007 with Visual Basic
Application (VBA) and Solver were used to optimize ANN parameters with the objective
function to minimize root mean squared error (RMSE) between measured and calculated
outputs. Then, the characteristic curves of CH4 emission were produced based on the ANN
model.
III. RESULTS AND DISCUSSION
3.1 Methane and Nitrous oxide emissions under different water management
A negative correlation between CH4 and N2O emissions was found in the pot experiment
(Table 1). The dry regime released the lowest amount of CH4, while flux of CH4 in the wet
regime was the highest than others. This was supposed due to the availability of oxygen and
sulfate in the soil under dry regime, thus methanogens, methane producers, should have
limited activity of organic matter decomposition (Bouwman, 1990; Cicerone and Oremland,
1988). On the other hand, dry regime released more N2O gas than that wet regime. It was
indicated that aerobic condition under dry regime promote more microbial processes i.e.,
nitrification and denitrification in soil, in producing N2O. For the mitigation strategy in the
pot experiment, the dry regime was the best among the regimes, however, this regime
produced a grain yield lower than the wet regime.
Table 1. Effects of irrigation regime on GWP in the pot experiment
Parameters
Irrigation regimes
Wet Medium Dry
CH4 (kg/ha/season) 18.32 4.68 -0.56
N2O (kg/ha/season) 3.61 6.86 5.00
GWP (kg/ha/season) 1488.98 2138.50 1467.29
Plant Height (cm) 82.5 ± 2.83a 85 ± 2.83a 81.05 ± 0.64a
Tillers/hill 41 ± 5.66a 27 ± 3.54b 29 ± 4.24b
Root weight (g/hill) 165.58 189.50 214.98
PAWEES 2014 International Conference
Sustainable Water and EnvironmentalManagement in Monsoon Asia 30-31 October 2014, Kaohsiung, Taiwan
Fig.3 Linear correlation between CH4 emission with soil moisture, temperature and EC in the
paddy field experiment
Fig.3 showed CH4 emission that are plotted against a specific independent variable, i.e., soil
moisture, soil temperature and soil EC in the paddy field experiment. It was clear that CH4
emission became higher when soil moisture and soil EC increased, but the relation to soil
temperature was not clear enough. The slope indicated that CH4 was more responsive to soil
moisture changes than that soil EC. However, the values of R2 for all relation were low that indicated CH4 emission is released from the result of complicated process that not depend on
single parameter such as soil moisture or soil EC. Therefore, correlation between CH4 and
among soil parameters should be considered simultaneously.
3.2 Prediction Model
For the prediction model, the ANN model consisted on three nodes inputs with one biased
connection, single hidden layer with three nodes and it’s also connected to bias node, two
PAWEES 2014 International Conference
Sustainable Water and EnvironmentalManagement in Monsoon Asia 30-31 October 2014, Kaohsiung, Taiwan
model with single output and lower numbers data than that the first one gained regression
coefficient nearly 1 (R2≈1) indicated that good agreement between the model with the observed data, thus the proposed method was reliable (Kim et al., 2009). However, it was
difficult to gain higher R2 when the two outputs were used as resulted in the first model. It was probably caused by over estimation when N2O emission was consider as to be output
model since insignificant differences of N2O emission was observed by previous study
(Setiawan, et al. 2013).
(a) (b)
Fig.4 Validation of ANN model: (a) for the pot experiment, (b) for the paddy field
experiment
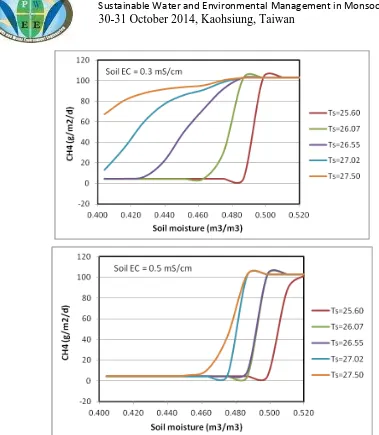
3.3 Characteristics of methane emission in the paddy field experiment
Based on the second ANN model, Fig.5 shows simulated curves presenting CH4 emission
relative to changes in soil moisture, soil temperature and soil EC within the ranges for these
variables that were observed in the paddy field experiment. It was clear that CH4 emission
increase as increasing soil moisture and temperature and decreasing soil EC. At soil EC = 0.3
mS/cm, CH4 emission reach the peak value when soil moisture higher than 0.480 m3/m3. CH4
increase dramatically as shown in Fig. 5 when increasing soil moisture with soil temperature
level on the interval of 25.6oC – 27.5oC. It was probably indicated that when soil moisture increase, the oxygen and sulfate were scare in the soil environment, so methanogens activities
PAWEES 2014 International Conference
Sustainable Water and EnvironmentalManagement in Monsoon Asia 30-31 October 2014, Kaohsiung, Taiwan
Fig. 5 Characteristic curves of CH4 emission with different soil condition in the paddy field
experiment
CONCLUSIONS AND FUTURE WORK
The developed ANN model can be used to estimate greenhouse gas emissions, CH4 and N2O,
using easily measurable inputs such as soil moisture, soil temperature and soil electrical
conductivity. However, the model was valid with higher R2 when it was used only to estimate CH4 emission. In contrast, when the model was used to estimate CH4 and N2O emissions
simultaneously, lower R2 values were gained (less than 0.7). Therefore, since the field experiments were conducted under certain soil and climatic conditions, so they cannot
necessarily be generalized. In addition, more field measurements are needed that represented
any soil and climatic conditions to rich the observed data, so the model can be trained well
PAWEES 2014 International Conference
Sustainable Water and EnvironmentalManagement in Monsoon Asia 30-31 October 2014, Kaohsiung, Taiwan
ACKNOWLEDGMENT
We are grateful to Prof. Kesuke Noborio from Meiji University and his kind students who are
welcome to the authors to do experiments in Meiji University. Also, we are grateful to
Research Institute of Humanity and Nature (RIHN), Japan and GRENE (Green Network of
Excellence) project of MEXT, Japan for generous financial support through collaboration
research with Bogor Agricultural University (IPB). We also thank to Indonesian Government
for supporting fund to attend PAWEES 2014 International Conference through “BOPTN 2014” project.
References
Akiyama, H., Yagi, K., Yan, X.Y., 2005. Direct N2O emissions from rice paddy fields: Summary of available data. Global Biogeochem Cy 19.
Bouwman, A.F., 1990. Introduction, In: Bouwman, A.F. (Ed.), Soil and the Greenhouse Effects. John Wiley & Sons, New York, United States.
Cai, Z.C., Xing, G.X., Yan, X.Y., Xu, H., Tsuruta, H., Yagi, K., Minami, K., 1997. Methane and nitrous oxide emissions from rice paddy fields as affected by nitrogen fertilisers and water management. Plant Soil 196, 7-14.
Cicerone, R.J., Oremland, R.S., 1988. Biogeochemical aspects of atmospheric methane. Global Biogeochem Cy 2, 229-238.
Dong, H.B., Yao, Z.S., Zheng, X.H., Mei, B.L., Xie, B.H., Wang, R., Deng, J., Cui, F., Zhu, J.G., 2011. Effect of ammonium-based, non-sulfate fertilizers on CH4 emissions from a paddy field with a typical Chinese water management regime. Atmos Environ 45, 1095-1101.
Husin, Y.A., Murdiyarso, D., Khalil, M.A.K., Rasmussen, R.A., Shearer, M.J., Sabiham, S., Sunar, A., Adijuwana, H., 1995. Methane Flux from Indonesian Wetland Rice - the Effects of Water Management and Rice Variety. Chemosphere 31, 3153-3180. Keiser, J., Utzinger, J., Singer, B.H., 2002. The potential of intermittent irrigation for
increasing rice yields, lowering water consumption, reducing methane emissions, and controlling malaria in African rice fields. J Am Mosquito Contr 18, 329-340.
Kim, H.K., Jang, T.I., Im, S.J., Park., S.W., 2009. Estimation of irrigation return flow from paddy fields considering the soil moisture. Agr Water Manage 96, 875–882.
Li, X.L., Yuan, W.P., Xu, H., Cai, Z.C., Yagi, K., 2011. Effect of timing and duration of midseason aeration on CH4 and N2O emissions from irrigated lowland rice paddies in China. Nutr Cycl Agroecosys 91, 293-305.
Minamikawa, K., Sakai, N., 2005. The effect of water management based on soil redox potential on methane emission from two kinds of paddy soils in Japan. Agr Ecosyst Environ 107, 397-407.
Mosier, A.R., Duxbury, J.M., Freney, J.R., Heinemeyer, O., Minami, K., 1996. Nitrous oxide emissions from agricultural fields: Assessment, measurement and mitigation. Plant Soil 181, 95-108.
PAWEES 2014 International Conference
Sustainable Water and EnvironmentalManagement in Monsoon Asia 30-31 October 2014, Kaohsiung, Taiwan
production, In: Bouwman, A.F. (Ed.), Soil and the Greenhouse Effect. John Wiley & Sons, New York, United States, pp. 457-466.
Nugroho, S.G., Lumbanraja, J., Suprapto, H., Sunyoto, Ardjasa, W.S., Haraguchi, H., Kimura, M., 1994. Effect of Intermittent Irrigation on Methane Emission from an Indonesian Paddy Field. Soil Sci Plant Nutr 40, 609-615.
Setiawan, B.I., Imansyah, A., Arif, C., Watanabe, T., Mizoguchi, M., Kato, H., 2014. SRI paddy growth and ghg emissions at various groundwater levels. Irrig Drain.
Setiawan, B.I., Irmansyah, A., Arif, C., Watanabe, T., Mizoguchi, M., Kato, H., 2013. Effects of Groundwater Level on CH4 and N2O Emissions under SRI Paddy Management in Indonesia. Journal of Taiwan Water Conservancy 61, 135-146.
Snyder, C.S., Bruulsema, T.W., Jensen, T.L., 2007. Best Management Practices to Minimize Greenhouse Gas Emissions Associated with Fertilizer Use. Better crops 19, 16-18. Towprayoon, S., Smakgahn, K., Poonkaew, S., 2005. Mitigation of methane and nitrous
oxide emissions from drained irrigated rice fields. Chemosphere 59, 1547-1556.
Tyagi, L., Kumari, B., Singh, S.N., 2010. Water management - A tool for methane mitigation from irrigated paddy fields. Sci Total Environ 408, 1085-1090.