TABLE OF CONTENT
1.1 The Background of the Problem ...1
1.2 The Scope of the Problem...5
1.3 The Formulation of the Problem...5
1.4 The Hypothesis ...6
1.5 The Assumption ...6
1.6 The Purpose of the Research...7
1.7 The Definition of the Key Terms...7
1.8 The Significance of the Research ...7
1.9 Research Method ...8
1.9.1 Research Method and Design ...8
1.9.2 Population, Setting, and Sample of the Research. ...8
1.9.3 Data Collection Method, Data Analysis, and Data Interpretation. ...9
CHAPTER II
2.6.1 Approaches to Writing Measurement ...29
2.6.2 Scoring System ...30
2.7 Relationship between the First Language and the Second/ Foreign Language Learning ...31
2.8 Relationship between Reading Fiction and Writing Achievement...34
CHAPTER III
RESEARCH METHOD...42
3.1 The Research Method...42
3.2 The Research Design...43
3.3 The Population, Setting, and Sample of Research...44
3.3.1 Population and Setting...44
3.3.2 Sampling and Sample...46
3.4 The Research Instrument...47
3.4.1 Validity and Reliability of the Instruments...48
3.4.2 Try out Result...51
3.4.2.1. The Try out Result of Reading Comprehension Test...51
3.4.2.2. The Try out Result of Writing Narrative Test...52
3.5 The Data Analysis...52
4.1.1 Data Description of Students’ Reading Comprehension of Indonesian Fiction...59
4.1.2 Data Description of Students’ Writing Ability in Writing Narrative Text...65
4.2 Correlational Analysis...68
4.3 Testing Hypothesis...73
4.4 Discussion...74
CHAPTER V CONCLUSIONS, LIMITATIONS OF THE STUDY, AND SUGGESTIONS...79
5.1 Conclusions...79
5.2 Limitations of the Study...80
5.3 Suggestions...81
LIST OF TABLES
Table 3.1 Number of Population...46
Table 4.1 The Scores of Social Class Students...60
in Reading Comprehension of Indonesian Fiction...60
Table 4.2 The Scores of Science Class Students ...60
in Reading Comprehension of Indonesian Fiction...60
Table 4.3 Descriptive Statistic of Sample...62
in Reading Comprehension of Indonesian Fiction...62
Table 4.4 Distribution Frequency of Students’ Reading Comprehension Scores .63 Table 4.5 Writing Ability of Social Class...65
Table 4.6 Writing Ability of Science Class ...65
Table 4.7 Descriptive Statistic of Students’ Writing Ability of Narrative Text....67
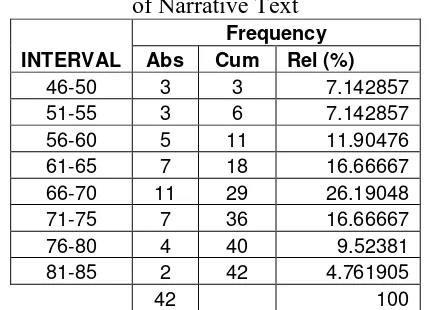
Table 4.8 Distribution Frequency of Students’ Writing Ability...67
of Narrative Text...67
Table 4.9 Manual Calculation to Find Correlation ...69
Table 4.10 SPSS version 14.0 Output of Correlation 3 ...71
Table 4.11 Male Students’ Reading Comprehension of Indonesian Fiction...75
LIST OF FIGURES
Figure 2.1 The Relationship of Reading, Writing and Talking
in a Literacy-Based Curriculum (Kern, 2000) ...36
Figure 3.1 The Research Design ...44
Figure 3.2 Random Sampling Techniques...47
Figure 3.3 The Interpretation of Correlation Coefficient...55
Figure 3.4 Design of the Research Procedure...57
Figure 4.1 Bar Chart of Frequency Distribution ...63
of Students’ Reading Comprehension Figure 4.2 Good Reader ...64
Figure 4.3 Bar Chart of Frequency Distribution of Students’ Writing Scores...67
Figure 4.4 The Scattergram of the Distribution of Scores ...68
LIST OF APPENDIXES
Appendix 1 Composition Profile ...89
Appendix 2 The Pattern and the Location (Map) of the Research Setting ...90
Appendix 3 Reading Comprehension Test ...91
Appendix 4 Writing Narrative Test ...94
Appendix 5 A Detailed Scoring System of Reading Comprehension Test ...95
Appendix 6 Answer Keys of Reading Indonesian Fiction...96
Appendix 7 List of Students’ Absences in Trying out (XI IPS 2)...97
Appendix 8 List of Students’ Absences in Trying out (XI IPA 1) ...98
Appendix 9 The Result of Reading Comprehension (Try out) ...99
Appendix 10 SPSS Version 14.0 Out Put of Reading Comprehension Result (Try out) ...100
Appendix 11 The Analysis of Writing Test Try Out ...101
Appendix 12 SPSS Version 14.0 Out Put of Writing Test Result (Try out) ...102
Appendix 13 Detailed Score of Students’ Reading Comprehension of Indonesian Fiction ...103
Appendix 14 Detailed Score of Writing English Narrative Text...104
Appendix 15 Critical Values of the Pearson Product Moment Correlation Coefficient...105
Photo Collection of the Research...107 Some Examples of Students’ Reading Test Result
Some Examples of Students’ Writing Test Result
Surat Izin Mengadakan Penelitian Surat Keterangan
CHAPTER I
INTRODUCTION
This chapter presents introductory parts of this thesis. The parts are the background of the problem, the scope of the problem, the formulation of the problem, the hypothesis, the assumption, the purpose of the research, the definition of the key terms, the significance of the research, and research method. This chapter shares issues about the research problem.
1.1 The Background of the Problem
involves transforming or reworking information, which is much more complex than writing as telling (Myles, 2002).
The difficulty in writing has been becoming a serious problem faced by students. It is caused by some reasons as stated by Sugiharto (2007):
The undetected problem that the students are facing in writing is that they are often not familiar with the convention of written language. That is, they have not yet developed a feel of convention that strictly governs the use of written language. The unfamiliarity with convention often becomes the main reason why students find it hard to express their ideas in a written form. Consequently if asked to write, their writing is characterized with typical spoken language features, which is hardly acceptable in writing.
The reasons of the difficulty make objective of the teaching writing hard to achieve. It means that teaching writing is still considered unsuccessful. It is in line with Lengkanawati‟s (1999) claims that the process of teaching and learning English, particularly writing in this case, in Indonesia is still facing many problems related to the students‟ learning outcome which is still considered as
unsuccessful. It is accordance with Sadtono (1997) who states that eventhough English has been taught for six years, due to many reasons the result of teaching writing is still unsatisfactory.
In order to achieve the objective of teaching writing, relevant language inputs are needed. Therefore,
Krashen continues, “Writing competence derives from large amounts of self -motivated reading for interest and or pleasure. It is reading that gives the writer the „feel‟ for the look and texture of reader-based prose”.
This horizon can be inferred that “one of the most viable and less tedious ways is to expose students to reading -- particularly light reading or reading for pleasure. This is a sort of recreational reading with assorted topics that students find enjoyable” (Sugiharto, 2007). Parkinson and Thomas (2000) confirm, “Millions of people do or probably always will study, and read for pleasure, texts originally written in foreign language they have never studied, using translations in their, the readers‟, native language”.
Reading for pleasure can be obtained from reading fiction. Reading fiction is one of the ways to motivate chidren or students to have reading habit since it can entertain readers. “Children want to read and write fiction. Of all the genres,
fiction is usually their favorite” (Graves, 1994). In addition, reading fiction is involved as one of the Standard Competence of Bahasa Indonesia Subject for Senior High School students based on School-Based Curriculum 2007.
these indicate the importance of novel of all literary genres at the time and perhaps nowadays as well.
The novel is included into narrative texts (Hawthorn, 2001) since the generic structure and language features of narrative texts are included in novel. Logically, reading novel mean reading and learning narrative texts. Wolfe (www.englishcompanion.com) states that narrative texts, e.g., novels, also help us to understand how other texts work by contrasting the different types through the study of different texts and how they work and are made. He continues, “Narrative fiction often provides the only encounter with the imagination during the course of the school day; in this one respect, teaching such texts is vital”
In fact, the writer‟s preliminary observation and informal interview shows
that some students in Indonesia only like reading Indonesian novels, and they almost never read English novel because they said that it is hard to comprehend English novels. Reading Indonesian novel has become the students‟ hobbies
recently. Some of popular novels read by the students are Ayat-Ayat Cinta, Ketika Cinta Bertasbih, Laskar Pelangi, and so on. Meanwhile, for reading English
novels, the students only read the translated versions, such as Harry Porter and so forth. The preliminary informal interview concludes that those who like reading Indonesian novel, they also get better scores in writing English narrative texts.
the strategies, whether good or deficient, from their first language to their second language”. Furthermore, Cameron (2001) argues, “Teaching reading and writing can utilize any transferable knowledge and skills from first language literacy”.
Another opinion is:
When frequently exposed to reading of any kind -- be it novels, comics, newspapers, academic journals -- in a pleasurable way, readers unconsciously acquire the language of writing (e.g., grammar, vocabulary, spelling), which will become necessary components for writing (Sugiharto, 2007).
Based on the phenomenon above, this study is conducted to answer the problem whether there is a correlation between students‟ reading comprehension of Indonesian fiction and their writing ability of English narrative texts.
1.2 The Scope of the Problem
In this study, of all kinds of fictions, the researcher focuses on novel. Novel is selected because in the researcher‟s preliminary observation and informal
interview in some schools reveal that most students like novel better than other kinds of fiction. It is also based on Moretti‟s claim quoted in Hawthorn (2001) that the novel is the most important genre of all literary genres. Moreover, Akyel and Yalcin (1990 cited in Parkinson and Thomas, 2000) confirm that the most effective literary form for helping high school students develop their linguistic skills and cultural awareness is the novel.
1.3 The Formulation of the Problem
Is there any correlation between students‟ reading comprehension of Indonesian fiction and their writing ability of English narrative texts?
1.4 The Hypothesis
Hypothesis can be stated in two kinds: alternative hypothesis and null hypothesis. In this thesis, hypothesis is better stated in both alternative hypothesis and null hypothesis in order to combine different reasons of using it (Arikunto, 2007).
The alternative hypothesis is there is correlation between students‟ reading comprehension of Indonesian fiction and their writing ability of English narrative texts. Alternative hypothesis is stated based on the previous findings or literature of the second chapter, and the researcher beliefs. (Arikunto, 2007)
It could be hypothesized that there is no correlation between students‟ reading comprehension of Indonesian fiction and their writing ability of English narrative texts. This null hypothesis is formulated in order to get precise statistical testing (Gay, 1987) by using a two-tailed test at 0.05 level of significance to reject it. “We use the null hypothesis and try to reject it. If we are able to reject the null hypothesis, we have support for the alternative hypothesis” (Hatch and Farhady, 1982).
1.5 The Assumption
most of the languages have the same patterns. Another assumption is that reading scientific material contribute to writing achievement.
1.6 The Purpose of the Research
The main purpose of this research is to answer the problem whether there is a correlation between students‟ reading comprehension of Indonesian fiction and writing ability of English narrative texts. It is appropriate with Gay‟s (1987) opinion, “A purpose of a correlational study may be to determine relationships between variables, or to use relationships in making predictions”.
1.7 The Definition of the Key Terms
“The introduction also includes operational definition of terms used in the
study which do not have a commonly known meaning‟ (Gay, 1987). There are some key terms in the present research that need explanatory:
a. Reading comprehension of Indonesian fiction means the result of the reading test about Indonesian fiction
b. Fiction means novel or story, fairy tales read by second grade students of SMA N 2 Bandung.
c. Writing ability of English narrative texts means the result of writing narrative test in English.
1.8 The Significance of the Research
researchers. First, the result of the study is important in terms of providing English teachers with evidence that Indonesian fiction (novel/story) could be a learning media in reading and writing activities for successful implementation of 2007 curriculum in their class. Second, the students can develop their hobbies, especially in reading Indonesian novel while learning English. The last significance is it could give contribution to other researchers and whoever is interested in this problem. Meanwhile, theoretical input of the research is that it might give some contribution to the development of the knowledge, especially in language teaching theories.
1.9 Research Method
1.9.1 Research Method and Design
The method of the research applies quantitative method using correlational study. The correlational study includes an ex-post facto design (Gay, 1987). The design of the research has two quantitative variables. They are reading comprehension of Indonesian fiction as variable X and Writing ability of English narrative text as variable Y. For detail explanation, it can be explored in the section 3.1 and 3.2.
1.9.2 Population, Setting, and Sample of the Research.
and the other half as the representative of social class that includes eleven girls and ten boys. Further explanation is presented in the section 3.3.
1.9.3 Data Collection Method, Data Analysis, and Data Interpretation.
Data collection method in this research is through the tests. There are two kinds of test to gain the data. They are a reading comprehension test, a writing narrative test. The data is analyzed by using statistical analyses, Pearson Product Moment, in order to measure the strength of the relationship. The Pearson Product Moment is used since the data in the form of interval. The data is calculated by using three kinds of computations. Manual calculation, Microsoft Excel computation, and SPSS version 14.0 calculation. The data can be interpreted after the value of the observed r is consulted to the value of the critical r (r table) at 0.05 level of significance. Data can also be interpreted by using table of interpretation. For more description, it can be explained in the section 3.4, 3.5, and 3.6.
CHAPTER III
RESEARCH METHOD
The previous chapter has explained the literature related to this research, including reading fiction, reading comprehension, reading comprehension assessment, teaching writing narrative text, writing assessment, and the relationship between reading fiction and writing achievement. Then, this chapter explores some significant parts of the research method. It includes research design, population, setting, and sample, research instruments, data analysis method, data interpretation, and research procedures. It provides a guideline to conduct the research.
3.1 The Research Method
The research is conducted by using a quantitative method in a correlational study. Gay (1987) claims, “A correlation study describes in quantitative terms the degree to which variables are related”. Correlational study is appropriate way to
answer the research question whether there is a correlation between students’ reading comprehension of Indonesian fiction and their writing ability of English narrative texts. Thus, all correlational studies use quantitative method.
“Correlational research involves collecting data in order to determine
obtained near 00, two variables are not related. Gay (1987) continues, “Correlational studies provide an estimate of just how related two variables are”.
In other word, it cannot infer the cause-effect relationship between two variables. The research method cannot be separated with a research design, it will be discussed then.
3.2 The Research Design
The design of the research is ex-post facto. As Hatch & Farhady (1982) say, “Ex-post facto designs are often used when the researcher does not have control over the selection and manipulation of the independent variable….correlation designs are the most commonly used subset of ex-post facto designs”. Then, Kral (1996) adds:
…We may use the ex-post facto strategy when we wish to investigate the influence of variables like home environment, sex, motivation, intelligent, and parental reading habits. These are characteristics that a subject possesses before the study begins. As researchers, we have no direct control of these variables and can only try to determine their incidence on observed consequence. Although this method lacks control, it is useful in our field because it can supply relevant information for educational decision-making.
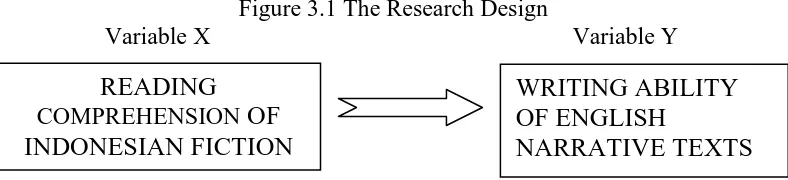
There are two quantitative variables includes in this research. They are reading comprehension of Indonesian fiction as variable X and Writing ability of English narrative texts as variable Y. As Gay (1987) explicitly states, “Relationship studies typically investigate a number of variables believed to be related to a major, complex variable such as achievement”. To make it easy to
Figure 3.1 The Research Design
Variable X Variable Y
The design of the research shows the direct relationship between two variables. The design will be applied to population, setting, and sample of research as explained then.
3.3 The Population, Setting, and Sample of Research
3.3.1 Population and Setting
“A population is the largest class to which we can generalize the results of an investigation based on a subclass. The population of interest (or target population) will vary in type and magnitude depending on the aims and circumstances of each different study or investigation” (Woods et al., 1985).
Arikunto (1993) argues that a population is the entire subjects of the research. When a researcher wants to investigate all the elements, which is the area of the research, the research is as population research. “The description of the population
should indicate its size and major characteristics, such as age, grade level, ability level, and socioeconomic status” (Gay, 1987). The population and setting of the research are second grade students in SMA N 2 Bandung. The size or number of population is 423 students. They consist of 203 males and 220 females. They are around 16-18 years old. They included into clever students since they are accepted in the school based on their high marks of National Final Examination in junior
READING COMPREHENSION OF INDONESIAN FICTION
WRITING ABILITY OF ENGLISH
high school. Moreover, they are form different socioeconomic status includes form low to high status.
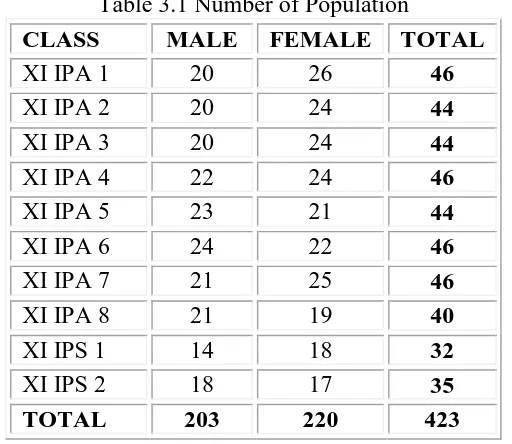
the researcher, the group to which she or he would like the result of the study to be generalizable”. Therefore, they were deserved to be researched in this study. To make it clear, the number of population is shown in the following table:
Table 3.1 Number of Population
CLASS MALE FEMALE TOTAL
XI IPA 1 20 26 46
XI IPA 2 20 24 44
XI IPA 3 20 24 44
XI IPA 4 22 24 46
XI IPA 5 23 21 44
XI IPA 6 24 22 46
XI IPA 7 21 25 46
XI IPA 8 21 19 40
XI IPS 1 14 18 32
XI IPS 2 18 17 35
TOTAL 203 220 423
Since the number of population was large enough to be researched, the researcher chose some samples through appropriate sampling techniques as the representative of the population. As Fraenkle and Wallen (1993) state that sample is “the group on which information is obtained, preferably selected in such a way that the sample represents the larger group from which they were selected”. It is
explored then.
3.3.2 Sampling and Sample
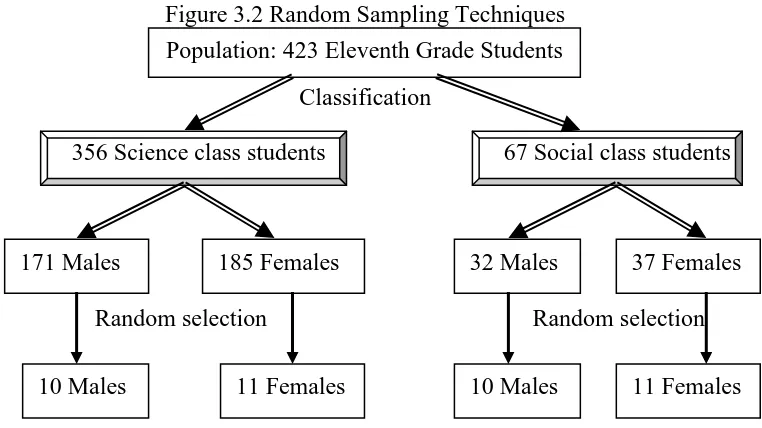
Random sampling is used to take the sample. “Random sampling is the best single way to obtain a representative sample” (Gay, 1987). It is used by
major and gender. The sample of this research included 42 students of all classes. 21 students were the representative of science class that consist of eleven girls and ten boys and the other half were the representative of social class that also consist of eleven girls and ten boys. To make it easier to comprehend, it is shown in the following figure:
Figure 3.2 Random Sampling Techniques
Classification
356 Science class students 67 Social class students
Random selection Random selection
It is in line with Gay’s (1987) opinion that a minimum of 30 subjects is generally recommended for a correlational studies.
The sample, then, is given some instruments to get a data as described below.
3.4 The Research Instrument
The research instrument is the method used in gaining the data. The instrument or data collection method in this research is test. Test is defined as a means of measuring the knowledge, skill of an individual or group (Gay, 1987).
Population: 423 Eleventh Grade Students
171 Males 185 Females 32 Males 37 Females
There are two kinds of tests used in this study: a reading comprehension test and a writing narrative test.
Reading comprehension test has a function to know the comprehension of the students in reading Indonesian fiction. The test had two parts; they are the story written in Indonesian story under the title “Kisah Seorang Kakak dan Adik” and questions are in English. The story consists of 1286 words. The story was chosen since it was considered more appropriate to the almost entire population and sample. It also included into the inspiration story that gives indirect lesson to the readers. Then, the students had to answer the 20 open-ended questions in English in 60 minutes (see Appendix 3).
Meanwhile, writing test was to get the data about writing ability of English narrative text. The test was about asking students to writes an essay in narrative, since story is commonly in the form of narrative. The students were free to decide their own titles of essay. They had to write it in 75 minutes (see Appendix 4).
3.4.1 Validity and Reliability of the Instruments
“Validity refers to the appropriateness, meaningfulness, and usefulness of
the inferences a researcher makes” based on the data (Fraenkle and Wallen, 1990).
Moreover, Weir (1990) defines validity as “what intended to measure”. It is in line
with Gay’s (1987) opinion that validity means “the degree to which a test
measures what it is supposed to measure”. Mean while, reliability refers to “the
appropriate with Gay’s (1987) opinion that reliability means “the degree to which
a test consistently measures whatever it measures”.
The validity and reliability of the instruments were focused on searching quality research through some ways. First, all instruments were consulted to the writer’s advisors to get content validity, as Gay (1987) clearly states, “Content
validity is determined by expert judgment”.
Second, the instruments were also tried out first to know its validity and its reliability to some students in other school which has the same characteristics with the population. The result of trying out indicated that all questions in reading comprehension test and writing test could be comprehended by the students. No questions asked by the students about them. After that, the range of students’
scores are quite wide. “If the students have a wide range of ability, test reliability
will increase” (Hatch and Farhady, 1982).
Fourth, direction for scoring was used in evaluating of the result of the test (See Appendix 1). As Gay (1987) states, “Specification of condition of
administration, directions for scoring, and guideline of interpretation are important characteristics of standardize test”.
Sixth, reading comprehension test had many items of questions to make more reliable. There were 20 questions of reading comprehension test of Indonesian fiction. As Hughes (1991) confirms, “the more items that you have on
test, the more reliable test will be”.
Seventh, reading comprehension test of Indonesian fiction and writing test had provided clear and explicit instruction to get the reliability of the instruments. It is in line with Hughes’ (1991) argument that one of the ways to get reliability
instrument is providing clear and explicit instructions both written and oral instructions”.
Eighth, it is provided a detailed scoring key of the test to get reliable data (Hughes, 1991). Both reading comprehension test and writing test had scoring system to make data more objective. A detailed scoring system of reading comprehension test can be seen in Appendix 5 and a detailed scoring key of reading comprehension test can be seen in Appendix 6. Meanwhile, a detailed scoring system of writing test is shown in appendix 1 and there is no scoring key of writing test since students were asked to write a narrative text in the free title.
Last, tester and scorers did not recognize the students to avoid the subjective scoring. Since tester is the researcher himself who does not teach at the school or setting of the research. Hughes (1991) states, “Scorers inevitably have expectations of candidates that they know, except in purely objective testing, this will affect the way tat they score”. “Test objectivity means that an individual’s
Therefore, it can be inferred that the instruments that are used in this research are valid and reliable. Especially for result of trying out, it can be performed as follows.
3.4.2 Try out Result
Trying out has function to validate the instruments of the research. It was done to some students in another setting that was SMA Kartika Siliwangi Bandung. The school is also included the favorite private school in Bandung. It was chosen because it has the same characteristics with the population and setting of the research. There were also has social and science class that consist of male and female students. XI IPS 2 and XI IPA 1 class are taken randomly be tested as trying out the instruments. There were 38 students of XI IPS 2 class but 31 students presented at the time (see Appendix 7), and there were 29 students of XI IPA 1 but 26 students presented at the time (see Appendix 8). The result of trying out can be explained one by one as follows:
3.4.2.1. The Try out Result of Reading Comprehension Test
The try out result indicates that the students can comprehend all of the text of Indonesian fiction and the questions in reading comprehension test. No questions asked by the students about them. The answers of the students are almost different among them since the questions are in the simple open-ended answer. Time limit of the test was enough for the students. After that, the range of students’ scores are quite wide from 40 to 98. “If the students have a wide range
there is no changing of this instrument at all. The result of reading test try out and its descriptive statistic can be seen in Appendix 9. The score validity of the result try out of reading Indonesian fiction test is shown in appendix 10.
3.4.2.2. The Try out Result of Writing Narrative Test
The try out result shows that the students can comprehend the instruction in writing test, since there is only an instruction to write free title of narrative text. No questions asked by the students about them. Time limit of the test was 60 minutes, it is not enough for the students. Therefore, the time for writing test should be added become 75 minutes. After that, the range of students’ scores are
quite wide from 46 to 83. “If the Ss have a wide range of ability, test reliability will increase” (Hatch and Farhady, 1982). The result of writing test try out and its descriptive statistic can be seen in Appendix 11 and 12.
Then, those instruments produce the relevant data and it was analyzed carefully as the following way.
3.5 The Data Analysis
The data is analyzed by using statistical analyses the Pearson Product Moment in order to measure the strength of the relationship. Gay (1987) explains, “The most commonly used technique is the product moment correlation
The formula for the correlation coefficient using the raw data based on Hatch & Farhady (1982), Sudijono (1995), Emra (1998), is presented as follows:
Explanation:
a. The number of subjects, N
b. The sum of each subjects X score times the Y score, summation XY c. The sum of the X scores, summation X
d. The sum of the Y scores, summation Y
e. The sum of the squared X scores, summation X squared f. The sum of the squared Y scores, summation Y squared
The value of the observed r is consulted to the value of the critical r (r table). In other words, the result of correlation coefficients between X and Y is consulted to Pearson Product moment table on the level of significant 5%.
Furthermore, all data are also analyzed by using descriptive statistic such as mean, median, mode, range, standard deviation, and variance in order to describe data more detail.
After the data is analyzed, the researcher can draw the interpretation as follows requirements.
3.6 The Data Interpretation
The data can be interpreted after the value of the observed r is consulted to the value of the critical r (r table). In other words, the result of correlation coefficients between X and Y is consulted to Pearson Product moment table on the level of significant 5%. If the observed r is bigger than the critical r at he significant level of 5%, it means that there is positive correlation between two variables. Vice versa, if the observed r is lower than the critical r at he significant level of 5%, it means the there is no correlation between two variables. It is explained by Gay (1987):
Interpretation of a correlation coefficient depends upon how it is to be used. In other words, how large it needs to be in order to be useful depends upon the purpose for which it was computed. In a study designed to explore or to test hypothesized relationship, a correlation coefficient is interpreted in terms of its statistical significant.
Then, the interpretation also tests the hypothesis by using the following criteria:
a. Ho is rejected and Hi is accepted if the observed r is bigger than the critical r at the significant level of 5%, it means that there is positive correlation between variable X and Y.
Gay (1987) proposes more explanation in interpreting the data as the following criteria:
a. If the coefficient is near +1.00, the variables are positively related b. If the coefficient is near .00, the variables are not related
c. If the coefficient is near -1.00, the variables are inversely related
More detail interpretation is stated by Emra (1998) in the following Figure:
Figure 3.3 The Interpretation of Correlation Coefficient
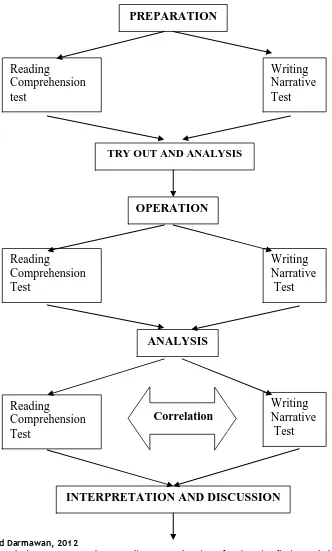
3.7 The Research Procedures
There are some procedures of the research that were followed: A. Preparation
a. Preparing the reading test; b. Trying the reading test out;
c. Preparing the English writing test; d. Trying the English writing test out; e. Analyzing the result of trying out. B. Operation
a. Conducting reading test to the subjects; b. Conducting writing test to the subject; C. Analysis
a. Analyzing the reading test achievement; b. Analyzing the writing test achievement;
c. Correlating the reading marks and the writing marks; d. Interpreting the result of relationship and discussing it; e. Concluding and giving suggestions or recommendations.
Figure 3.4 Design of the Research Procedure
Reading
Comprehension test
Writing Narrative Test
PREPARATION
OPERATION
Reading
Comprehension Test
Writing Narrative Test
ANALYSIS
Reading
Comprehension Test
Writing Narrative Test
INTERPRETATION AND DISCUSSION Correlation
Based on the explanation above, it can be concluded that this chapter describes some important parts of research method. It includes research method, research design, setting, population and sample, data collection method, data analysis, data interpretation, and research procedures. Then, the result of the study will be explored detail in the next chapter. (Chapter IV Research Finding).
CHAPTER IV
RESEARCH FINDING
This chapter discusses a detailed finding of this research as the main point of this thesis. It includes data description, correlational analysis, testing hypothesis, and discussion. In short, it answers the main problem of the research.
4.1 Data Description
4.1.1 Data Description of Students’ Reading Comprehension of Indonesian
Fiction
The data of students’ reading comprehension of Indonesian fiction was
obtained from scores of reading comprehension test. As written in Chapter III section 3.4, reading comprehension test was arranged by the researcher. The test was divided in two parts: text was written in Bahasa Indonesia and instructions or questions were written in English. The text was entitled “Kisah Seorang Kakak
dan Adik” taken from browsing
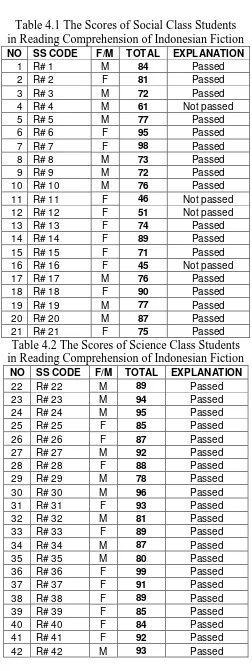
http://bengkel-matematika.com/kisah-seorang-kakak-dan-adik/. There were 20 questions of the test. The highest score was 100 and the lowest was 0.
Table 4.1 The Scores of Social Class Students in Reading Comprehension of Indonesian Fiction NO SS CODE F/M TOTAL EXPLANATION
The first step in data analysis is to describe or summarize the data using descriptive statistic. The major types of descriptive statistics are measures of central tendencies, measures of variability, measures of relative position, and measures of relationship (Gay, 1987).
From the table above, it can be revealed the central tendency of the scores.
Hatch and Farhady (1982) state, “The term central tendency is used to talk about the central point in the distribution of score in the data. There are three measure of
central tendency: the mode, median, and the mean”. The mode means the most
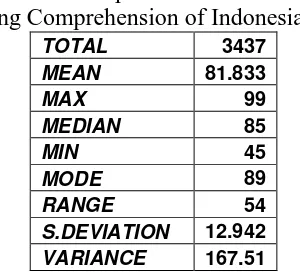
frequently obtained in the data. So, it can be inferred that the mode of this scores was 89. Next, the median means the score that is at the center of the distribution. In this data, the median of the scores was 85. After that, the mean is defined as the average of the scores. That is to add up all scores divided by the number of scores. The formula for gaining the mean is
So, the mean of the scores was 81.83. It is appropriate with the SPSS version 14.0 counting.
standard deviation “looks at the average variability of all the score around the
mean” (Hatch and Farhady, 1982). Standard deviation has the formula as follows:
Therefore, the standard deviation score was 12.94. It is appropriate with
the SPSS version 14.0 counting. Furthermore, “variance is the sum of the squared
deviation score divided by N-1” (Hatch and Farhady, 1982). It also has a formula as follows: version 14.0 counting. After that, from the table above, it can be known that there four students do not pass in the test. Since their scores are below the standard minimum score (65).
To make it easy to understand, they are shown in the following table: Table 4.3 Descriptive Statistic of Sample
in Reading Comprehension of Indonesian Fiction
TOTAL 3437
Table 4.4 Distribution Frequency of Students’ Reading Comprehension Scores
From the table above, it can be inferred that there are 21 students or 50 % who have scores less than the mean score and there are 21 students or 50 % who have score more than the mean score.
To make it easy to understand, it is shown the following bar chart: Figure 4.1 Bar Chart of Frequency Distribution
of Students’ Reading Comprehension
Bar Chart of Frequency Distribution
of Students' Reading Comprehension in Indonesian Fiction
All of the data above mean students are able to comprehend Indonesian fiction since the text of the test was in their mother tongue language or in their first language.
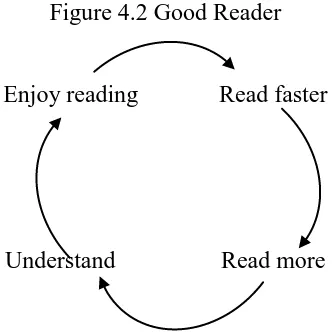
In other word, the students are regarded as into good readers since they enjoy reading and have high understanding in reading it. This is in line with Nuttall (1988) who argues that someone can be said good reader if he enjoys reading, reads faster, reads more, and understand what he reads. Nuttall describes good reader as in the following figure:
Figure 4.2 Good Reader
Enjoy reading Read faster
Understand Read more
4.1.2 Data Description of Students’ Writing Ability in Writing Narrative Text
The data of students’ writing ability of writing narrative text was obtained
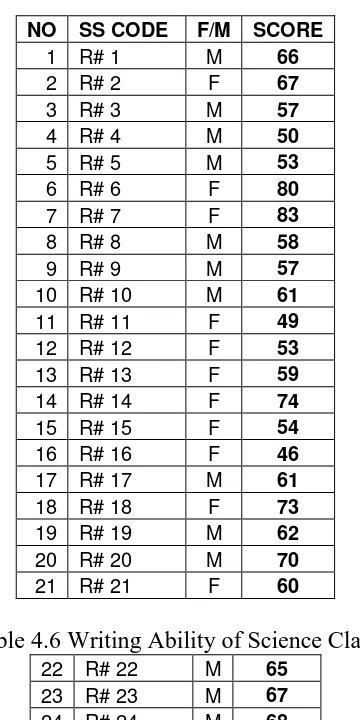
from score of writing narrative text test. As written in Chapter III, writing narrative test was arranged by the researcher. The test instructions are written in English. The students are asked to write a narrative text in the free title. The highest score was 100 and the lowest was 0. The results of the test were assessed to get quantitative data. The data can be shown in the following table (for more detail data, it is attached in Appendix 14):
Table 4.5 Writing Ability of Social Class NO SS CODE F/M SCORE
Table 4.6 Writing Ability of Science Class 22 R# 22 M 65
27 R# 27 M 69 There are three measures of central tendency: the mode, median, and the mean. It can be inferred that the mode of this scores was 66. Next, the median of the scores was 66. After that, the mean of the scores was 65.90. It is appropriate with the SPSS version 14.0 counting.
Then, in order to get more accurate data, the degree of variability have to be measured. There are three ways to get the degree of variability: the range, the standard deviation, and variance. The range is obtained by subtracting the lowest score from the highest score. The highest score of the students was 83 and the lowest score was 46. Therefore, the range score of the students was 37. After that, the standard deviation score was 9.06. It is appropriate with the SPSS counting. Furthermore, the variance score was 82.23. It is appropriate with the SPSS version 14.0 counting.
Table 4.7 Descriptive Statistic of Students’ Writing Ability of Narrative Text
Since the data is in the large number, the data is transferred in distribution frequency as the following table:
Table 4.8 Distribution Frequency of Students’ Writing Ability of Narrative Text
To make it easy to understand, it is shown the following bar chart:
Figure 4.3 Bar Chart of Frequency Distribution of Students’ Writing Scores
Bar Chart of Students' Writing Score
46-50 51-55 56-60 61-65 66-70 71-75 76-80 81-85
All of the data above show the normal distribution since mean, median, and mode are all the same and the curve shape (such as in the figure 4.3) is bell-shaped and symmetric (Hatch and Farhady, 1982). Those data also mean the students are able to compose narrative texts in English. It could be generalized that the population of this study is able to write English narrative text.
4.2 Correlational Analysis
Correlational analysis was conducted to find the answer of the problem whether there is a correlation between students’ reading comprehension of Indonesian fiction and writing ability of English narrative text. Hatch and Farhady
(1982) explain, “The easiest way to see the relationship between the two sets of
scores is to represent them graphically. This representation, called a scatter plot or
scattergram, is done by plotting the scores”. The following figure shows the
scattergram of the distribution of scores to show clearer the positive correlation of the scores:
Figure 4.4 The Scattergram of the Distribution of Scores
The Scattergram of the Distribution of Scores
Furthermore, “scatter plots do not give us any quantitative measure of the
degree of the relationship between the two variables. Therefore, we will use certain statistics which have been developed to measure the degree of
relationship” (Hatch & Farhady, 1982). Statistical analysis for correlational studies is Pearson Product moment. It was used to analyze the data since the data was in the interval. The formula for the correlation coefficient using the raw data based on Hatch & Farhady (1982) is presented as follows:
N(XY)-(X)(Y)
[NX2-(X)2][NY2-(Y)2]There are three kinds of calculation (The manual calculation, Microsoft Excel calculation, and SPSS version 14.0 calculation) used to get the convincing data as follows:
a. Manual calculation and Microsoft excel calculation
Manual calculation should be used in discussion besides SPSS program in order to convince that SPSS is used in the right way. It also has function to teach and remind us to calculate manually (Arikunto, 2007).
Table 4.9 Manual Calculation to Find Correlation
NO Ss CODE F/M X Y X2 Y2 XY
1 R# 1 M 84 66 7056 4356 5544
2 R# 2 F 81 67 6561 4489 5427
3 R# 3 M 72 57 5184 3249 4104
4 R# 4 M 61 50 3721 2500 3050
5 R# 5 M 77 53 5929 2809 4081
6 R# 6 F 95 80 9025 6400 7600
7 R# 7 F 98 83 9604 6889 8134
8 R# 8 M 73 58 5329 3364 4234
9 R# 9 M 72 57 5184 3249 4104
11 R# 11 F 46 49 2116 2401 2254
= 42(230781) - (3437) (2768)
[42x288129 -(3437)2] [42x 185796-(2768)2]= 9692802 - 9513616
[12101418 - 11812969] [7803432 - 7661824]= 179186
[288449] [141608]= 179186
40846685992= 179186 202105.6
= + 0.8866
Thus, manual calculation and Microsoft Excel Program shows that coefficient correlation between the two variables is + 0.8866.
b. SPSS version 14.0 calculation
SPSS version 14.0 computation is the most commonly calculation used in the language and social studies. It can be drawn as the following table:
Table 4.10 SPSS version 14.0 Output of Correlation 3 Correlations
VAR X VAR Y
VAR X Pearson Correlation 1 .887(**)
Sig. (2-tailed) .000
N 42 42
VAR Y Pearson Correlation .887(**) 1
Sig. (2-tailed) .000
The able also indicates that correlation coefficients between X and Y is 0.887 (Pointed by an arrow) rounded from 0.8866.
Therefore, all calculations above give the same result that the correlation coefficients between X and Y is 0.8866. The value of the observed r is consulted to the value of the critical r (r table). In other words, the result of correlation coefficients between X and Y is consulted to Pearson Product moment table on the level of significant 5%. The value of the critical r (r table) is 0.3044 (see Appendix 15).
So, r observe > r table 0.8866 > 0.3044
It means that there is a significant correlation between students’ reading comprehension of Indonesian fiction and writing ability of English narrative text.
As Gay (1987) proposes more explanation in interpreting the data as the following criteria:
a. If the coefficient is near +1.00, the variables are positively related b. If the coefficient is near .00, the variables are not related
c. If the coefficient is near -1.00, the variables are inversely related
The plus (+) sign does not mean as Algebra sign but it means the positive correlation. The positive correlation means a linier relationship between two variables X and Y (Sudijono, 1995), (Woods et al., 1985). In other word, the correlation between students’ reading comprehension of Indonesian fiction and writing ability of English narrative texts go parallel or the same way. It means the
writing ability of English narrative texts. And vice versa, the lower students’ reading comprehension of Indonesian fiction tend to be the lower writing ability of English narrative texts. To make it clear, it can be shown in the following figure:
Figure 4.5 Positive Correlation (Sudijono, 1995)
or
Variaable X Variable Y Variable X Variable Y
As a result, all of the analysis show the same conclusion that there is a
significant correlation between students’ reading comprehension of Indonesian fiction and writing ability of English narrative text. This finding and analysis are believed valid since they are used several ways of instruments and computation. This finding can test the hypothesis as the following part.
4.3 Testing Hypothesis
The interpretation also tests the hypothesis by using the following criteria: a. Ho is rejected and Hi is accepted if the observed r is bigger than the critical r
at the significant level of 5%, it means that there is positive correlation between variable X and Y.
Based on the calculation above it can be concluded that Ho is rejected and Hi is accepted since the observed r is bigger than the critical r at the significant level of 5%, it means that there is a positive and significant correlation between
students’ reading comprehension of Indonesian fiction and writing ability of English narrative text. Moreover, according to Emra (1998), Sudijono (1995), r observes from +0.8 to +0.10 means very high degree of positive correlation.
4.4 Discussion
The problem of this research that is whether there is a correlation between
students’ reading comprehension of Indonesian fiction and writing ability of English narrative text has been already answered statistically that there is positive
and significant correlation between students’ reading comprehension of Indonesian fiction and writing ability of English narrative text. This finding is in line with the previous related research. Even though the perfect same problem of the research do not found, the following research are considered related to this research such as Stotsky (1983 cited in Kroll, 1991) surveyed first language correlational studies and found the following:
There are correlations between reading achievement and writing ability. Better writers tend to be better readers.
There are correlations between writing quality and reading experience as reported through questionnaires. Better writers read more than poorer writers.
There seem to be correlations between reading ability and measures of syntactic complexity in writing. Better readers tend to produce more syntactically mature writing than poorer readers.
(1989); Cummins (1989); Krashen and Biber (1988) cited in Freeman and
Freeman (1992) found, “Students who speak, read, and write their first language
well are more apt to succeed academically in English”.
This finding is also supported by previous research that has found:
When children read extensively they become better writers. Reading a variety of genres helps children learn text structures and language that they can then transfer to their own writing. In addition, reading provides young people with prior knowledge that they can use in their stories. (http://www.k12reader.com/the-relationship-between-reading-and-writing)
Moreover, it also can be compared between male students and female students in reading comprehension of Indonesian fiction based on the average score. The average score of male students is 79.6 (See Table 4.11) and the average score of female students is 80.3 (See Table 4.12). The difference between the groups is 0.72. 0.72 is not too high difference. Both male group scores and female scores are also compared by using t-test. The result showed that t observe= 0.733 < t table = 2.021 with df (n1-1+ n2-1) = 40 at 0.05 level of significant. It means
that there is no difference between male students of reading comprehension score of Indonesian fiction and female students of reading comprehension score of Indonesian fiction. It can be shown detail in the following table:
22 R# 22 M 84.5
Table 4.12 Female Students’ Reading Comprehension of Indonesian Fiction
NO SS CODE F/M RCIF with the previous research. Such as Friedlander (cited in Kroll, 1990) argues that
there are many studies showing “regardless of a language prescription, writer will
first language to their second language”. It is also happened to the foreign
language. For example, Molan and Lo (1985 cited in Kroll, 1990) state, “Students
had similarly deficient rhetorical strategies in their first language and in English”. It means that first language ability contributes to second or foreign language ability.
Meanwhile, Edelsky’s finding (1982 cited in Kroll, 1990) concludes, “The
writing of first, second, third graders in a bilingual program also indicates that
writing knowledge transfers across languages”. He shows, “Writers use first
language strategies and knowledge to aid their second language writing”. First
language strategies are often used in learning foreign language. It can be proved from the result of writing narrative test, that many students write the stories or essay in Indonesian style, perhaps including the writer of this research too. This is confirmed by Jones and Tetroe (1987 cited in Kroll, 1990) who find:
ESL writers transferred both good and weak writing skills from their first language to English. This transfer was independent of language proficiency, which affected only quantity of planning. They noted that
weaker writers’ failure to use writing strategies in English was based on their failure to use these strategies in their first language.
The next confirmation is proposed by Silvia (1986) who finds, “Subject
had effective L1 strategies to transfer to the L2 writing context; her subject’s first
language and second language composing processes displayed similar high-level
goal structures and problem representations”.
After that, the usage of first language in foreign language composition is also found in the sample result of the test. They switch both languages especially
in Kroll, 1990) which says, “The greater the number of switches into the first
language, the better the quality of the essays in terms of organization and ideas”. This description also give a horizon that how important reading and
writing in supporting students success in learning. As Arends (1989) utters, “The
success of students in school rest, in large extent, on their proficiency in reading
and writing increasingly complex information”.
Consequently, it was found that there is positive and significant correlation
between students’ reading comprehension of Indonesian fiction and writing ability of English narrative text. It also means there is positive and significant correlation between first language ability and foreign language ability. It means there is
positive and significant correlation between students’ reading comprehension and their writing ability.
CHAPTER V
CONCLUSIONS, LIMITATIONS OF THE STUDY, AND SUGGESTIONS
The four previous chapters have provided the detailed information of the research, including the background of the study, the related literature, the methodology, and the research findings. Meanwhile, this chapter supplies the main summary of this research. It covers the conclusions, limitations of the study, and the suggestions or the recommendations.
5.1 Conclusions
This study was based on the belief that better readers tend to be better writers stated by Stotsky (1983 cited in Kroll, 1991). According to this view, reading and writing have a strong relationship. Besides, this study was also based on the other belief that first language promotes to second or foreign language. In other word, this study was about combination of both issues. It was stated in the correlation between students’ reading comprehension of Indonesian fiction and their writing ability of English narrative texts.
Furthermore, this study also concludes that second grade students of SMA N 2 Bandung are able to write English narrative text. The ability of the students are analyzed based on the content, organization, vocabulary, language use and mechanics of the text proposed by Jacob (1981). Their average score of writing test is 65.905.
Moreover, the main finding of the research concludes that there is a positive correlation between students’ reading comprehension of Indonesian fiction and their writing ability of English narrative texts. With the correlation coefficient of 0.8665 higher than r table 0.3044 with the level of significance 5%. It also means there is a positive and significant correlation between first language ability and foreign language ability. It means there is a positive and significant
correlation between students’ reading comprehension and their writing ability as well. Therefore, the null hypothesis is rejected and the alternative hypothesis is accepted.
Then, the ability of comprehending Indonesian fiction is considered as one of the factors that promote their writing ability in English narrative texts. In addition, the habit of reading Indonesian fiction could contribute the ability of writing narrative texts.
Last, the mean score of science class students is better than social class students, both in reading Indonesian fiction and in writing English narrative text.
5.2 Limitations of the Study
tendency result between two or more variables. The only study involves
causal-effect relationship is experimental study (Gay, 1987). Second, students’ writing
ability of English narrative texts is tested once by the researcher. It means that writing here is regarded as a product instead of a process.
Third, the analysis of students’ writing ability cannot be explained more since it is not needed in answering the research problem. The appropriate method
of the study to analyze more about students’ writing ability in English narrative texts is using a qualitative research.
5.3 Suggestions
After having some conclusions, the writer then comes to some significant suggestions. First, this study suggests to English teachers to use Indonesian fiction
such as Indonesian novel, Indonesian folk’s story, and so on as a media in
learning English as the foreign language. This suggestion is also supported by
Mansyur (2002) who states, “It is better for lecturers or teachers to start the
teaching writing by using Indonesian context, then in English”. Moreover, to build writing habit, students should be taught first to devote their emotional feeling after reading a story.
1989; and others quoted in Kroll, 1991) suggest, “Students can learn much about
writing from reading”.
Third, it is better for further researchers who interested in this problem to take more samples in different setting. Different method such as experiment study could be better to obtain another horizon about the effect of reading Indonesian fiction on English writing ability. Further research may extend the scope of the problem. Hence it may motivate people to read and write more in order to develop their knowledge.
Fourth, headmaster or stakeholder of schools is also suggested to provide Indonesian novel and other kinds of fiction in the library as the sources of learning reading and writing. Fifth, it is suggested to whoever interested in this problem to develop reading and writing skill in any language. Since most of languages has the same language form and structure.
Sixth, it is suggested that “teaching reading should become an integral part of teaching writing, and reading for pleasure should be encouraged and incorporated into the writing syllabus design. The more the students read, the more they acquire the language of writing, and ultimately the more likely they will become good writers. Indeed, good writers often start from good readers (Sugiharto, 2007).
Last, simply knowing that reading and writing are intimately connected
REFERENCES
Administration Staff of SMA N 2 Bandung. [Online]: Available:
www.sman2bandung.or.id [20/06/09]
Alexander, E. (1988). Teaching Reading Illinois. Boston: Foresman and Company.
Alwasilah, A. C. and Alwasilah, S. S. (2007). Pokoknya Menulis. Bandung: PT Kiblat Buku utama.
Alwasilah, S. S. (2002). The Creative Process of Writing: a Case Study of Three Indonesian Fiction Writers. A Thesis. Bandung; Indonesian University of Education. Unpublished.
Anderson, M. and Anderson, K. (1997). Text Types in English 2. South Yarra: Macmillan Education Australia Pty Ltd.
__________________________. (1997). Text Types in English 3. South Yarra: Macmillan Education Australia Pty Ltd.
Anderson, R. et al. (1985). Becoming a Nation of Reader. Washington: The National Institute of Education.
Appleyard, J. A. (1994). Becoming a Reader. The Experience of Fiction from Childhood to Adulthood. New York. Cambridge University Press.
Arends, R. I. (1989). Learning to Teach. New York: McGraw-Hill Look Company.
Arikunto, S. (1993). Procedure Penelitian: Suatu Pendekatan Praktek. Jakarta: PT Rineka Cipta.
Arikunto, S. (1999). Dasar-Dasar Evaluasi Pendidikan. Jakarta: Bina Aksara. Arikunto, S. (2007). Manajemen Penelitian. Jakarta: PT. Rineka Cipta.
Atwan, R. and Vestermen, W. (1987). Effective Writing for the College Curriculum. New York: McGraw-Hill Book Company.
Beare, K. (1997). Teaching Writing Skills. [Online]. Available:
http://esl.about.com/cs/teachingtechnique/a/a_twrite.htm [5/5/09] Bowen, J. D., et al. (1985). TESOL. Techniques and Procedures. Singapore:
Newbury House Publisher.
Brown, D. (2001). Teaching by Principles; an Interactive Approach to Language Pedagogy. San Francisco: San Francisco State University.
Butt et al. (2002). Using Functional Grammar: An Explorer’s guided. New South Wales: Macquarie University.
Byrnes, H. (1998). Reading in the Beginning and Intermediate College Foreign Language Class. Washington, DC: Center for Applied Linguistics.
Cameron, L. (2001). Teaching Languages to Young Learners. Cambridge: Cambridge University Press.
Christie, F. and Martin. J. R. (1997). Genre and Institutions. New York: Continuum.
Churchill, M. R. (2008). 6 Tips for Your First Job at Creative Writing. [Online]
http://www. freelancewriting.com/articles/article-first-jab-at-creative-writing.php [21/4/2008]
Clayton, J. J. (1984). The Heath Introduction to Fiction. Toronto: D.C. Heath and Company.
Cope, B. and Kalantzis, M, (1993). The Powers of Literacy: A Genre Approach to Teaching Writing. Washington DC: The Flamer Press.
Depniknas. (2007). Kurrikulum Tingkat Satuan Pelajaran 2007; Standar Kompetensi; Mata Pelajaran Bahasa Inggris SMA/MA. Jakarta: Depdiknas.
Derewianka, B. (2004). Exploring How Text Work. Australia: McPherson’s Printing Group.
Emra. (1998). “The Data Analysis Core Competencies. Descriptive statistic”. PDF. [Online].
Fraenkle, J. R. and Wallen, N.E. (1993). How to Design and Evaluate Research in Education. New York: McGraw Hill inc.
Freedman, Aviva & Carleton University. (1994). Learning and Teaching Genre. Portsmouth: Boynton/ Cook Publisher. Ann Arbor: The University of Michigan Press.
Gay, L.R. (1987). Educational Research. Columbus. Merrill Publishing Company. Third edition.
Gerot, L. and P. Wignell. (1994). Making Sense of Functional Grammar. Sydney: Antipodean Educational Enterprises (AEE).
Gilbert, P. (1989). Writing Schooling and Deconstruction. From Voice to Text in the Classroom. London and New York: Routledge.
Gibbons, P. (2002). Scaffolding Language, Scaffolding Learning. Portsmouth: Heinemann.
Graves, D. H. (1994). A Fresh Look at Writing. Canada: Irwin Publishing.
Hadley, A. O. (2001). Teaching Language in Context. Urbana: University of Illinois.
Hawthorn, J. (2001). Studying the Novel. London: Arnold. Fourth Edition. Hernowo (Eds).(2005). Quantum Reading. Bandung: Mizan Learning.
Hughes, A. (1989). Testing for Language Teachers. Cambridge: Cambridge University Press.
Irwin, J. W. (1986). Teaching Reading Comprehension Processes. New Jersey: Prentice-Hall Inc.
Jordan, R.R. (1997). English for Academic Purposes. Cambridge: Cambridge University Press.
Kroll, B. (Eds). (1990). Second Language Writing. Cambridge: Cambridge University Press.
Kral, T. (Eds). (1996). “Teacher Development”. Making the Right Moves. Washington DC: English Language Program Division.
Krashen (1987). The Natural Approach: Language Acquisition in the Classroom. UK: Prentice Hall International Ltd. Constructive Tasks. Newark. DE: International Reading Association. [Online]. Available:
http://www.albany.edu/cela/publication/article/writeread.htm [2/8/09]
Lengkanawati, N.S. (1999). “EFL learners’ Own Culture and their Language Learning Strategies”. Unpublished Paper.
Mansyur, A.S., (2002). Composing in English: Problems and Suggested Solution (A Case Study at English Deparment of IAIN Sunan Gunung Djati Bandung. A Thesis. Bandung: Indonesia University of education. Unpublished.
Markskettel, N.D. (1966). Better Reading in the Secondary School. New York: The Ronald Company Press
Musthafa, B. (2005). “English for Young Learner. (EYL)”. Unpublished Module.
Bandung. PPs. UPI Bandung.
Myles, J. (2002). Second Language Writing and Research: The Writing Process and Error Analysis in Student Texts. Vol. 6. No 2 [online]. Available:http://tesl-ej.org/ej22/a1.html. [31/07/09]
Ningsih, K. (2005). “Poetry? Why not!”. A Paper of an International Seminar and Workshop in State University of Padang, Padang.
Nunan, D, (Eds). (2003). Practical English Teaching and Learning. New York: McGraw-Hill Company Inc.
Nuttall, C. (1988). Teaching Reading Skill in a Foreign Language. London: Heinemann.
Pakinson, B. and Thomas, H.R. (2004). Teaching Literature in a Second Language. Edinburgh: Edinburgh University Press Ltd.
Rianita, L. (2007). Readers’ Responses to the Novels of Harry Potter. Thesis. Indonesia University of Education. Bandung. Unpublished.
Richards, J. C., (1990). The Language Teaching Matrix. Cambridge: Cambridge University press.
Richer, D. H. (1981). The Forms of the Novella. New York: Alfred A. Knopf.
Rusdi. (2005). “The Power of Storytelling”. A Paper of an International Seminar and workshop in State University of Padang, Padang.
Sadtono, E. (1997). “Bridging the Gap, but is it Bridgeable”. Paper presented on
Second National Conference on English in High Schools and Universities in Indonesia. Bandung: Institude Teknologi Bandung. Silverman. D. (2005). Doing Qualitative Research. London: Sage Publications ltd.
Second Edition.
Smith, D. (2008). Research on Creativity. [Online]. Available:
http://www.geocities.com/dougsmithtraining/research.html [21/4/2008]
Spear, K. (1988). Sharing Writing: Peer Response Groups in English Classes. Portsmouth, NH: Boynton/ Cook Publishers.
Sudijono, A. (1995). Pengantar Statistik Pendidikan. Jakarta: PT Raja Grafindo Persada.
Sudjana, N. (1995). Penilaian Hasil Proses Belajar Mengajar. Bandung: Remaja Rosdakarya.
Sugiharto, S. (2007, 14 July). Reading First Step to Becoming Better Writer. Jakarta: The Jakarta Post. Sat, 07/14/2007. Avaiable
http://www.thejakartapost.com/news/2007/07/14/
reading-first-step-becoming-better-writer.html?1 [2/08/09]
Sumiyadi and Anshori, D.S. (2009). Kajian Sastra dalam Perspektif Theori Kontemporer. Bandung: Jurusan Pendidikan Bahasa dan Sastra Indonesia FPBS UPI.
Syafeii, M. (2001). Aspects of Writing. Thesis. UPI Bandung: Unpublished
Taylor, B.B. et al. (1988). Reading Difficulties: Instruction and Assessment. New York: McGraw-Hill Publishing Inc.
Weir, C. J. (1990). Communicative Language Testing. United Kingdom: Prentice Hall.
Witrock, M. C. et al..(1985). Handbook of Reading Research on Teaching. New York: Macmillan Publishing Co. Inc.
Wolfe, T. Teach Students how to Read a Narrative Text. [Online]. Available:
www.englishcompanion.com [30/07/09].
Woods, A. et al. (1985). Statistics in Language Studies. Cambridge: Cambridge University Press.
The Relationship Between Reading and Writing. [online]. Available: