98
The Impact of Intellectual Capital toward Firm’s Profitability and Market Value
of Retail Companies Listed in Indonesia Stock Exchange (IDX) from 2013-2016
Richard Suherman
International Business Management Program, Petra Christian University Jl. Siwalankerto 121-131, Surabaya
E-mail: m34413035@john.petra.ac.id
ABSTRACT
Nowadays, as we move from labor intensive economies to knowledge intensive economies, companies need a new source of competencies to compete with other. Investing in tangible asset is no longer sustainable and it is no longer a factor that differentiate between companies. This conditions encorage the researcher to find other competencies that could give companies new competitive advantage in order to improve their profitability and market value. The researcher will focus on intellectual capital as the main driver that could improve company’s profitability and market value. Intellectual capital itself consists of three components, namely, human capital, structural capital, and relational capital. The researcher would like to know whether intellectual capital and its components could improve company’s profitability and market value.
The data was collected from 10 retail companies that are listed in Indonesia Stock Exchange (IDX) during the period of 2013-2016. The researcher’s findings shows that intellectual capital have a significant impact toward firm’s profitability and have an insignificant impact toward market value. Further test conducted on the components of intellectual capital also shows that only human capital has a significant impact toward firm’s profitability and only human capital and structural capital have a significant impact toward market value.
Keywords: Intellectual Capital, Human Capital, Structural Capital, Relational Capital, Operating Profit Margin, Market Value
ABSTRAK
Dengan perubahan ekonomi yang semula berasal dari labor intensive menjadi knowledge intensive, perusahaan saat ini membutuhkan sebuah kompetensi baru yang dapat meningkatkan daya saing dengan yang lain. Investasi di aset berwujud tidak lagi dapat bertahan dan menjadi faktor yang membedakan sebuah perusahaan. Situasi ini mendorong peneliti untuk mencari kompetensi lain yang dapat memberikan suatu perusahaan keunggulan kompetitif untuk meningkatkan profitabilitas dan nilai pasar. Peneliti secara khusus akan mempelajari da mpak intellectual capital sebagai penggerak utama yang dapat meningkatkan profitabilitas dan nilai pasar perusahaan. Intellectual capital sendiri terbagi menjadi tiga bagian yaitu human capital, structural capital dan relational capital. Peneliti akan mencari jawaban apakah intellectual capital dan komponen nya dapat meningkatkan profitabilitas dan nilai pasar perusahaan.
Data diambil dari 10 perusahaan di industri ritel yang terdaftar di Bursa Efek Indonesia (IDX) selama periode 2013-2016. Hasil penilitian ini menunjukkan bahwa intellectual capital memiliki pengaruh yang kuat terhadap profitabilitas dan pengaruh yang tidak kuat terhadap market value. Hasil uji selanjutnya pada komponen intellectual capital juga menunjukkan bahwa hanya human capital memiliki pengaruh yang kuat terhadap profitabilitas dan hanya human captal dan structural capital memiliki pengaruh yang kuat terhadap market value.
99
INTRODUCTION
Globalization creates competition and drives companies to develop something new in order to obtain a competitive advantage. As we move from a labor intensive economy to a knowledge economy, companies need a new source of competencies to compete with others. Furthermore, with the development of technology, software application and information communication, it also changes how business operates. Therefore, investing in the tangible asset is no longer sustainable and it is no longer an important factor in a knowledge based economy (Neef, Siesfeld, & Cefola, 1998).
Powell and Snellman (2004) define knowledge economy as an era where production and service are based on knowledge intensive activities (technological and scientific advances) that rely on intellectual capabilities rather than physical input. Pulic (1998) also suggests that in a knowledge-based economy, knowledge or intellectual capital (IC) is a more important factor of wealth and value creation compared to other tangible and physical asset.
Stewart (1997) defines IC not as an asset, but rather as a knowledge that can transform raw material and make it more valuable. Talukdar (2008) also defines IC as a tool or knowledge in which organization can use to utilize their tangible asset in the most effective ways for creating value for the company. Bontis (1998) defines further the term of knowledge in IC in which he mentions that IC is the pursuit of effective use of knowledge. These are the reason why companies nowadays should shift their focus from tangible asset to IC or knowledge asset because IC can give distinct competitive advantage and different performance between
one firm and the other, especially in today’s economy that
highly depends on knowledge (Pulic, 1998).
IC itself can be found in many forms. Sveiby et al. (1989) mention that knowledge assets or IC can be found in three places which are in the competencies of the people or individual capital, in internal structure or structural capital (patents, models, computer and administrative systems) and in external structure or customer capital (brand, reputation, relationship with customers and suppliers). These components, later on, are analyzed further by many researchers and they conclude a general agreement that says IC is composed of three elements which are human capital, structural capital, and relational capital (Stewart, 1997; Edvinsson & Malone, 1997; Bontis, 1998).
Many researchers in IC field also found that IC has a
positive impact toward firm’s profitability and market value
(Nimtrakoon, 2015; Maditinos, Chatzoudes, Tsairidis, & Theriou, 2011; Chen, Cheng, & Hwang, 2005). IC is believed to be the key value driver in the new economy that can enhance their market competitive advantage for sustainable profit (Wang, 2008). Studies by Wong, Li, and Ku (2015) and Nimtrakoon (2015) also suggest that organization with a higher IC efficiency tend to have a better profitability performance and a higher market value. This shows the importance of IC to help all companies improve their profitability and market value.
Even though there is a growing number of importance on IC, however, there are still many debates on how to measure IC. Jurczak (2008) has summarized a list of IC measurement methods proposed by several researchers such as Investor Assigned Market Value (IAMVTM) Model
(Standfield, 1998), Intangible Asset Monitor (Svelby, 1997), Value Added Intellectual Coefficient (VAICTM) (Pulic,
1998, 2000), and etc. Among those methods, Pulic’s
VAICTM is the most widely used IC measurement by many
researchers to measure the value of IC. In his model, Pulic (1998) stated that there are two components which create
company’s value, namely, capital employed efficiency
(CEE) which include all the financial fund and intellectual
capital efficiency (ICE) which include company’s
infrastructure and stakeholder relation. ICE itself is consists of human capital efficiency (HCE) that focus on the employee and structural capital efficiency (SCE) that focus on the system and support of the company. Therefore VAICTM model by Pulic (1998) is consists of three
components which are CEE, HCE, and SCE.
However, there are still many arguments and
limitations on Pulic’s VAICTM model. One of the arguments
mentions that Pulic VAICTM model does not consider
relational capital as one of the components of IC, while, many researchers have agreed that IC consists of three components which are human capital, structural capital and relational capital (Stewart, 1997; Bontis, 1998). Therefore, some researchers try to modify the VAICTM model becoming
modified value added intellectual coefficient (MVAIC) by adding the relational capital efficiency (RCE) into the existing model and theory (Ulum, Ghozali, & Purwanto, 2014; Nimtrakoon, 2015).
As of now, there have been many IC research journals in Indonesia using the VAICTM model (Ulum, 2013;
Nuryaman, 2015; Rustandi, 2013), however, there are still a few researches that have done the study on IC using the MVAIC model (Ulum, Ghozali, & Purwanto, 2014). Therefore, this research will use the MVAIC model to measure IC.
Moreover, IC researches in Indonesia mainly focus on manufacturing industry (Nuryaman, 2015; Purnama, 2016; Mardani, 2013), but there are only a few that have done a research in the service industry, especially in retail. Meanwhile, service industry has been known as a high knowledge intensive industry and it has been the main force Firerof the economy in Indonesia. “Service account for about 54% of GDP and nearly 50% of employment. It is also the fastest-growing sector of the national economy, averaging
more than 7% annual growth for the last decade” (Brockman,
2014, p.1).
100 Besides that, retail sector also has been growing very fast in Indonesia for the last four years. According to Global Retail Development Index (GRDI) by AT Kearney (2016),
Indonesia’s ranking in terms of attractiveness and future
potential in retail has always been improving from the 19th
place in 2013 becoming the 5th place in 2016. Their report
shows that in 2012, Indonesia retail has been experiencing a slowing down in recent years, and it has been starting to picking up since 2013 due to rising income and infrastructure development (AT Kearney, 2013). Moreover, starting in 2013 online retail or e-commerce is also expected to grow rapidly in the future. In 2013, three quarters of Internet users in Indonesia shopped online (AT Kearney, 2013). Moreover, a retail sales survey (RSS) by Bank Indonesia (2016) also shows that real sales index (RSI) in Indonesia has continued to increase in the last 4 years with 10.5% year on year growth in December 2016. With such increase and tight competition from online retail in the last 4 years, Indonesia retailers need to keep innovating and finding new competencies to be able to compete with other.
Mukherji (2012) mentions that retail is one of the service sectors that highly depend on knowledge to be able to compete with other. Moreover, as an intermediary between manufacturing and end consumer, retail industry does not have their own product or production, which means
competition and innovation can’t come from product or
production. A report by Ernst & Young LLP (2013) mentions that there are 6 determinant of success in retail which are simplicity, employee, overhead cost, supply chain, expenditure, and online channel. These key success factors highly depend on good knowledge management system, human capital, and customer relation, which all are parts of the components of IC, to help retailers effectively manage their assets and knowledge to achieve those factors. This is the reason why IC is also essential for retail business. Therefore this study would like to research the impact of IC using the MVAIC model on retail industry in Indonesia from 2013-2016.
LITERATURE REVIEW
In this section, the researcher will explain the concepts that are relevant to this study which are IC, profitability, and market value to construct a theoretical framework model and develop hypothesis statement.
Intellectual Capital
In the knowledge economy, IC has become an important asset for companies to have. Bontis (1998)
suggests that “if there is one distinguishing feature of the new
economy that has developed as a result of powerful forces such as global competition, it is the ascendancy of intellectual
capital” (p.64). With the growing importance of IC, there is a
need to define the concept of IC.
The term IC itself was first used and published back in 1969 by John Kenneth Galbraith in which he uses the
concept of “Intellectual action” rather than “Intellect as pure intellect” (Müller). This means that IC is more dynamic
rather than static. Chang and Hsieh (2011) suggest that
intellectual action means “movement from having knowledge and skills to using knowledge and skills” (p.4).
After the year of 1990, IC has become more popular and many scholars have tried to define the term of IC. One of the famous definitions of IC provided by Stewart (1997), explains that IC is a knowledge which can be used as a tool to transform raw materials (physical or intangible) and make it more valuable. Sullivan (2000) also agrees with this definition by saying that IC is a knowledge that can be converted into profit. Both of these scholars suggest that IC is not referred as an asset but rather as a knowledge that is used by companies to create wealth. Bontis (1998) defines further the term of knowledge in IC by differentiating between information and knowledge in which information is only the raw material (fact/data/input) and knowledge is the finished product, (implication & result from information gathered/output) therefore IC is the pursuit of effective use of knowledge as opposed to information.
Harrison and Sullivan (2000), however, use the word intangible assets instead of knowledge to describe IC. Bukowitz and Williams (2000) also define IC as intangible assets that are used to create greater wealth. Edvinsson and Malone (1997) agree with this view and give a broader definition by saying that IC is intangible assets that bridge the gap between company’s market value and book value. Sveiby (1998) also mentions that IC is intangible assets that
are causing a wider gap between company’s market value
and book value due to the inability of accounting standard to
capture the value of company’s intangible assets (IC).
Hasset and Shapiro (2012), however, argue that IC is not equal with intangible assets because IC is only a subset or a part of intangible assets. Moore and Craig (2008) classify intangible asset as an asset that consists of intellectual property, intellectual assets, and intellectual capital. However, a study done by Boekestein (2006) proves that IC is actually the same with intangible assets. His research shows that there is only a minor differences between IC and intangible assets and there is a substantial overlap between these two concepts. This research, therefore, aligns and supports previous studies that mention IC is intangible assets (Edvinsson & Malone, 1997; Sveiby K. E., 1998). Therefore, it can be concluded that IC is the same with intangible assets. Despite these various definitions of IC by many scholars, all of them agree that IC is important for companies to create wealth. The differences, however, lie within the terminology that they use to explain IC. By comparing and combining these various definitions, the researcher in this study will use the definition of IC as knowledge and assets that are invisible in form (intangible) used by the companies to create wealth and improve their market value (Stewart, 1997; Edvinsson & Malone, 1997; Sveiby K. E., 1998).
101 and have been adopted by many current researchers in their study in IC field (Nimtrakoon, 2015; Maditinos, Chatzoudes, Tsairidis, & Theriou, 2011; Chang & Hsieh, 2011). Therefore, this research will also use these three components of IC which are human capital, structural capital and relational capital for this study.
Edvinsson and Malone (1997) mention that human capital is the knowledge, expertise, and capability of the employee of the organization to solve a problem and achieve goals of the organization. Bontis (1998) mentions the importance of human capital as the source of innovation and strategic renewal that creates the intelligence of the organization member. Chen, Zhu, and Xie (2004) even suggest that human capital is the basis and driver of IC and without it, no value can be generated.
Stewart (1997) mentions that structural capital includes all the processes and systems in the company such as patents, models, computer, and administrative system. Zyl (2005) gives an extreme definition of structural capital as a skeleton and glue of organization or in other words what is left behind after all of the employees left the organization. Bontis (1998) mentions the importance of structural capital as the support for the employees to attain the optimum intellectual performance and overall business performance.
Atan and Sofian (2014) mention that relational capital is external organization and structure consisting of environment agent and industry such as customers, suppliers, partners, and shareholders. Stewart (1997) added this definition by saying that relational capital also consists of brand equity (value of brand) and customer loyalty (a promise of quality).
With the growing interest of IC among researchers and practitioners, there are high demand and growing importance of IC measurement method. Among several IC methods
mentioned by many scholars, Pulic’s Value Added
Intellectual Coefficient (VAICTM) method is the most
common IC valuation and measurement method that has been widely adopted by many academics and practitioner in researches related to IC (Firer & Williams, 2003; Chen, Cheng, & Hwang, 2005; Lipunga, 2014). Nimtrakoon (2015) mentions that there are five advantages of using VAICTM method for IC valuation, which are:
1.Pulic’s VAICTM is simple and straightforward in
measuring the value of IC.
2.The data requirement to measure the value of IC using VAICTM method is feasible because all the
data can be obtained from corporate financial report.
3.VAICTM method is more objective compared to
other measurements because the data being used are audited.
4.VAICTM method makes cross-organization
comparison possible because other measurement methods require both financial and non-financial assessments which sometimes can be subjective. 5.VAICTM method may be used to measure IC and
organization performance in all type of industries. Due to these reasons, many researchers in IC field use
Pulic’s VAICTMmethod to measure and value IC. Pulic’s
VAICTM method is used to measure the efficiency of the
firm’s input to create value added (Lipunga, 2014). Pulic (1998) mentions that in order to create value added for the companies, they are required to have both physical capital and intellectual capital. Therefore two inputs are needed to create value added for the companies which are capital employed efficiency (CEE) and intellectual capital efficiency (ICE). ICE itself is consists of human capital efficiency (HCE) and structural capital efficiency (SCE). Thus VAICTM
method is simply the sums of these three inputs.
Even though VAICTM method is simple and
commonly used by many researchers and practitioners, a number of authors are able to point out the limitation of this model. Ståhle, Ståhle, & Aho (2011) analyze the validity and measurement of VAICTM as well as testing the hypothesis to
find out any inconsistent with previous findings. Their study shows that there is no relationship between VAICTM and its
components with market value. Ståhle, Ståhle, & Aho (2011) argue that VAICTM model has confusion in the calculation of
the structural capital and misapplication of IC concepts. Another one of the biggest arguments on VAICTM
method is the missing third component of IC which is the relational capital (Nimtrakoon, 2015). In the previous chapter, it has been explained the importance of relational capital as parts of IC creation. However, VAICTM method
has not yet included relational capital in the calculation. Many researchers believe the missing component of relational capital in the equation is what cause the inconsistency of the finding in IC research using VAICTM
method (Chang & Hsieh, 2011; Chang S. , 2007).
From these argumentations, it is clearly stated that VAICTM is not the final word in IC measurement. Therefore,
concerning with these limitations on the VAICTM model,
some researchers try to modify the original VAICTM model
becoming modified value added intellectual coefficient (MVAIC) by adding the relational capital into IC components to give more comprehensive measure and accurate valuation (Nimtrakoon, 2015; Ulum, Ghozali, & Purwanto, 2014). The MVAIC model will add relational capital efficiency (RCE) as part of ICE. Therefore using the MVAIC model, ICE will consist of three components which are HCE, SCE, and RCE.
As of now, there have only been a few researches in IC using MVAIC method. However, studies by Nimtrakoon (2015) and Ulum, Ghozali, & Purwanto (2014) show that there is a significant positive relationship between
company’s performance and IC using MVAIC model.
Ulum, Ghozali & Purwanto (2014) also argue that MVAIC model gives more accurate measurement and prediction of IC compared to the VAICTM model. Based on these
argumentations, this research will also use MVAIC model instead of the VAICTM model to measure IC.
Profitability
102 Profit refers to financial gain by the firms obtained from the total revenue minus total cost (Gans, King, Stonecash, Byford, Libich, & Mankiw, 2014).
To help measure the profit earned by the company and
to discover the increase or decrease of firm’s profitability,
profitability ratios are being used. Profitability ratios are measured using the reference of the firm sales, total assets employed, shareholder’s funds, and etc (Bhattacharya, 2008). Gitman and Zutter (2015) mention that there are six indicators in profitability ratios which are return on assets (ROA), return on equity (ROE), net profit margin (NPM), operating profit margin (OPM), gross profit margin (GPM), and earning per share (EPS). These ratios are the most common indicators used to measure the profitability of a company.
Lesáková (2007), however, argues that ROE is not a reliable indicator to measure the profitability of a company because ROE has timing problem, risk problem, and value problem. Timing problem refers to the biased result of the financial performance because of the misleading of time during the calculation such as when introducing new product or project that involve high start-up cost. Risk problem refers to the inaccuracy of the financial performance indicator because ROE does not explain the risk involved by the company to generate its ROE. Lastly, value problem means that the indicator uses the book value of the equity, not the market value which does not truly reflect the return on investment to shareholders. Moreover, Hawawini and Viallet (2010) also argue that ROE model calculation can be altered easily by changing the structure of the debt and equity to increase the value of ROE. Therefore, using ROE as an indicator might be misleading and biased.
Golin & Delhaise (2013) also mention the disadvantage of using ROA as an indicator of profitability is because ROA does not take into account the intrinsic risk associated with the assets. It means that the ratio does not give indication how those assets were financed. Besides that, some other disadvantage of using ROA is because total assets are calculated using carrying value which means if there is a large discrepancy of the carrying value and the market value of the asset, then the number will be misleading (Boundless, 2016). As such, this research will not adopt ROA and ROE as the representative of profitability.
Alternatively, this research will adopt OPM as the indicator of profitability instead of ROA and ROE and also discard GPM and NPM because this research wants to focus more on operational efficiency. Since this research focus on retail industry, then the analysis of profitability using GPM will not be meaningful. Retail works as an intermediary between manufacturers and consumers, they purchase goods from producer and resell them to the consumer at a higher price (Productivity Commission, 2011). Therefore, retailers do not have much control on their cost of good sold (COGS) since it is highly dependent on the price set by the manufacturers. As a result, GPM can not truly reflect profitability in the retail industry. This research will also not use NPM because most of the cost structure in the retail industry is used for operational activities (rent, labor wages, marketing, distribution) instead of depreciation and interest
expenses (Mazzone & Associates, 2015; D’Arcy, Norman, & Shan, 2012).
Report written by Mazzone & Associates (2015) shows that the average net profit margin of retailer industry is only 3.5% due to huge burden from operation cost (rent, marketing, wages and etc.). A report by Ernst & Young LLP (2013) also mentions that retailers must pay attention to their cost, capital expenditure, and supply chain efficiency in order to be profitable. D’Arcy, Norman, & Shan (2012) also show that more than 30% of the cost structure in the retail industry is used for cost of doing business or operational activities (65% are COGS). This indicates the importance of operational efficiency in retail industry to be profitable. Therefore using OPM as the indicator of profitability in this research is more appropriate compared to GPM and NPM.
This research will also drop EPS indicator because the main objective of this research is to determine the operational efficiency of the firm which is more captured using OPM. Moreover, EPS is usally used only as an indicator to fulfill the interest of present or prospective shareholders instead of truly measuring the operational efficiency of the firms (Gitman & Zutter, 2015). From these argumentations, this research will only use OPM as the indicators to determine the
firm’s profitability.
Market Value
Market value refers to the overall values of shares issued by the firm (Nimtrakoon, 2015). It is used to determine the amount an individual need to pay to acquire firms in a certain period of time based on the reflection on the marketplace. Gittman and Zutter (2015) also suggest that
market value is used to reflect the stockholder’s assessment of all aspects of the firm’s past and expected future
performance of the firm.
To help measure market value, market ratios are being used. Market ratio is a measurement related to market value
by using firm’s current share price to certain accounting
values (Gitman & Zutter, 2015). Gittman and Zutter (2015) also mention that there are two market ratios to measure market value which are price per earning (P/E) ratio and market per book (M/B) ratio. P/E is calculated from market price diveded by earning per share while M/B is calculated from market value of equity divided by book value of equity. However, several researchers use Tobin’s Q instead of P/E ratio and M/B ratio indicator to measure market value (Coad & Rao, 2006; Berzkalne & Zelgalve, 2014). Tobin’s Q is used as a proxy for company value which was introduced by Tobin (1969). If Tobin’s Q is greater than one,
it indicates that the firm’s value is higher than the replacement cost of its assets, while if Tobin’s Q is lower than one, it indicates that the firm’s assets are higher than the value of the stock (Berzkalne & Zelgalve, 2014).
Tobin’s Q ratio and M/B ratio are similar to each other.
Varaiya, Kerin, and Weeks (1987) show that M/B ratio and
103 However, Pandey (2015) mentions that their ratio still differs in the denominator in which M/B ratio uses book
value while Tobin’s Q uses replacement cost of the assset.
Kim, Kwak & Lee (2010) mention that even though Tobin’s Q might give more accurate measurement of market value,
however, calculating Tobin’s Q is not easy because it
requires complicated calculation and computational inconvenience such as the replacement cost which requires consideration of various factors. Therefore researchers in IC
field decided to use M/B ratio instead of Tobin’s Q which is a simpler method to measure company’s market value
(Drobetz, Schillhofer, & Zimmermann, 2004; Nimtrakoon, 2015). This research will also use M/B ratio instead of
Tobin’s Q because there is still no accurate measurement for Tobin’s Q.
This research will also not use the P/E ratio as the indicator of market value because P/E focuses more on the amount investors are willing to pay for each dollar the firm earns (Gitman & Zutter, 2015). While this research focuses more on how much the market value a firm compared to their book value. Therefore based on these argumentations, the researcher will only use M/B ratio which is the ratio of market value of equity over its book value of equity as the indicator to measure market value.
Theoretical Framework
From the explanation above, the researcher believes that these concepts are related to each other. Past researchers have suggested that there is a relationship between IC and profitability of a company (Han Chang, 2009; Wong, Li, & Ku, 2015). Stewart (1997) mentions that IC is a knowledge that can transform raw material into wealth. Pulic (1998) also mentions that in a knowledge based economy, companies cannot increase profit by simply increasing production anymore, but business success depends on the company’s ability to create added value by increasing intelligence of the product as well as the services they provide. Thus, in order to do that, each of the components of IC will play a vital role in
improving company’s profitability and to add value. Human
capital that focuses on employee’s intelligence will be the
source of innovation and strategic renewal, structural capital that focuses on the structure of organization will help to improve business efficiency, while relational capital that focuses on external relationship (stakeholder) will be a way for the company to gain knowledge by continuously learning from the market (Bontis, 1998). Therefore, IC and its components will help companies to improve their profitability performance. A study by Wong, Li & Ku (2015) also suggest that companies with a higher IC efficiency tend to have a better profitability performance. This indicates that there is a causal relationship between IC and profitability of the company in which IC as the independent variable will affect the profitability as the dependent variable. In the previous section, the researcher also has explained the indicators that are being used to measure profitability is OPM.
Past researches also have suggested that there is a relationship between IC and market value of a company (Firer & Williams, 2003; Chen, Cheng, & Hwang, 2005;
Berzkalne & Zelgalve, 2014). A study by Lev (2003) indicates that since mid-1980s, there is a huge increase of
company’s market value compared to their book value. This differences between the market value and the book value are what Edvinsson and Malone (1997) called as IC. Maditinos, Chatzoudes, Tsairidis, & Theriou (2011) also mention that due to the inability of accounting standard to measure IC (intangible assets), the market will values companies with high IC (intangible assets) to be significantly higher compared to their book value. This is due to the ability of the
market to be able to see and capture the “invisible values”
within the companies that comprises of their human capital (e.g: CEO, COO, employee, etc), structural capital (e.g: patent, organization structure, etc) and relational capital (e.g: brand, reputation, etc) that are not well written or captured in the balance sheet (Sveiby K. E., 1998). Therefore, the higher the IC of the firms, the higher the market will value their companies. This indicates that there is a causal relationship between IC and market value of the company in which IC as the independent variable will affect the market value as the dependent variable. In the previous section, the researcher also has explained the indicator that is being used to measure market value is M/B ratio.
Based on the explanation above, the researcher has constructed a theoretical model that want to test the causal relationship between IC and profitability and market value. This theoretical model also has been improved from previous research by using the MVAIC model instead of VAICTM
model to measure the IC value. Moreover, this research will not apply a time-gap analysis since the researcher believe the
effect of IC toward company’s profitability and market value
will occur directly within one year. Furthermore, many past researchers in IC also do not consider a time-gap analysis in their researches (Nimtrakoon, 2015; Maditinos, Chatzoudes, Tsairidis, & Theriou, 2011; Wong, Li, & Ku, 2015). Figure below has summarized the conceptual model of this research which provides the causal relationship of the independent variable with the dependent variable.
Figure 1. Theoretical Framework
104 H1: MVAIC has a significance positive impact toward profitability
H1a: CEE has a significance positive impact toward profitability
H1b: ICE has a significance positive impact toward profitability
H2: MVAIC has a significance positive impact toward market value
H2a: CEE has a significance positive impact toward market value
H2b: ICE has a significance positive impact toward market value
H3: MVAIC components (CEE, HCE, SCE, RCE) individually has a significance positive impact on OPM
H4: MVAIC components (CEE, HCE, SCE, RCE) individually has a significance positive impact on M/B
RESEARCH METHOD
In this study, IC is broken down into 4 components which are CEE, HCE, SCE, and RCE. The calculation of MVAIC model is simply the sum of all its components. Below are summarized the calculation of MVAIC model adopted from Nimtrakoon (2015):
VA = OUT - IN CEE = VA/CE HCE = VA/HC SCE = SC/VA RCE = RC /VA ICE = HCE + SCE + RCE
MVAIC = CEE + ICE Where:
VA = Value added of a particular firm OUT = Total revenues
IN = Total expenses excluding employee costs CE = Capital Employed, measured by total assets - intangible assets
HC = Human Capital, measured by total employee expenditures
SC = Structural Capital, measured by VA - HC RC = Relational Capital, measured by marketing cost ICE = Intellectual Capital Efficiency
Some important notes regarding the formula is that total expense (IN) includes all of the expenses that are required to obtain all of the revenue (Ulum, Ghozali, & Purwanto, 2014). Therefore, it includes COGS, opeartional expese, as well as interest expense. Next, the calculation for capital employed also require the computational of intangible
assets. Intangible assets are taken from firm’s balance sheet
in asset section if any or if the company also have a goodwill in their assets.
For the dependent variables there are two variables which are operating profit margin and market to book ratio. The calculation and formula for those variables are as follow :
OPM = Operating Income / Net Sales
MB = Market Price per share of common stock / book value per share of common stock
The data collected in this research will be mainly taken
from the financial statement and its related notes of the firm’s
annual report. Beside annual report, the researcher will also obtain the data from IDX and other sources such as bloomberg, yahoo finance and reuters to collect additional information which is not written in the annual report.
For the data sampling, it is used to help researcher select a sufficient number of data to represent the whole population (Sekaran & Bougie, 2016). This research is intended to analyze retail companies that are listed in IDX from 2013-2016. Therefore, the population used in this research is all retail companies in Indonesia that are listed in IDX under the subsector of retail industry which have done initial public offering (IPO) before 2013. In 2016, there are 21 companies registered in IDX under the subsector of retail industry (IDX, 2016). Among those companies, there are only 16 companies that are eligible for this studies since two companies do not provide the required annual report for the study, two companies are suspended from IDX trading and one company has too little trading days due to suspension from IDX. The researcher has decided to use the whole population considering that the number of retail companies in Indonesia that are eligible for this study is already relatively small.
For the data analysis method, it will consist of five steps which are reliability & validity, regression model, assumption of multiple regression, testing for significance and coefficient of determination.
First is reliability and validity test. In order for the data to be used and processed, it must be both reliable and valid. Reliability is concerned whether the data are stable and consistent (Bryman, 2012). This means that the data are repeatable and always produce the same result. The data that
are taken for this study are mostly taken from firm’s
published annual reports, which are already audited by a qualified auditor. Aside from that, the researcher will also take relevant data from IDX, which is a certified national financial institution that operates and facilitate Indonesia stock exchange activity (IDX, 2015). Thus, it can be assured that all of the data taken for the purpose of this study are reliable. Validity is concerned whether a measure of concept really measures the concept itself (Bryman, 2012). The measurements of the concept used in this research are taken from a pioneer and a prominent researcher in IC field (Pulic, 1998), and its application has been applied by many researchers in IC field (Nimtrakoon, 2015; Maditinos, Chatzoudes, Tsairidis, & Theriou, 2011). Thus, it can be assured that the measurements of the concept in this study really measure the concept itself or in another word, it is valid.
Second is regression model. Regression model is defined as the equation that describes how the dependent variable is related to the independent variable and an error term (Anderson, Sweeney, Williams, Camm, & Cochran, 2014). This research will adopt a multiple regression model for each of hypothesis that will be tested. Below are the multiple regression models that will be applied in this research:
105 �� = Dependent variable
�� = Independent variable
a = Y-intercept, the estimation of Y when X = 0 bn = The slope of the line, the average changes of Y
for every changes of 1 unit in X ∋ = Error term
� = Number of Observation, i = 1, 2, …, I
� = Time series data, t = 1, 2, …, T
� = Number of independent variables
Third is the assumption of multiple regression. Lind, Marchal, and Wathen (2013) mention there are five assumptions that needs to be tested in multiple regression. Below are the assumption test that will be tested in this study. First test is normal distribution assumption test. This regression assumption said that the distribution of the residual value should follow a normal probability distribution (Lind, Marchal, & Wathen, 2013). The assumption test for the normal distribution test can be evaluated using the kurtosis value and the skewness value (Ghozali, 2013).
H0 : Residual value follow normal distribution H1 : Residual value does not follow normal distribution The evaluation criteria whether to reject the null hypothesis or not is by comparing the value of the Zskewness and Zkurtosis to the Z value in the normality table. If the Zskewness and Zkurtosis are lower than – Z table or bigger than +Z table under the 0.05 significance level, then the null hypothesis is rejected and the assumption is violated (Ghozali, 2013). Second test is linear relationship test. There is a need to have a straight line relationship between the dependent variable and the set of independent variables (Lind, Marchal, & Wathen, 2013). The assumption test for linearity can be evaluated using Lagrange Multiplier test (Ghozali, 2013).
H0 : There is linear relationship between X & Y H1 : There is no linear relationship between X & Y The evaluation criteria whether to reject the null hypothesis is by calculating and comparing the c2 calculation (n x R2)
with the c2 table. If the c2 calculation is higher than the c2 table
under the 0.05 significance level, then the null hypothesis is rejected and therefore the linearity assumption is not met (Ghozali, 2013). Third test is multicollinearity test. This assumption stated that the independent variables should not be correlated with each other (Lind, Marchal, & Wathen, 2013). The assumption test for multicollinearity can be evaluated using the tolerance value or the inflation factor (VIF) value (Ghozali, 2013). The evaluation criteria whether the data have multicollinearity is by looking at the tolerance value or the VIF value. If the tolerance value is above 0.10 or the VIF value below 10, then there is no multicollinearity (Ghozali, 2013). fourth test is autocorrelation test. Autocorrelation assumption stated that the successive observation of the dependent variable should not be correlated with each other (Lind, Marchal, & Wathen, 2013). The assumption test for autocorrelation can be evaluated using the Durbin Watson test (Ghozali, 2013).
H0 : There is no autocorrelation in residuals H1 : There is autocorrelation in residuals
The evaluation criteria whether to reject the null hypothesis is by looking at the durbin watson score. If the durbin watson
score is higher than the upper limit (du) and lower than 4-du under 5% significance level, then the null hypothesis can not be rejected and there is no autocorrelation (Ghozali, 2013). Last test is heteroscedasticity test. In the regression analysis, the variation around the regression equation have to be the same for all the values of the independent variables (Lind, Marchal, & Wathen, 2013). The assumption test for heteroscedasticity can be evaluated using Park Test analysis (Ghozali, 2013).
H0 : All of the variance are the same (Homoscedasticity)
H1 : All of the variance are not the same (Heteroscedasticity)
The evaluation criteria whether to reject the null hypothesis is by regressing the logarithm of the square of the residual equation (Ln U2i) to the independent variables. If all of the significance value of the t-tests (independent variables) are above 0.05, then the null hypothesis can not be rejected (Ghozali, 2013).
The fourth step is testing for significance. In regression analysis, a researcher needs to test the significance of the regression model and each of the individual regression coefficients (Lind, Marchal, & Wathen, 2013). F test refers to testing the regression model to see whether it is possible for all the independent variables to have zero regression coefficients to the dependent variable (Lind, Marchal, & Wathen, 2013). As such, the hypothesis for the F test is presented as:
H0: b1 = b2= …. = bn = 0
H1: Not all of the bn are 0
The evaluation criteria whether to reject the null hypothesis is to see the significance value of the F test in the ANOVA table. If the significance value of the F test is below 0.05, then the null hypothesis is rejected (Ghozali, 2013). T test refers to testing each of the independent variables individually to determine which of the independent variable regression coefficient may be zero and which of them are not (Lind, Marchal, & Wathen, 2013). As such, the hypothesis for the t test is presented as:
H0: bn = 0
H1: bn≠ 0
The evaluation criteria whether to reject the null hypothesis is by looking at the significance values of the t tests in the ANOVA table. If the significance values of the t tests are below 0.05, then the null hypothesis is rejected (Ghozali, 2013).
The last step is coefficient of determination. Lind, Marchal, and Wathen (2013) define coefficient of determination (R2) as the percent of variation in which the set
of the independent variables explain the dependent variable. Adjusted R2 will be used to determine the coefficient of
determination instead of R2 so that it will prevent R2 to
increase only because of the total number of the independent variables, and not because that the added independent variables are a good predictor. The value of the adjusted R2
lies between 0 to 1 and the closer the value of the adjusted R2
106
RESULTS AND DISCUSSION
Table 1. Descriptive Statistics
As displayed in the table, the data that are analyzed in this study only contains 40 number of data or equal to only 10 companies. The researcher has deleted six more companies from the population due to the value of the value added (VA) calculation for those companies are negative. Lazzolino & Laise (2013) mention that for the company to have value creation, VA must be able to cover wages and salaries (VA>HC), thus if the VA is negative or below HC, there is value destruction. As such, the researcher have deleted six companies who have negative value added from the data. Therefore in total, this research will have 40 number of data.
From the table, it can be seen that the mean score of MVAIC is 2.39, meaning that the retail companies in Indonesia managed to create value added of IDR 2.39 for every IDR 1 invested in the company. From the descriptive statistics, it also can be seen that HCE is the most influential component in creating value added for retail companies with a mean score of 1.72, while RCE is the least influential component in creating value added for retail companies with a mean score of 0.10. Furthermore, this research also manages to provide a result that is in line with the suggested theory in IC literature which stated that IC or intangible assets create more value added to the companies compared to tangible assets which can be shown by the mean score of ICE (2.16) that are above CEE (0.23) (Neef, Siesfeld, & Cefola, 1998; Pulic, 1998). .
For the dependent variables, the mean score of OPM is 0.054. For the MB ratio, it shows a mean score of 3.00, meaning that the market values retail companies in Indonesia three times higher compared to their book value. This result also aligns with the suggested theory in IC literature that mentions there is a hidden gap value between the market value and the book value shown by the mean score of MB (Edvinsson & Malone, 1997; Sveiby K. E., 1998).
The next findings is the regression model. Two regression model will be used to explain the relationship of MVAIC (CEE & ICE) to the dependent variables and two regression model will be used to explain the components of ICE (HCE, SCE, RCE) and CEE to the dependent variables. The regression model for the MVAIC are as follow:
Model 1:
��= + ����+ ���+ ���
Model 2:
�� = + ����+ ���+ ���
Model 1 is used to explain the regression of MVAIC components toward OPM while model 2 is used to explain the regression of MVAIC components toward M/B. Besides these models, the researcher also will test the components of MVAIC including the breakdown components of ICE toward the dependent variables. Therefore, the regression model for MVAIC breakdown are as follow:
Model 3:
�� = + ����+ ���+ ���
+ ���+ ���
Model 4:
�� = + ����+ ���+ ���
+ ���+ ���
Model 3 will be used to explain the relationship of the components of ICE and CEE toward OPM while model 4 will be used to explain the relationship of the components of ICE and CEE toward M/B.
The next findings is the assumption of multiple regression test. The first assumption test is normal distribution. Table 2 shows the result of the normal distribution test.
Table 2. Normal Distribution Assumption Test
From the table above, it can be seen that only model 1, 2, and 3 manage to pass the assumption test. However, model 4 do not manage to pass the test. Thus, the null hypothesis for model 4 are rejected which means the data for that model is not normally distributed. To fix the data from the normality assumption, transformation of data will be used for the model 4. Ghozali (2013) mentions there are two types of regression model to fix normality assumption, namely, semi-log regression model and double-log regression model. Therefore, to fix the normality, the researcher have transformed model 4 using semi-log regression model. Below is the result of the model 3 after transforming the model.
Table 3. Normal Distribution Assumption Test after Transformation of Data
From the table above, it can be seen that after the transformation of data, model 4 now pass the normal distribution assumption test. Therefore, through this treatment, the null hypothesis can be accepted and all of the data in the model are normally distributed. From here onward, model 4 will now be using the semi-log regression model for the continous analytical procedure test.
107 Based on the table above, it can be seen that all four models of the regression pass the linear relationship assumption. Therefore, no null hypothesis of the model can be rejected and all of the regression model have a linear relationship.
The third assumption test is multicollinearity. Table 5 shows the result of the multicollinearity assumption test. From the table below, it can be seen that all four model have tolerance level above 0.10 and VIF below 10 (Ghozali, 2013), therefore all of the model pass the multicollinearity assumption.
Table 5. Multicollinearity Assumption Test
The fourth assumption test is autocorrelation. Table 6 shows the autocorrelation assumption test.
Table 6. Autocorrelation Assumption Test
From the table, it can be seen that all of the model’s
durbin watson score lies in the range of the du and 4-du (Ghozali, 2013). Therefore, the null hypothesis can not be rejected and all of the model pass the autocorrelation assumption test. The last assu,mption test is heteroscedasticity. Table 7 shows the result of the heteroscedasticity assumption test.
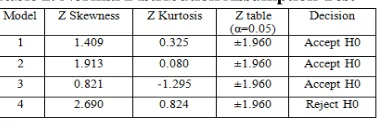
Table 7. Heteroscedasticity Assumption Test
From the table above, it can be seen that model 1 and 3 accept the null hypothesis for the heteroscedasticity assumption test. However, since model 2 and 4 have a significant variable in their model, they both fail to accept the null hypothesis for the heteroscedasticity assumption, thus, their data are not homoscedasticity. To fix the data from heteroscedasticity, regression using robust standard error in Stata software will be used for model 2 and 4. Regression using robust standard error is an estimator or a statistical procedure to produce useful information for a data that do not met with the assumption for the regression model (Fox & Weisberg, 2013). Therefore, to fix the heteroscedasticity assumption in model 2 and 4, both of these model will be regressed with a robust standard error.
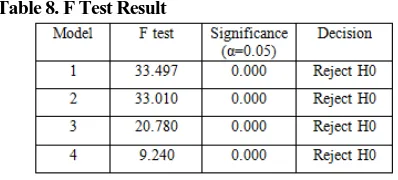
The next findings is the testing for significance test. Before looking at the individual variable, it is necessary to look whether the model as a whole are significant or not. In order to do that, F test analysis will be used. Below are the results of the F test for all of the model:
Table 8. F Test Result
From the table above, it can be seen that all model manage to reject the null hypothesis for the F test since all of their significance level are below 0.05. From the result, it can be seen that the model for CEE and ICE are significant toward OPM and MB. Moreover, model for the components of ICE (HCE, SCE, RCE) and CEE also are significant toward OPM and MB.
108 The regression model and the result of the t test for each of the model are as follow:
Model 1:
��= + ����+ ���+ ���
Model 2:
�� = + ����+ ���+ ���
Model 3:
��= + ����+ ���+ ���
+ ���+ ���
Model 4:
�_ ��= + ����+ ���+ ���
+ ���+ ���
Table 9. T Test Result
From the table above, it can be seen that for model 1, both CEE and ICE manage to reject the null hypothesis. For model 2, only CEE manages to reject the null hypothesis. For model 3, both CEE and SCE reject the null hypothesis but not HCE and RCE. Lastly, for model 4, only RCE failed to reject the null hypothesis while CEE, HCE and SCE manage to reject the null hypothesis.
The last findings is the coefficient of determination. The final statistical step is to check the coefficient of determination to see how much the independent variables manage to explain the dependent variable in the model. Below is the coefficient of determination for each of the model represented by the adjusted R square:
Table 10. Adjusted R Square
As can be seen in the table, MVAIC can explain OPM by 62.50% while for M/B, MVAIC manage to explain by 48.58%. For the components of IChenCE and CEE, it manage to explain OPM by 67.00% and it manage to explain M/B by 47.99%.
Based on the findings that have been stated above, here are the summary discussion for the results. The first
discussion is the impact of IC toward firm’s profitability.
From the previous section, the researcher has mentioned that OPM will be the representative to measure profitability (Model 1 & 3). From the findings in model 1, it is found that MVAIC which consist of CEE and ICE has a strong significant impact toward profitability which is represented by OPM. This result is consistent with the theory and previous findings of Nimrtakoon (2015), Chen, Cheng & Hwang (2005), and Rona & Almilia (2013). The test also shows that each of the component of MVAIC are also significant toward profitability. Both CEE and ICE have a strong significant positive impact toward OPM. Thus it can be concluded that both capital investment and intellectual capital investment can improve firm’s profitability. The coefficient for CEE and ICE are 0.757 and 0.349 respectively. It means that for every unit invested in CEE and ICE, it will increase OPM by 0.757 and 0.349 respectively.
From these result, it is proven that intellectual capital is
important in driving firm’s profitability. However, it is also
important to know which of the components of IC really
contributes in improving the firm’s profitability. Therefore,
model 3 is conducted to find these answers. From the statistical test, it is shown that only CEE and SCE have a
significant impact toward company’s profitability. This
study, however, shows a different result with the findings of Nimtrakoon (2015) and Chen, Cheng & Hwang (2005) in which they find only CEE and HCE as part of the
components of IC have signficant impact toward company’s
profitability. The different result might have been explained due to the profitability that they used is ROA, while this research uses OPM as the representative of the profitability. OPM focuses more on operational and business efficiency that relies more on SCE rather than innovation and strategic renewal that focuses on HCE (see section 2.2.2). Meanwhile, ROA focuses more on how the management utilize its asset to earn profit which relies more on innovation and strategic renewal of HCE rather than SCE (Gitman & Zutter, 2015; Bontis, 1998). The correlation coefficient for CEE and SCE are 0.656 and 0.729 respectively. It shows that OPM will increase by 0.656 unit for every unit invested in CEE and 0.729 unit for every unit invested in SCE.
This study, however, fails to detect any relationship
between RCE and firm’s profitability. This result is also consistent with previous studies (Nimtrakoon, 2015; Chen, Cheng, & Hwang, 2005). Chen, Cheng & Hwang (2005) mention that the possible reason why RCE does not have any significant impact toward profitability is because advertising expenditure are expensed when incurred therefore it reduces
the firm’s net income for the current year which may result
in more inferior financial performance. Chen, Cheng & Hwang (2005) also mention that there is a possibility that advertising expense is not a good proxy for relational capital. Therefore, based on the findings and discussion, it can be concluded that both capital investment (CEE) and IC have a significant positive impact toward profitability while only SCE as part of components of IC has a significant positive
impact toward firm’s profitability.
The second discussion is the impact of IC toward
109 MVAIC that consist of CEE and ICE has a significant impact toward market value. This result is consistent with the previous studies of Nimtrakoon (2015). However, it turns out that for the MVAIC model, only CEE has a significant
impact toward firm’s market value while ICE does not have any significant impact toward firm’s market value. This
means that only capital investment has significant impact
toward firm’s market value but not IC investment. This result is consistent with previous studies of Maditinos, Chatzoudes, Tsairidis & Theriou (2011) in which they also fail to detect
any relationship between IC toward firm’s market value. One
possible reason that may cause this result is because IC data are not readily available for public which might make IC not become the consideration for investor in making decision in which companies they want to invest in (Chu, Chan, & Wu, 2011). Maditinos, Chatzoudes, Tsairidis & Theriou (2011) also mention another possible reason is because market value is highly influenced by the sentiment of the market and external influences such as investor risk avoidance which cause them to ignore the financial reality of the company even though they might had improved financial results.
However, the result test of the breakdown component of ICE (HCE, SCE, RCE) and CEE toward MB in model 4 shows contradicting result with the test result in model 2. The regression model for the breakdown components of ICE shows a significant result. This contradicting result is also consistent with the previous study of Chen, Cheng, & Hwang (2005) in which their findings shows that in the wholesale and retail industry, the VAIC model shows an insignificant impact toward MB ratio but the breakdown components of ICE model shows a significant impact toward MB ratio. This contradicting result might have been caused due to ICE model as one independent is not a good predictor for MB ratio, however, when the model is broken down into its components, they become a better predictor since the variables are more diverse than before which can be seen from the significant test result in model 4.
From the findings, it can be seen that CEE, HCE and SCE give a significant impact toward MB ratio. This result is consistent with the previous study by Nimtrakoon (2015) and Chen, Cheng and Hwang (2005) in which they also manage to find that only CEE, HCE and SCE give a significant impact toward MB ratio. A study by Wang (2008) also manage to find that CEE, HCE and SCE have a significant impact toward MB ratio. Both of their studies, however, also failed to detect any significance result of RCE toward MB ratio. Chen, Cheng and Hwang (2005) mentioned that the possible reason why RCE is not significant is because advertising expense is not a good proxy for relational capital.
The`coefficient for CEE and HCE are 4.892 and 0.671 respectively, while SCE shows a contradicting result in producing a negative correlation with the coefficient of -2.617. This indicates that investors have negative reaction toward companies that invest heavily in their structural capital. One possible reason is because nowadays, investor (institutional investors and asset managers) focuses more on short term profits (faster earning per share target) rather than long term profits which restrict the options for listed companies when it comes to innovation, investment and
growth (SCE) (Andringa, et al., 2015). The coefficient result shows that MB will increase by 489.20% for every unit invested in CEE, 67.1% for every unit invested in HCE and decrease by 261.70% for every unit invested in SCE.
Based on these findings and argumentations, this study has found that market value is not affected by ICE as a whole but it is affected by the components of ICE in which only
HCE and SCE can significantly affect company’s market
value. This study also found that capital and physical investment (CEE) still have a significance positive impact toward firm’s market value.
CONCLUSION
IC is increasingly recognized as the company’s value
driver for wealth creation in order to create competitive advantage in the new knowledge economy era (Pulic, 1998; Neef, Siesfeld, & Cefola, 1998). This current study has contributed to IC literature by giving the empirical result of
the impact of IC toward firm’s profitability and market value
in the retail industry in Indonesia. This current study also has provided the empirical result using the MVAIC model which has not been applied widely in IC researches. This research has found and confirmed that IC has a significant impact
toward firm’s profitability. It is found that IC have a positive
relationship with profitability that is represented by OPM. The findings also shows that IC components that have significant impact toward profitability is only SCE. Besides that, it is also found that beside IC, capital and physical investment (CEE) is also still have a significant impact in
improving company’s profitability. The findings, however,
fail to detect any relationship between HCE and RCE toward
firm’s profitability. This research also has found a
contradicting result of IC toward firm’s market value. The
findings show that IC has no significant impact toward market value. However, the breakdown components of IC have significant impact toward market value in which only HCE and SCE have an impact toward market value. Besides that, it is also found that capital and physical investment (CEE) is also still have a significant impact in improving
company’s market value. The findings, however, fail to detect any relationship between RCE toward firm’s market
value.
110 final measurement method of IC and it is still a developing concept in IC literature, therefore this study might produce result that are inconsistnet with the suggested theory such as
the insignificant result of RCE toward firm’s profitability and
market value.
Concerning with the limitation, there are still many improvements that can be made for further research in IC field. First, future research should try to capture more than just one industry that relies on knowledge intensive sector. By applying more than one knowledge intensive sector will resulted on a more comprehensive result and further insights. Moreover, those research can now compare between one industry and the other so that the research can identify whether specific industry relies more on IC investment or required a specific IC components to help them improve their performance and market value. Second, by applying more sector and industry, the research will be able to gather more data sample which might produce a better and more comprehensive result. Lastly, as the researcher have mention before that IC is still a developing concept, therefore future research should explore more to develop and modify the current model such as finding a better representative for relational capital because this research failed to find any significant impact of RCE toward firm’s profitability and market value.
REFERENCES
Alma, Ö. (2011). Comparison of Robust Regression Methods in Linear Regression. Int. J. Contemp. Math. Sciences, 6(9), 409-421. Anderson, D., Sweeney, D., Williams, T., Camm, J.,
& Cochran, J. (2014). Essentials of Statistics for Business and Economics (7 ed.). Cengage Learning.
Andringa, M., Balk, R., Bergen, E., Cartigny, G., Clijsen, H., Dijkstra, L., et al. (2015). Short-term profit or long-Short-term value? Investment with a focus on the long term.
Beleggingsprofessionals Journal. AT Kearney. (2013). The 2013 Global Retail
Development Index: Global Retail Expansion at a Crossroads. AT Kearney.
AT Kearney. (2016). The 2016 Global Retail
Development Index: Global Retail Expansion at a Crossroads. AT Kearney.
Atan, N., & Sofian, S. (2014). Implication of Relational Capital and Structural Capital. International Conference on Postgraduate Research 2014 (ICPR 2014), 474 - 484. Badan Pusat Statistik. (2015). Produk Domestik Bruto
Atas Dasar Harga Berlaku Menurut Lapangan Usaha (Miliar Rupiah), 2000-2014. Badan Pusat Statistik.
Bank Indonesia. (2016). Retail Sales Survey. Bank Indonesia.
Berzkalne, I., & Zelgalve, E. (2014). Intellectual Capital and Company Value. Procedia -
Social and Behavioral Sciences, 110, 887-896.
Bhattacharya, K. (2008). Rameshan, P. Wto, India and Emerging areas of Trade: Challenges and Strategies. New Delhi: Excel Books, 337 P. ISBN: 978-81 -7446-593-1. Price: Rs. 495. A Journal of Management Research, 7(1).
Boekestein, B. (2006). The relation between intellectual capital and intangible assets of pharmaceutical companies. Journal of Intellectual Capital, 7(2), 241 - 253. Bontis, N. (1998). Intellectual capital: an exploratory
study that develops measures and models. Management Decision, 36(2), 63-76. Boundless. (2016). Return on Total Assets. Boundless
Finance.
Brockman, J. (2014, April 15). Indonesian services sector finds its voice. International Trade Forum , 2014(1), 2.
Bryman, A. (2012). Social Research Methods (4 ed.). Oxford: Oxford University Press.
Bukowitz, W., & Willams, R. (2000). The Knowledge Management Fieldbook. London: Financial Times Prentice Hall.
Chang, S. (2007). Valuing Intellectual Capital and Firms' Performance: Modifying Value Added Intellectual Coefficient (VAIC(TM)) in Taiwan IT Industry.
Chang, W., & Hsieh, J. (2011, February). Intellectual Capital and Value Creation-Is Innovation Capital a Missing Link? IJBM, 6(2). Chen, J., Zhu, Z., & Xie, H. (2004). Measuring
intellectual capital: a new model and empirical study. Journal of Intellectual Capital, 5(1), 195 - 212.
Chen, M. C., Cheng, S. J., & Hwang, Y. (2005). An empirical investigation of the relationship between intellectual capital and firms’ market value and financial performance. Journal of Intellectual Capital, 6(2), 159-176.
Chu, S., Chan, K., & Wu, W. (2011). Charting Intellectual Capital performance of The Gateway to China. Journal of Intellectual Capital, 12(2), 249-276.
Coad, A., & Rao, R. (2006). Innovation and market value: a quantile regression analysis . Economics Bulletin, 15(13), 1-10.
D’Arcy, P., Norman, D., & Shan, S. (2012). Costs and Margins in the Retail Supply Chain. Reserve bank of Australia.
Drobetz, W., Schillhofer, A., & Zimmermann, H. (2004). Corporate Governance and Expected Stock Returns: Evidence from Germany. European Financial Management, 10(2), 267–293.