Full Terms & Conditions of access and use can be found at
http://www.tandfonline.com/action/journalInformation?journalCode=cbie20
Download by: [Universitas Maritim Raja Ali Haji] Date: 17 January 2016, At: 23:17
Bulletin of Indonesian Economic Studies
ISSN: 0007-4918 (Print) 1472-7234 (Online) Journal homepage: http://www.tandfonline.com/loi/cbie20
Urban Shopping Patterns in Indonesia and Their
Implications for Small Farmers
Nicholas Minot, Randy Stringer, Wendy J. Umberger & Wahida Maghraby
To cite this article: Nicholas Minot, Randy Stringer, Wendy J. Umberger & Wahida Maghraby (2015) Urban Shopping Patterns in Indonesia and Their Implications for Small Farmers, Bulletin of Indonesian Economic Studies, 51:3, 375-388, DOI: 10.1080/00074918.2015.1104410
To link to this article: http://dx.doi.org/10.1080/00074918.2015.1104410
Published online: 29 Nov 2015.
Submit your article to this journal
Article views: 60
View related articles
ISSN 0007-4918 print/ISSN 1472-7234 online/15/000375-14 © 2015 Indonesia Project ANU http://dx.doi.org/10.1080/00074918.2015.1104410
* This article was made possible by inancial support from the Australian Centre for Inter -national Agricultural Research. All views, interpretations, and conclusions expressed are those of the authors and not necessarily those of the supporting or cooperating institutions.
URBAN SHOPPING PATTERNS IN INDONESIA AND
THEIR IMPLICATIONS FOR SMALL FARMERS
Nicholas Minot* Randy Stringer*
International Food Policy Research Institute University of Adelaide
Wendy J. Umberger* Wahida Maghraby*
University of Adelaide University of Adelaide
In developing countries, the expansion of supermarkets and other modern food retailers has raised concerns about the potential impact on traditional retailers and fruit and vegetable farmers. Will small farmers, in particular, be squeezed out of this growing, remunerative market by the quality standards imposed by super-markets? In an attempt to answer this question, we analyse data from a stratiied random sample of 1,180 urban households in Indonesia. We ind that only a small share of fruits and vegetables are purchased from modern outlets, even among high-income urban households. On the basis of the relation between income and shopping patterns in our data, we project that even after 15 years of income growth, super markets will account for less than 40% of urban food spending. The impact of super market standards on small farmers may be less dramatic than has been feared.
Keywords: food demand, supermarkets, traditional markets, small farmers JEL classiication: D12, F63, O13, Q13
INTRODUCTION
In recent decades, in most developing countries, the food-retail sector has trans-formed. Modern food outlets such as hypermarkets, supermarkets, and conveni-ence stores (mini-marts) have proliferated, while rising incomes have increased consumer demand for better food quality and safety, greater product diversity, and an improved shopping experience. In addition, urbanisation has helped make these advancements accessible to much of the population (Reardon et al. 2003).
Indonesia is no exception to these trends. Real per capita income in Indonesia has grown at 4.5% annually over the past 10 years, one of the highest rates in the region (World Bank 2015). The number of modern food-retail outlets in the country increased from 1 in 1977, to more than 1,000 in 1999, to 11,000 in 2009.
According to Euromonitor surveys, the share of food spending at such outlets
increased from 5% in 1999 to 11% in 2009 (Dyck, Woolverton, and Rangkuti 2012).
Another report cited industry sources in estimating that the share of Indonesia’s
modern food-retail sector was 30% in 2007 (World Bank 2007).
The rapid rise of this sector has generated a number of concerns, including
whether the sector’s growth is displacing traditional retailers, causing hardship
among traders and shop owners, and whether the expansion of modern food-retail outlets is squeezing small farmers out of the supply chain. Supermarkets often establish structured supply chains with quality and quantity requirements
that small farmers have dificulty meeting (Chowdhury, Gulati, and Gumbira-Sa’id 2005; World Bank 2007).
In the case of horticulture, there are also concerns about import competition. The share of imports in the volume of domestic supply is small but growing,
hav-ing risen, for vegetable imports, from 5.1% in 2005 to 7.1% in 2012. Over the same period, the import share of fruits rose from 3.6% to 5.0% (FAO 2015). In 2012, the
government of Indonesia began to impose restrictions on the imports of
horticul-ture and meat products, leading to disputes being iled by the United States and New Zealand at the WTO (WTO press release, 8 May 2014). The issue of import
competition is linked to the transformation of the retail sector because large, mod-ern retailers often facilitate the distribution of imported goods.
In this article, we examine shopping patterns in urban Indonesia, focusing on the household-level determinants of the use of modern food-retail outlets. We generate projections of the share of urban food expenditure allocated to such out-lets over time, and we discuss the implications of the patterns and pace of growth in the sector for traditional retailers and small farmers. We are interested, in par-ticular, in testing the view that the growth of modern retail outlets, with their quality and quantity standards, threatens the livelihoods of small farmers by lim-iting their access to this remunerative, growing market.
DATA AND METHODS
Data
From November 2010 to February 2011, we coordinated a survey of 1,180 urban households in three cities in Indonesia: Surabaya, Bogor, and Surakarta (Solo), chosen to represent large, medium, and small cities, respectively. In each city,
we used stratiied random sampling to select households, while oversampling
higher-income neighbourhoods and areas close to supermarkets. The sample design varied by city because of different amounts of information in each. We calculated sampling weights on the basis of the inverse of the probability of selec-tion, and used these weights in calculating the results presented here.
Cities in Indonesia are divided, from largest to smallest, into kecamatan (sub-districts), kelurahan (neighbourhoods), and the neighbourhood administrative units rukun warga (RW) and rukun tetangga (RT). In Surabaya, we selected 20
neighbourhoods at random and stratiied to oversample those within one kilo -metre of a supermarket. In each of these neighbourhoods, we selected two RTs at random but oversampled high-income RTs. We then chose 15 households from lists of resident households in each of these RTs, making a total of 600 households in Surabaya. In Bogor, we selected 20 neighbourhoods at random, stratifying to oversample those with a supermarket. In each, we chose two RTs at random but
again oversampled high-income RTs. We then chose 7 households at random, for a sample of 280 households in Bogor. In Surakarta, using area sampling, we
selected 15 RWs at random. Of these, we selected 25 RTs at random, oversampling
high-income areas by choosing a larger share of RTs in the two higher-income RWs. In each of the 25 RTs, we chose a random sample of 12 households, for a sample of 300 households in Surakarta.
The survey questionnaire covered household composition, housing and asset ownership, shopping behaviour at different types of outlets, food expenditure patterns, perceptions of each type of food retailer, and perceptions of organic food. Following categories used by Dyck, Woolverton, and Rangkuti (2012), we
deine eight types of food retailer:
• Hypermarkets: Very large, modern stores with 10 or more cash registers.
Examples include multinational chains such as Carrefour, Giant, and Makro,
and Indonesian chains such as Hypermart.
• Supermarkets: Large, modern stores with between three and nine cash
registers. Examples include chains such as Hero, Matahari, Asia, and Yogya,
although independent supermarkets exist as well.
• Mini-marts, or convenience stores: Small, modern stores with one or two cash registers. Alfamart and Indomart are two large chains of mini-marts in Indonesia.
• Warung, or small shops: Family-owned stores in any building, often in residential areas. They typically sell snacks, beverages, and dry goods.
• Semi-permanent stands: Vendors who sell from a table, stand, cart, or stall that can be moved but often stays in one place during the day. They often sell fresh fruits and vegetables.
• Traditional wet markets: Places where a large number of vendors can set up shop at tables or in stalls under a common roof. These markets are generally managed by the city.
• Peddlers: Vendors who move their products around the city on foot, by bicycle, or in a motorised cart. They often bring perishable goods into residential neighbourhoods or busy public areas.
• Other: Any source of food not listed above, most notably restaurants.
The irst three types are considered modern food retailers, while the last ive are
considered traditional retailers.
Methods
In this article, we examine the determinants of the share of urban food expenditure
allocated to modern food outlets, as deined above. About 23% of the households
in our sample did not report any spending at such outlets, so the dependent vari-able has a large number of zero values. An ordinary least-squares model would predict negative expenditure shares for low-income households, but, since shares cannot be negative, the error term will be positive for low-income households. The correlation between the error term and an independent variable implies that
the income coeficient estimated using this model would be biased.
One alternative is to use Tobin’s (1958) probit, or Tobit, model, which assumes
that the independent variables estimate a latent variable. The observed variable
is truncated at zero whenever the latent variable is negative. One limitation of the
Tobit model is that the same process is used to estimate both the probability that the dependent variable is positive and the conditional value of the dependent variable.
The Cragg (1971) double-hurdle model is based on the idea that there are two
distinct decisions, each with its own determinants. The irst ‘hurdle’ is the deci -sion on whether to participate or, in this case, whether to shop at a modern outlet.
The second ‘hurdle’ is the decision on how much to purchase, or, in this case, how
much of the food budget to allocate to modern outlets. We estimate these
deci-sions simultaneously, using maximum likelihood methods, though the irst deci -sion is equivalent to a probit model of the deci-sion to participate. Unlike the Tobit model, the Cragg model allows the parameter estimates explaining participation and quantity to differ. The explanatory variables include per capita expenditure, household characteristics, travel time to the nearest modern food-retail outlet, and ownership of a refrigerator or motor vehicle. The z-statistic determines the
statistical signiicance of each coeficient.
We also project urban food spending at modern retail outlets from 2010 (when
the survey was carried out) to 2025. We base our projections on a simpliied ver -sion of the Cragg model—that is, we limit the explanatory variables to per capita expenditure and per capita expenditure squared—as well as projections of income growth and urban population growth, and our estimates of the relation between income and food share. It is preferable not to control for asset ownership, educa-tion, and the other explanatory variables, since these will change over time. The implicit assumption is that each of these variables has the same relationship with
income over time as it does across income groups in the survey. Our projections
assume that per capita income grows by 4.5% per year, the average growth rate over the most recent decade (2003–14) for which data are available (World Bank 2015). They also assume that the urban population will grow by 2.1% per year, on
the basis of UN DESA (2011) projections for 2010–25. We determine projections
of the food share by using projected income growth and the estimated relation between income and food share in the survey data. We also test the sensitivity of the projections to changes in selected assumptions.
RESULTS
Urban Shopping Patterns
The survey collected information on household expenditure on 67 types of food products, and the retailer where the household buys most of each type. Here, we calculate the share of aggregate food spending at each type of retailer, not
the mean share across households, so these igures give greater weight to
higher-income households that spend more on food. In spite of the rapid expansion of supermarkets in Indonesia, warung continue to be the most important source of food, accounting for 31% of urban food expenditure. Traditional wet markets are second, responsible for 24% of urban food spending. Urban consumers spend about 19% of their food budget at modern food outlets, roughly split among hypermarkets, supermarkets, and mini-marts. This is considerably lower than the
World Bank’s (2007) estimate of 30% overall, which is based on industry sources
and includes urban and rural areas, but roughly in line with more recent estimates
by the US Department of Agriculture (Dyck, Woolverton, and Rangkuti 2012). Peddlers are surprisingly important, accounting for 11% of urban food expendi-ture, which is almost as much as hypermarkets and supermarkets combined.
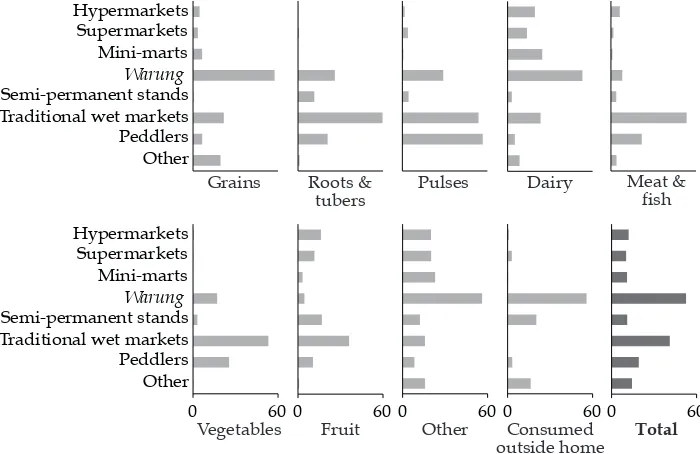
Figure 1 demonstrates how sharply this pattern varies for different types of food products. For roots and tubers, pulses, and vegetables, the three modern outlets account for less than 5% of urban expenditure. Again, this is lower than previous estimates of 10%–15%, which were based on industry sources (World
Bank 2007). Yet for dairy products, ‘other food’ (which includes many processed
foods), and fruit, modern outlets account for more than 30% of urban expendi-ture. Traditional wet markets attract about 50% of urban spending on vegetables,
meat and ish, and roots and tubers, while warung handle about 50% of the urban demand for grains (mainly rice) and meals consumed outside the home. Semi-permanent stands are relatively important sources of fruit and of meals consumed outside the home.
Looking at the disaggregated food products gives an idea of the types of prod-ucts purchased at each type of outlet. Modern retail outlets account for more than half the spending on infant formula, spreads, butter and margarine, apples, alco-holic beverages, breakfast cereal, processed meat, and other processed food. They
account for less than 5% of the spending on rice, potatoes, poultry, ish, onions,
tofu, tomatoes, garlic, chillies, shallots, leafy vegetables, and green beans. In gen-eral, households tend to buy processed foods at modern retail outlets, and meat,
ish, and vegetables at traditional outlets.
Apples are the only fresh produce to be purchased mostly at modern retailers (67%). Slightly less than half the oranges and other citrus fruit are purchased from
FIGURE 1 Share of Spending at Each Type of Retail Outlet on Each Type of Food (%)
Total
Source: Analysis of data from the authors’ 2010–11 survey of urban consumers.
modern retailers. For most tropical fruit, such as mangoes, papayas, bananas, mangosteens, and pineapples, modern retailers account for less than 10% of urban demand. These patterns may be related to the import share: almost all apples in Indonesia are imported, about 14% of oranges are imported, but virtually all
tropical fruits in Indonesia are locally produced (FAO 2015).
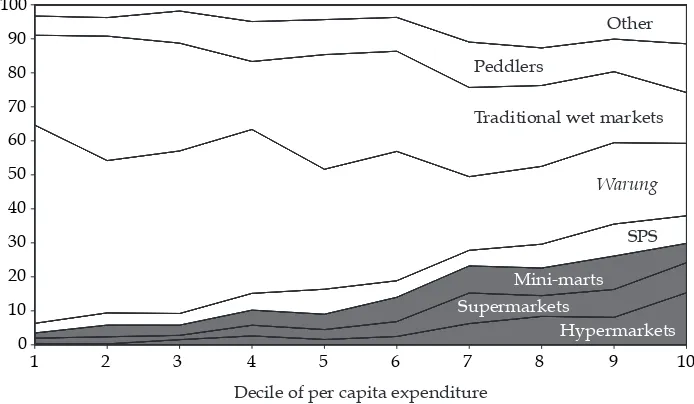
The share of food spending at modern retail outlets is also strongly related to household income. The survey included modules to collect information on food and non-food expenditure, as well as rent, which were used to calculate per capita expenditure (a proxy for income). Figure 2 shows that the share of food spending at modern retailers rises consistently across the per-capita-expenditure deciles. The households in the poorest decile, for example, spend just 4% of their food
budget at modern food outlets, but this rises to 8% in the ifth decile and 33% in
the richest decile.
From the poorest decile to the richest, the market share of warung falls from 58% to 21%, while that of traditional wet markets falls from 26% to 15% (though it exceeds 30% in three of the intermediate deciles). In contrast, the market share of
two ‘traditional’ retailers—peddlers and semi-permanent stands—rises gradually
across the deciles. Although peddlers are considered a traditional retail outlet, they provide a time-saving service and presumably sell at a somewhat higher price than other outlets. This makes peddlers appealing to households with a high opportunity cost of time. It is less clear why semi-permanent stands become more important in higher-income categories; it may be related to the demand for meals consumed outside the home, which account for about one-third of the spending at semi-permanent stands.
FIGURE 2 Share of Spending at Each Type of Retail Outlet by the Decile of per Capita Expenditure of the Household (%)
1 2 3 4 5 6 7 8 9 10
0 10 20 30 40 50 60 70 80 90 100
Hypermarkets Supermarkets
Mini-marts SPS Warung Traditional wet markets Peddlers
Other
Decile of per capita expenditure
Source: Analysis of data from the authors’ 2010–11 survey of urban consumers.
Note: The shaded area denotes modern food retailers. SPS = semi-permanent stands.
Determinants of Food Spending at Modern Outlets
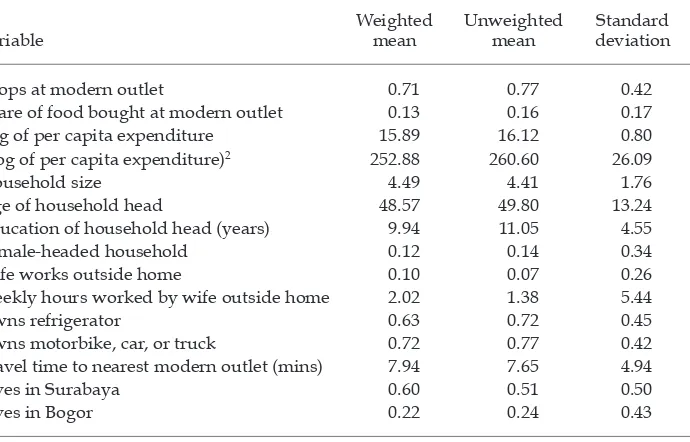
The explanatory variables in our Cragg double-hurdle model are the log of per capita expenditure, the square of the log of per capita expenditure, household size, the age of the household head, a dummy for a female-headed household, a dummy for a working wife, the interaction of a working wife and the number of hours she works per week, a dummy for refrigerator ownership, a dummy for vehicle ownership, travel time to a modern outlet, a dummy for households liv-ing in Surabaya, and a dummy for households livliv-ing in Bogor. Table 1 shows the weighted and unweighted means of the dependent and independent variables in the model. The weighted means take into account the sampling weights, so they describe the urban populations of the three cities. The unweighted means describe the sample itself, which over-represents households in high-income neighbourhoods near supermarkets.
The average share of food purchased at modern retailers is 13% (table 1).1 The average household size is about 4.5 members, 12% of households have a female head, and the average household head has about 10 years of education. Refrigerators are fairly common, owned by 63% of urban Indonesian households. Vehicles (most of which are motorbikes) are more common, owned by 72%. About 10% of wives work outside the home, and they work 20 hours a week, on average.
1. This igure differs from the igure in the previous section (19%) because this igure is the average of household shares, while the earlier igure was the share of overall food expendi -ture allocated to modern outlets. The latter igure gives more weight to households with higher food expenditure.
TABLE 1 Descriptive Statistics of Dependent and Independent Variables
Variable
Weighted mean
Unweighted mean
Standard deviation
Shops at modern outlet 0.71 0.77 0.42
Share of food bought at modern outlet 0.13 0.16 0.17 Log of per capita expenditure 15.89 16.12 0.80 (Log of per capita expenditure)2 252.88 260.60 26.09
Household size 4.49 4.41 1.76
Age of household head 48.57 49.80 13.24
Education of household head (years) 9.94 11.05 4.55
Female-headed household 0.12 0.14 0.34
Wife works outside home 0.10 0.07 0.26
Weekly hours worked by wife outside home 2.02 1.38 5.44
Owns refrigerator 0.63 0.72 0.45
Owns motorbike, car, or truck 0.72 0.77 0.42
Travel time to nearest modern outlet (mins) 7.94 7.65 4.94
Lives in Surabaya 0.60 0.51 0.50
Lives in Bogor 0.22 0.24 0.43
Source: Analysis of data from the authors’ 2010–11 survey of urban consumers.
The travel time to a modern retailer is just 8 minutes, on average, although the travel time to a supermarket (not shown) is close to 20 minutes.
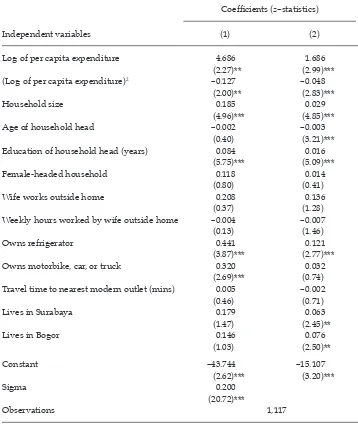
Table 2 shows the results of the Cragg double-hurdle model. The irst column
shows the model of the probability of shopping at a modern outlet, while the sec-ond shows the model of the share of food purchased at a modern outlet among
TABLE 2 Determinants of the Share of Food Spending Allocated to Modern Retailers
Independent variables
Coeficients (z–statistics)
(1) (2)
Log of per capita expenditure 4.686 1.686
(2.27)** (2.99)*** (Log of per capita expenditure)2 –0.127 –0.048
(2.00)** (2.83)***
Household size 0.185 0.029
(4.96)*** (4.85)***
Age of household head –0.002 –0.003
(0.40) (3.21)***
Education of household head (years) 0.084 0.016 (5.75)*** (5.09)***
Female-headed household 0.118 0.014
(0.80) (0.41)
Wife works outside home 0.208 0.136
(0.37) (1.28)
Weekly hours worked by wife outside home –0.004 –0.007
(0.13) (1.46)
Owns refrigerator 0.441 0.121
(3.87)*** (2.77)***
Owns motorbike, car, or truck 0.320 0.032
(2.69)*** (0.74) Travel time to nearest modern outlet (mins) 0.005 –0.002
(0.46) (0.71)
Lives in Surabaya 0.179 0.063
(1.47) (2.45)**
Lives in Bogor 0.146 0.076
(1.03) (2.50)**
Constant –43.744 –15.107
(2.62)*** (3.20)***
Sigma 0.200
(20.72)***
Observations 1,117
Source: Analysis of data from the authors’ 2010–11 survey of urban consumers.
Note: (1) Dependent variable = share of households that shop at a modern outlet. (2) Dependent vari-able = share of the food budget spent at a modern outlet among those that shop at modern outlets.
* p < 0.1; ** p < 0.05; *** p < 0.01.
those who use modern food retailers. Although table 2 identiies the independent variables that are signiicant predictors of shopping behaviour, it does not pro
-vide useful information on the size of the effect (because the coeficients do not
have intuitive interpretations). We therefore provide the average partial effect,
deined as the impact of a one-unit change in the independent variable on the
unconditional share of food expenditure allocated to modern retail outlets. This partial effect takes into account the effect of the independent variable on both the probability that the household shops at modern outlets and the share of the food budget spent at modern outlets among those households. Because the partial effect is a non-linear function of the independent variables, we give the average partial effect across the households in the sample. We calculate the standard error of the partial effect by using bootstrap methods, with 500 replications, and we use the variation across replications to estimate the standard error of the partial effect.
The results in table 2 suggest that per capita expenditure has a statistically
sig-niicant and positive effect on both the probability of shopping at a modern outlet
and the share of food purchased there (conditional on shopping at a modern out-let). This is not surprising, given the higher costs and greater amenities provided by supermarkets and other modern retailers. In both models, the quadratic term
is negative and statistically signiicant; the coeficients suggest that both curves
level off near the upper end of the range of per capita expenditure.
The partial effect of log per capita expenditure, which incorporates the effects
of the linear and quadratic coeficients, is 0.06. This means that a 1% increase in
per capita expenditure is associated with an increase of 0.06 percentage points in the share of the food budget spent at modern outlets. The share of food spend-ing at modern outlets is therefore risspend-ing with income, but only slowly. The small
partial effect relects the fact that, from the poorest decile to the richest, per capita
expenditure rises 12-fold, while the share of spending at modern outlets rises from 4% to 28%.
The coeficients on household size in the two models are positive and statisti
-cally signiicant. This implies that, after controlling for other household charac -teristics, larger households are more likely both to shop at a modern outlet and to spend a larger share of their food budget there. Since supermarkets tend to be
farther than traditional retailers from the average household, the higher ixed cost
of getting to a supermarket may be easier to justify if the household is planning to buy a large quantity of food.
The shopping patterns of female-headed households and households in which the wife works outside the home do not seem to differ from those of other house-holds, after taking into account income, education, and other variables. Nor is
the age of the household head a statistically signiicant factor in the decision to shop at a modern outlet, although it does have a signiicant effect on the share of food purchased at a modern outlet among those shopping there. The coeficient
is negative, indicating that younger shoppers spend a larger share of their food budget at modern outlets than older shoppers. The education of the household
head, however, is positively and signiicantly related to both the probability of
shopping at a modern outlet and the share of the food budget spent there, even
after holding income and other variables constant. This outcome could relect a
greater awareness of food quality and safety, or perhaps different social norms, among more educated consumers.
Owning a refrigerator is another positive and signiicant predictor of both the
likelihood of shopping at a modern retailer and the share of food purchased there. This is not surprising, given that having a refrigerator allows the household to make larger and less frequent shopping trips, which reduces the relative cost of
shopping at more distant supermarkets. Owning a vehicle (such as a motorbike,
car, or truck), on the other hand, is positively associated with the probability of using modern food retailers—having a vehicle presumably makes it easier to travel longer distances to a supermarket or hypermarket, for example—but not with greater spending at these retailers.
Somewhat surprisingly, travel time to the nearest modern outlet is not a
statisti-cally signiicant predictor of either the probability of using a modern outlet or the
share of the food budget spent at modern outlets. Similar results were obtained
with travel time to speciic types of modern outlets such as a supermarket or a
hypermarket. Travel time may not be a good measure of accessibility: a supermar-ket may be close to, or on the way to, a common destination, such as a workplace or school, making it easily accessible even if it is far from the home.
Households in Surabaya or Bogor are no more likely to shop at a modern out-let than those in Surakarta, but if they do shop at a modern outout-let they are more
likely to spend a larger share of their food budgets there. This may relect the
size of the city (Surakarta is the smallest of the three) or the fact that municipal authorities in Surakarta have sought to improve standards at traditional wet
mar-kets. After controlling for other factors, we ind that households in Surabaya and
Bogor allocate three percentage points more of their food budget to modern retail-ers than those in Surakarta.
Projections of the Share of Urban Food Expenditure at Modern Retailers
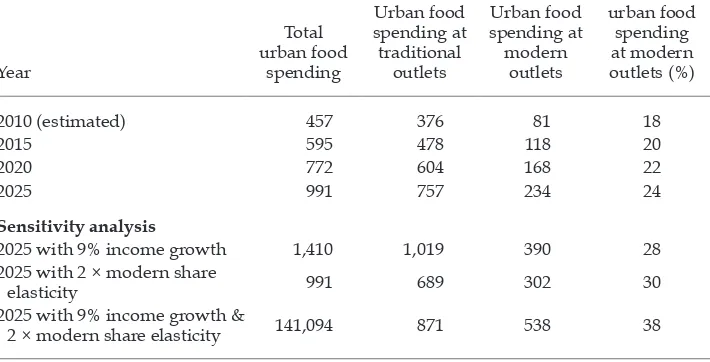
To project the growth of the urban modern food sector in Indonesia, we re-esti-mate the Cragg model in table 2 and limit the explanatory variables to per capita expenditure and per capita expenditure squared. We then estimate the share of food purchased at modern retail outlets on the basis of 4.5% annual growth in income (expenditure) for each household. Table 3 shows that the share of urban food purchased at modern retailers rises from 18% in 2010 to 24% in 2025. Given the projections of urban population growth and the decline in the food share in household budgets, this implies that aggregate urban food expenditure at mod-ern retailers rises from Rp 81 trillion in 2010 to Rp 234 trillion in 2025, implying
an annual growth rate of 7.3%. Over this period, food expenditure at traditional
retailers grows more slowly, at 4.8% annually, but aggregate spending at tradi-tional food retailers more than doubles.
Given the uncertainty about the assumptions behind these projections, we
examine the sensitivity of the results to different assumptions (table 3). We irst
assume annual growth in per capita income to be 9.0%, rather than 4.5%. This is an extreme assumption, given that Indonesia has achieved this rate of growth only three times in the past 50 years, but it serves as an upper bound on the speed of transformation of the modern retail sector. If per capita income were to grow at 9.0% annually between 2010 and 2025, the modern food share would rise to 28% in 2025, compared with 24% in the base scenario. Yet the overall demand for food would also grow faster, implying higher growth in food demand at both modern retailers (11.0%) and traditional retailers (6.9%).
If we doubled the elasticity of the modern retailer share with respect to income, the modern food share would rise to 30% in 2025. This would dampen the growth of traditional food retailers, but it would still increase by an average rate of 4.1% per year. If we combined higher (9.0%) income growth and the greater elasticity of modern food share with respect to income, the share of the modern food sector would reach 38% in 2025. Under these assumptions, urban food demand would grow by 13.5% per year for modern retailers and by 5.8% per year for traditional retailers.
IMPLICATIONS FOR SMALL FARMERS AND POLICY
Our results have several implications for the future of small farmers in Indonesia and
the traditional market channel. Small-scale vegetable growers are barely affected by the growth of supermarkets and other modern food retailers; urban consum-ers still prefer to buy fresh vegetables from traditional wet markets and peddlconsum-ers, which account for almost 80% of the vegetable purchases in larger cities. Warung
and semi-permanent stands account for most of the remainder, leaving hypermar-kets, supermarhypermar-kets, and mini-marts with a combined market share of less than 2%. This small share, combined with the demand for vegetables in smaller urban settle-ments and rural areas, where the share of modern retailers is even smaller, suggests that modern retailers play a negligible role in vegetable marketing.
This pattern is conirmed by the results of two farm surveys carried out by the authors. One survey covered 596 chilli farmers in the main chilli surplus zone in
TABLE 3 Projections of Urban Food Spending at Traditional and Modern Retail Outlets (Rp trillion)
Year
2010 (estimated) 457 376 81 18
2015 595 478 118 20
2020 772 604 168 22
2025 991 757 234 24
Sensitivity analysis
2025 with 9% income growth 1,410 1,019 390 28 2025 with 2 × modern share
elasticity 991 689 302 30
2025 with 9% income growth &
2 × modern share elasticity 141,094 871 538 38
Source: Analysis of data from the authors’ 2010–11 survey of urban consumers.
Note: The base scenario assumes per capita income growth of 4.5% and urban population growth of 2.1%. The urban food spending at traditional and modern outlets and the urban food share are based on the relation between income and these variables in the survey data, combined with the projected income growth. See the text for additional information.
the highlands of Java. Just 3% of the farmers interviewed reported that their chil-lies were being sold in a supermarket (Sahara et al. 2015). Another survey covered 662 randomly selected shallot growers in the highly commercial north coast of Java near Brebes (Wahida 2015). Among these farmers, just 3% reported that their shallots were being sold in a supermarket.
The impact of supermarkets on farmers is sometimes described as a double-edged sword: it gives farmers the opportunity to sell into a growing and more lucrative market, but it also threatens to exclude farmers if they cannot meet the
quality and quantity requirements imposed by supermarkets. Our indings, how -ever, suggest that vegetable farmers in Indonesia are not at risk of being squeezed out of growing modern channels any time soon. Yet very few of these farmers are
likely to beneit from the opportunity to increase the quality of their produce and
earn a better price by selling into the modern channel.
The story for fruit growers is similar. About 30% of fruit in urban areas is pur-chased from modern retailers. Yet the two fruits with the highest share purpur-chased at modern retailers are apples, almost all of which are imported, and citrus fruit,
which are both imported and locally produced. On the other hand, more than 90%
of the urban demand for tropical fruit (including mangoes, papayas, bananas, mangosteens, and pineapples) is channelled through traditional retailers—wet markets, semi-permanent stands, and peddlers, in particular. Like vegetable growers, hardly any local fruit growers have much contact or experience with supermarkets. This does not mean that the fruit sector is static; there is evidence of technical change and market transformation, but they are driven by competi-tive forces within the traditional marketing channel rather than by the growth of supermarkets and other modern retailers.
The growth of supermarkets may pose a threat to Indonesian fruit growers, not by taking over domestic supply chains but by developing and expanding inter-national supply chains that bring imported fruit into the country. Supermarkets facilitate consumer access to high-quality imports of citrus fruit, for example, thus challenging domestic producers. And although there are virtually no domestic apple producers, increased access to imported apples may replace some of the demand for locally grown tropical fruits.
There is also a concern that the growth of supermarkets and other modern retail-ers in Indonesia could squeeze out traditional retailretail-ers, including warung owners, wet-market vendors, and peddlers. This could create hardships for vendors in the
short- to medium-term, until they ind new employment. To the extent that super -markets are less capital-intensive than retailers in the traditional market channel, the growth of supermarkets could gradually decrease the demand for labour.
These concerns, however, are based on the assumption that the modern channel is large enough and growing fast enough to cause the traditional channel to
con-tract. Our analysis suggests that the traditional channel will continue to expand, although at a slower rate than the modern channel. More speciically, we expect
urban food expenditure at supermarkets and other modern retailers to expand by
about 7% per year over 2010–25. Over the same period, we project that urban food
expenditure at traditional retailers will grow by slightly less than 5% per year. In other words, although the traditional food channel is declining in market share, it will continue to grow at a healthy rate, thanks to rising income and an expanding urban population.
CONCLUSIONS
The effect of the growth of supermarkets on traditional retailers and fruit and vegetable farmers, and particularly on small farmers, has been the topic of some
debate. Modern retailers often impose strict quality standards that may be difi -cult for small farmers to meet, and often favour larger growers in order to reduce transaction costs (thus squeezing small farmers out of these growing modern sup-ply chains). At the same time, supermarkets provide an opportunity for small farmers to raise their incomes by supplying the modern channel, particularly if they can get inputs, credit, and technical assistance to help them meet the neces-sary quality standards. Another concern is that the rapid growth of supermarkets will displace traditional retailers, such as warung owners and wet-market vendors
(Chowdhury, Gulati, and Gumbira-Sa’id 2005).
According to our survey of 1,180 randomly selected urban households in three large cities of Indonesia, urban consumers spend about 31% of their food budget at warung, 24% at traditional wet markets, and 19% at modern outlets. This pat-tern varies greatly across income deciles: poor households spend little at mod-ern outlets (3% in the poorest decile) while high-income households spend much more (30% in the top deciles).
Our Cragg double-hurdle regression analysis indicates that the share of food
purchased at modern outlets is determined by a combination of income, hold size, the age and education of the household head, and whether the house-hold has a refrigerator. Surprisingly, distance and travel time to a modern outlet
do not have statistically signiicant effects on retailer choice.
The share of vegetables purchased at modern retail outlets is very small (less than 5%), suggesting that current supermarket standards or efforts to organise supply chains have a negligible effect on vegetable farmers. The share of fruit bought at modern outlets is somewhat higher (30%), though it is concentrated on a few imported fruits. The impact of supermarkets on local fruit growers has more to do with facilitating fruit imports than with forcing quality requirements on local farmers. In general, local fruit and vegetable growers are not at risk of being squeezed out of the market by the growth of supermarkets and other modern
retailers, but, at the same time, few of them are likely to beneit from this growth
in the medium term.
Urban food demand at modern retail outlets is growing rapidly, but not rap-idly enough to result in an absolute decline in food demand at traditional retail
outlets. On the basis of the results of the survey and our plausible assumptions,
urban food demand will grow by about 7% per year at modern retailers and by slightly less than 5% per year at traditional retailers. This suggests that the tran-sition from traditional to modern food retailing may be less disruptive than has been feared.
REFERENCES
Chowdhury, Shyamal K., Ashok Gulati, and E. Gumbira-Sa’id. 2005. ‘The Rise of Super -markets and Vertical Relationships in the Indonesian Food Value Chain: Causes and Consequences’. Asian Journal of Agriculture and Development 2 (1–2): 39–48.
Cragg, John. G. 1971. ‘Some Statistical Models for Limited Dependent Variables with Application to the Demand for Durable Goods’. Econometrica 39 (5): 829–44.
Dyck, John, Andrea E. Woolverton, and Fahwani Yuliati Rangkuti. 2012. Indonesia’s Mod -ern Food Retail Sector: Interaction with Changing Food Consumption and Trade Patt-erns. Economic Information Bulletin 97. Washington, DC: Economic Research Service, US Department of Agriculture.
FAO (Food and Agriculture Organization). 2015. ‘Food Balance Sheet’. http://faostat3.fao. org/download/FB/FBS/E.
Reardon, Thomas, C. Peter Timmer, Christopher B. Barrett, and Julio Berdegué. 2003. ‘The Rise of Supermarkets in Africa, Asia, and Latin America’. American Journal of Agricul -tural Economics 85 (5): 1140–46.
Sahara, Sahara, Nicholas Minot, Randy Stringer, and Wendy Umberger. 2015. ‘Determi-nants and Effects of Small Chilli Farmers’ Participation in Supermarket Channels in Indonesia’. Bulletin of Indonesian Economic Studies 51 (3): 445–60.
Tobin, James. 1958. ‘Estimation of Relationships for Limited Dependent Variables’. Econo-metrica 26 (1): 24–36.
UN DESA (United Nations Department of Economic and Social Affairs). 2011. World Urbanization Prospects: The 2011 Revision. New York: United Nations.
Wahida. 2015. ‘Food System Transformation in Indonesia: Factors Inluencing Demand and Supply for Alternative Pest Management Farming Systems’. PhD diss., Global Food Studies, University of Adelaide.
World Bank. 2007. Horticultural Producers and Supermarket Development in Indonesia. Report 38543-ID. Jakarta: World Bank.
———. 2015. World Development Indicators. Washington, DC: World Bank.