Full Terms & Conditions of access and use can be found at
http://www.tandfonline.com/action/journalInformation?journalCode=vjeb20
Download by: [Universitas Maritim Raja Ali Haji] Date: 11 January 2016, At: 20:46
Journal of Education for Business
ISSN: 0883-2323 (Print) 1940-3356 (Online) Journal homepage: http://www.tandfonline.com/loi/vjeb20
Developing and Teaching an Online MBA
Marketing Research Class: Implications for Online
Learning Effectiveness
Qin Sun & Gopala Ganesh
To cite this article: Qin Sun & Gopala Ganesh (2014) Developing and Teaching an Online MBA Marketing Research Class: Implications for Online Learning Effectiveness, Journal of Education for Business, 89:7, 337-345, DOI: 10.1080/08832323.2013.806885
To link to this article: http://dx.doi.org/10.1080/08832323.2013.806885
Published online: 29 Sep 2014.
Submit your article to this journal
Article views: 145
View related articles
View Crossmark data
Developing and Teaching an Online MBA
Marketing Research Class: Implications for Online
Learning Effectiveness
Qin Sun
Trident University International, Cypress, California, USA
Gopala Ganesh
University of North Texas, Denton, Texas, USA
The authors intend to describe the experience of developing and teaching an online marketing research class for master of business administration students. The class has been taught for four fall semesters. Each time, the class also completed an online survey, analyzed the resulting data, and wrote a detailed report for a real client. The course content, topic sequence, class assignments, and student feedback about the experience are all described in great detail herein. This web implementation incorporates several useful features such as a very large number of audio and video segments that have been used to teach difficult concepts like sampling and data analysis techniques. The implications for student online learning effectiveness conclude the remark.
Keywords: MBA education, marketing marketing research, online teaching, pedagogy
With the increasing popularity of online learning in higher education industry, more and more attention has been paid to the quality and effectiveness of online courses. In partic-ular, due to inadequate mathematics knowledge among master of business administration (MBA) students and the difficulty of delivering quantitative courses online, there is a need to provide empirical data to evaluate the feasibility of online statistics classes such as marketing research class required for Association to Advance Collegiate Schools of Business (AACSB)–accredited MBA program (Sebastia-nelli & Tamimi, 2011). Generally speaking, marketing research involves with systematic data collection and analy-sis for a particular market segment in order to improve deci-sion making in marketing (Malhotra, 2007). Therefore, it is not surprising that the teaching of marketing research has typically involved with topics introducing students to sour-ces of secondary and primary data, the issues in data collec-tion and the various techniques used for analyzing raw data and turning it into actionable and valuable information (Ganesh, 1992.) Although the marketing research course is
a required class for undergraduate and graduate marketing majors in most business schools, it imposes challenges to both students and professors, mainly because of its signifi-cant statistical and data analysis content (Bradstreet, 1996; Bridges, 1999; Castleberry, 2001; Dobni & Links, 2008; Giacobbe & Segal, 1994). In addition, hands-on experience in using the computer and statistical software such as SPSS (IBM, Armonk, NY), Minitab (Minitab Inc., State College, PA), and Excel (Microsoft, Seattle, WA) have been an inte-gral part of teaching marketing research (Bove & Davies, 2009), posing additional challenges to the students.
From the practitioners’ perspective, marketing research should be taught emphasizing the practice and quantitative analysis rather than the theory (Bellenger & Bernhardt, 1977). Higher caliber statistical coverage such as multivari-ate analysis is seen as necessary even in the undergradumultivari-ate marketing research course (Stern & Tseng, 2002). For the MBA marketing research class, canonical correlation, dis-criminant analysis, factor analysis, logit or probit regres-sion, multivariate analysis of variance (ANOVA), multiple regression, conjoint analysis, decision analysis, and multi-dimensional scaling are in the priority list of practitioners (Anderson, 1982). Due to the popularity of Internet and World Wide Web, distance learning and online education
Correspondence should be addressed to Qin Sun, Trident University International, College of Business Administration, 5757 Plaza Dr., Ste. 100, Cypress, CA 90630, USA. E-mail: [email protected]
ISSN: 0883-2323 print / 1940-3356 online DOI: 10.1080/08832323.2013.806885
are becoming popular platforms to teach college students (Steiner & Hyman, 2010) and the digital millennial college students are becoming more comfortable with the online teaching methods and online communities (Matulich, Papp, & Haytko, 2008). Again this backdrop, it is important to explore the online teaching of marketing research and the related learning effectiveness issues.
For several years now, marketing professors have been exploring ways to bring the rapid advances in information technology and the personal computer revolution for teach-ing marketteach-ing research. While Castleberry (2001) intro-duced hands-on project to sharpen students’ secondary data research skills using web and off-web sources, Malhotra, Dixit, and Uslay (2002) recommended the use of Internet technology in all aspects of marketing research education. High-tech electronic devices such as personal digital assis-tants and video cameras have been used in the undergradu-ate marketing research courses to conduct interviews and collect observational data (McGorry, 2006; Smith & Fisher, 2006). Multimedia and podcasting have also been tried to help the tech-savvy students effectively learn marketing research (Zahay & Fredricks, 2009) and simulations were used to teach international marketing research to under-graduates and MBA students with mostly positive feedback (Peterson, 2006).
Courses such as marketing research also provide ample opportunity to bridge the gap between theory and practice and apply what is learned in class to the real business situa-tions. For example, Bove and Davies (2009) used client-sponsored project in the graduate marketing research class over a three-year period and the positive student feedback acknowledged the practical benefits of the live case to the students’ research and consulting skills. Bhattacharya and Sheth (1996) designed the marketing research course with field project for cause-oriented nonprofit organization in order to instill social responsibility among undergraduate and graduate business students. This so called experiential learning is promoted and required by AACSB International to better prepare the business students for a career in the business professions (AACSB, 2003, Ganesh & Sun, 2009). Although there are debates on the effectiveness of online education, teaching marketing research via the Internet pro-vides a viable and flexible option, especially to U.S. gradu-ate students who are typically constrained by the time demands of their full-time jobs, commuting requirements, and sometimes by language constraints, as in the case of international students (Liu, Gomez, Khan, & Yen, 2007; Stewart, 2004). As a result, marketing professors have begun to teach this class online to undergraduate students (Steiner & Hyman, 2010). Even though there is a need to have an online marketing research course for MBA students, the advanced topics are difficult to handle in an online environ-ment, especially the significant hands-on components: client project, survey design, data collection, data analysis, and writing a report. In this article, we discuss the experience of
building and teaching an online MBA marketing research class at a large public university in the southwest United States, with the hope that this endeavor would benefit others contemplating similar or other forays online.
THE COURSE DESIGN
This online MBA-level marketing research course is unique in many ways, including its concept, execution and implementation. Basic familiarity with principles of mar-keting management and elementary business statistics are assumed. Incoming students are required to have com-pleted the core course in marketing and statistics. While the traditional face-to-face MBA marketing research class has been taught for a very long time, the online version has been offered only five times in the fall semester, as part of a fairly recent online MBA program. Data collec-tion took place during the first four semesters during which the enrollment ranged between 14–15 students a semester, typical for a MBA marketing elective class.
One of the fundamental objectives in designing the web course was to make its content nearly identical to the tradi-tional course. Therefore, the students would exit not only with a good overview of marketing research, but also enhanced interpretational quantitative skills essential for a managerial decision maker. They would be comfortable with concepts such as sampling methods, the factors that drive sample size including confidence intervals, and hand-on familiarity with advanced data analysis techniques. They would also brush up on effective communication through charts, graphs and good presentation through a liv-ing case market research project for a real client.
The mandatory textbook for the class was chosen after careful review of the available options for an MBA-level course. It would have substantial managerial, as opposed to mathematical, coverage of advanced statistical emphasis, written for SPSS-based data analysis and come with a good supply of datasets with adequate data for analysis and assignments. The authors settled on Malhotra’sMarketing Research book, starting with the 4th edition (Malhotra, 2004) and presently using the 6th edition (Malhotra, 2007).
The online marketing research class probably has more topic and detailed content than the traditional class, since time constraint was neither assumed nor taken into account in its design! There was no limitation such as a 3-hr class that met once a week! While the class is delivered using university’s customized Blackboard (Blackboard Inc., Washington, DC), it does not use the typical Blackboard course delivery method. Instead, students access each of 14 lessons as a PowerPoint (Microsoft, Seattle, WA) file that is prepared by substantially shortening and then modifying as well as customizing the presentation resources that were part of the instructor materials for the text book. The result-ing lesson is such that students would need to access the 338 Q. SUN AND G. GANESH
textbook to refer to the various tables and figures com-mented or elaborated upon. A substantial number of elec-tronic resources are also hyper-linked within the outlines. In this online course, students have a choice of accessing each lesson outline as either html PowerPoint (which works very well with the Internet Explorer browser) or enhanced Adobe (Adobe Systems Incorporated, San Jose, CA) PDF PowerPoint (which works better with Mozilla [The Mozilla Foundation, Mountain View, CA] Firefox and Apple’s [Apple, Cupertino, CA] Safari browsers). Besides helping with the enhanced PDF topic presenta-tions, the Adobe Acrobat (AA) version 9 is also exten-sively used for creating PDFs of hyperlinkable content from text (.doc), worksheets (.xls), and other presenta-tions (.ppt), making it possible to incorporating these into the online class.
Another key resource is Camtasia from TechSmith (Okemos, MI), a software tool that helps create audio and video (ACV) segments in which the students listen to the professor’s explanation in very clear audios while watching the action on the professor’s computer screen in very high resolution videos. The *.camrec file pro-duced by Camtasia can be rendered in a web browser-compatible, hyper-linkable format such as a flash .swf file. One major advantage of these ACV tools for the professor is the convenience without the major hassle of having to leave the office and going to a campus or other recording facility at an appointed time. The only major additional hardware requirement is a high quality microphone such as the easy to use and flawlessly func-tional USB microphone from Samson (Samson Technol-ogies, Hauppauge, NY). Using these tools, the authors recorded a very large number of unscripted ACV seg-ments to create crucial contents such as the following:
How to use the electronic library resources such as ABI-Inform and Lexis-Nexis: One of the business librarians came to the professor’s office and demon-strated a couple of search sessions that were captured as ACVs.
Sample size and other demonstrations of by-hand cal-culations: For this, an inexpensive digital writing tab-let was purchased and used as an online overhead projector, capturing the work as an ACV.
Explanations of routine PowerPoint content that could spread over multiple slides.
Demonstration of how to use software tools. This came in handy for training students in using Qualtrics (Qualtrics, Provo, UT) for creating online surveys. They were asked to follow the ACV and create the web version of a short paper and pencil survey that had been administered on campus in the late 1990s. The same technique was also used to teach students the basics of drawing decision trees using the Tree-Plan add-in for Excel and proper cell and print
formatting of Excel worksheets. It can be used for illustrating just about any other computer-based demo. Orientation to SPSS: This ACV demonstrated the basics of analyzing the SPSS dataset that resulted from the campus survey referred to above.
Data analyses: Several ACVs were recorded to sup-plement the topic outlines. These included descriptive statistics; t-tests; one-way ANOVA; correlation and regression; discriminant, factor, and cluster analyses; multidimensional scaling, and conjoint analysis. Data sets that came with the book or resulted from the authors’ research were used in preparing these demonstrations.
MEASURING STUDENT PERFORMANCE
The requirements for this course include chapter quizzes (10%), four graded assignments (40%), midterm (MT) examination (20%), and final examination (30%). The online quizzes are made up of multiple-choice questions on key concepts and hence can be easily answered by going through each chapter of textbook. The 12 quizzes cover the first 17 chapters, essentially all the way through basic data analysis. Each quiz is a random selection of 10 questions drawn from a pool of between 25 and 30 questions from the relevant chapters. Students are allowed two attempts of 2 hr each and the better score is retained. Likewise, the best 10 quiz scores comprise the semester score for this grade com-ponent. The four graded assignments (GA), worth 40% of final grade, are described as the following:
GA1: 5.0%. Online secondary sources, preparation for GA3b topic;
GA2: 5.0%. Value of information, use TreePlan to draw decision trees;
GA3a: 2.5%. Orientation to Qualtrics online survey
tool, preparation for GA3b;
GA3b: 7.5%. Design and publish an online survey
using Qualtrics;
GA4a: 2.5%. Orientation to data analysis basics of
SPSS, preparation for GA4b; and
GA4b: 17.5%. Analyze GA3b data, prepare charts
and write a report.
GA1, GA3a&b, and GA4a and GA4b all focus on the live case market research project incorporating an online survey prepared using Qualtrics. The client usually sent two or three survey emails (notification of selection, survey activation, and reminder to participate) directly to its patrons and thereby avoided confidentiality issues in shar-ing the email addresses with the professor or class. Durshar-ing the recent semesters, the online students have completed projects that dealt with the proposed new business adminis-tration building, the area market for MBA programs, the
local public library, the semiautonomous performing arts center of the university, and the student health and wellness center on campus. In each of these projects, GA1 provided the opportunity to improve their familiarity and/or expand the initial list of professor-provided objectives for the research. These were then fine tuned with input from one or two online chat sessions with the client representatives who were given guest access to the class. The finalized objec-tives were then incorporated into the GA3b online survey design assignment. The professor either picked the best effort or melded the best questions and then, after smooth-ening the rough edges, produced the final survey, which was field tested by the class as sample participants. After-wards, the survey was placed online and the patrons were notified by the client via emails. During the 7–10-day sur-vey data collection window, students prepared for and then took the mid-term examination. Once the test was over, they worked on completing GA4b over 10 to14 days, ana-lyzing the survey data, preparing the charts, and writing a report, conforming to a set of detailed guidelines provided by the professor.
Except for the first semester when it was given on cam-pus, the MT exam is prepared using Respondus software and administered within Blackboard. It is made up of a set of 75 multiple-choice questions pulled from a pool of nearly 200 questions. Therefore, each student was pre-sented with a randomly selected set of questions with answer choices in random order as well. The questions are all application micro-cases written to test the student’s understanding of basic marketing research concepts and covered material from the first half of the semester through basic data analysis (descriptives, crosstabs, and hypothesis testing; i.e., Modules 1–8).
Despite liberal test conditions (open book and notes, at least a 72-hr window with breaks for taking the test), stu-dent performance on MT test was quite mediocre. There-fore, after the conclusion of the test, a deliberate attempt was made each time to encourage better performance and keep the motivation level high. For example, once the test window closed, students have been allowed to review their
own test in detail (question by question, with correct answers and explanation provided). They could then retake MT test (another random selection of questions) after they submitted their final exams. A half to one letter grade curve was added to their original MT exam percentage, if they improved their raw score on the second attempt by five questions or more.
The final exam is a comprehensive take home effort on data analysis. In the first two semesters, it was based on a case that came with the book and its associated dataset. In recent semesters, it has been based on the client project data for that semester. The test starts with a set of data transformations (recode and compute) followed by basic data analysis (e.g., frequencies, descriptive, means, cross tabs, single-sample t-test, t-tests of independent samples and paired samples). Next, students are asked to perform one-way ANOVA, correlation, simple and multiple regres-sion analysis, discriminant analysis, factor analysis, and cluster analysis. Each of these is covered in detail in the various course modules using one or more ACVs of differ-ent data sets. Therefore, the diligdiffer-ent studdiffer-ent has pldiffer-enty of resources to refer to and complete the examination for a very satisfactory outcome. To facilitate grading, detailed guidelines are provided including standardized formats for organizing the voluminous results of SPSS analysis.
STUDENT CHARACTERISTICS AND CLASS PERFORMANCE
This paper intends to describe an online course after it had been taught, demographic data were not collected and hence unavailable to describe the students in these online classes. Therefore, the authors describe the students using three years of data (135 students) from the end of semester voluntary exit survey in the mostly evening, part time mas-ter’s programs at the university. Nearly 60% of the masmas-ter’s students completing the exit survey over the three-year period are in the MBA program, while the rest are in the master of science program. The average age of the students
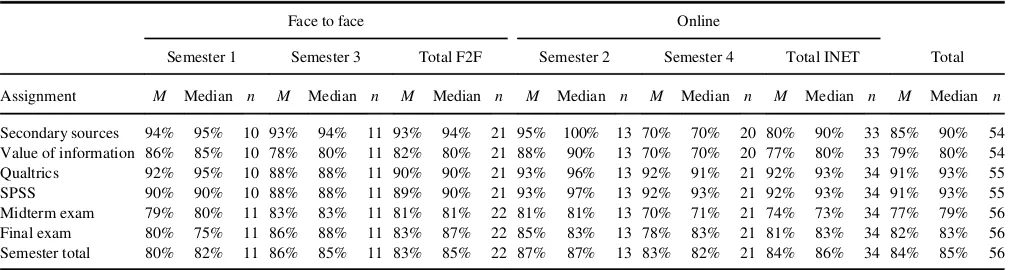
TABLE 1
Performance Comparison of the Two Instructional Formats, by Assignment
Face to face Online
Semester 1 Semester 3 Total F2F Semester 2 Semester 4 Total INET Total
Assignment M Median n M Median n M Median n M Median n M Median n M Median n M Median n
Secondary sources 94% 95% 10 93% 94% 11 93% 94% 21 95% 100% 13 70% 70% 20 80% 90% 33 85% 90% 54
is 30 years with a median of 28. Male students comprised 53% of the group. Nearly 40% worked full-time while another 19% were working at least half time. About a third planned to continue in their present position or move to another position with the same employer while 40% were seeking a new career path. The median income before obtaining the MBA was $30,000–40,000 while after earn-ing it the expected median was $50,000–60,000. Almost all the students lived and worked in the two zip code clusters of the metro area of the university.
Tables 1 and 2 use recent data that compares two online and two face to face sections taught by one of the authors in different semesters. Based on the results shown in Table 1
and 2, it is apparent that students in the online and face to face formats have performed quite similarly although the online students have the disadvantage of not being in a reg-ular face to face class that allows for a great deal of syn-chronous interaction among the students and professor.
STUDENT FEEDBACK ABOUT THE CLASS
Detailed attitudinal results by semester, shown in Table 3, are quite encouraging. Looking at information on hours spent on graded assignments in Table 3, it is easy to draw the conclusion that the data analysis assignments, TABLE 2
Performance Comparison of the Two Instructional Formats, by Semester Grade
Face to face Online
Semester 1 Semester 3 Total F2F Semester 2 Semester 4 Total INET Total
Semester grade n % n % n % n % n % n % n %
A 3 27% 2 18% 5 23% 4 31% 6 29% 10 29% 15 27% B 5 46% 8 73% 13 59% 7 54% 6 29% 13 38% 26 46%
C 1 9% 1 9% 2 9% 2 15% 8 38% 10 29% 12 21%
D 1 9% 0 0% 1 5% 0 0% 0 0% 0 0% 1 2%
F 1 9% 0 0% 1 5% 0 0% 1 5% 1 3% 2 4%
Total 11 100% 11 100% 22 100% 13 100% 21 100% 34 100% 56 100%
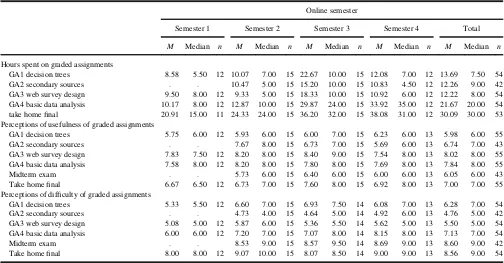
TABLE 3 Graded Assignments
Online semester
Semester 1 Semester 2 Semester 3 Semester 4 Total
M Median n M Median n M Median n M Median n M Median n
Hours spent on graded assignments
GA1 decision trees 8.58 5.50 12 10.07 7.00 15 22.67 10.00 15 12.08 7.00 12 13.69 7.50 54 GA2 secondary sources . . 10.47 5.00 15 15.20 10.00 15 10.83 4.50 12 12.26 9.00 42 GA3 web survey design 9.50 8.00 12 9.33 5.00 15 18.33 10.00 15 10.92 6.00 12 12.22 8.00 54 GA4 basic data analysis 10.17 8.00 12 12.87 10.00 15 29.87 24.00 15 33.92 35.00 12 21.67 20.00 54 take home final 20.91 15.00 11 24.33 24.00 15 36.20 32.00 15 38.08 31.00 12 30.09 30.00 53 Perceptions of usefulness of graded assignments
GA1 decision trees 5.75 6.00 12 5.93 6.00 15 6.00 7.00 15 6.23 6.00 13 5.98 6.00 55 GA2 secondary sources . . 7.67 8.00 15 6.73 7.00 15 5.69 6.00 13 6.74 7.00 43 GA3 web survey design 7.83 7.50 12 8.20 8.00 15 8.40 9.00 15 7.54 8.00 13 8.02 8.00 55 GA4 basic data analysis 7.58 8.00 12 8.20 8.00 15 7.80 8.00 15 7.69 8.00 13 7.84 8.00 55 Midterm exam . . 5.73 6.00 15 6.40 6.00 15 6.00 6.00 13 6.05 6.00 43 Take home final 6.67 6.50 12 6.73 7.00 15 7.60 8.00 15 6.92 8.00 13 7.00 7.00 55 Perceptions of difficulty of graded assignments
GA1 decision trees 5.33 5.50 12 6.60 7.00 15 6.93 7.50 14 6.08 7.00 13 6.28 7.00 54 GA2 secondary sources . . 4.73 4.00 15 4.64 5.00 14 4.92 6.00 13 4.76 5.00 42 GA3 web survey design 5.08 5.00 12 5.87 6.00 15 5.36 5.50 14 5.62 5.00 13 5.50 5.00 54 GA4 basic data analysis 6.00 6.00 12 7.20 7.00 15 7.07 8.00 14 8.15 8.00 13 7.13 7.00 54 Midterm exam . . 8.53 9.00 15 8.57 9.50 14 8.69 9.00 13 8.60 9.00 42 Take home final 8.00 8.00 12 9.07 10.00 15 8.07 8.50 14 9.00 9.00 13 8.56 9.00 54
Note:Perceptions of usefulness and difficulty were evaluated using a 10-point Likert-type scale with responses ranging from 1 (very low) to 10 (very high), with only end points labeled.
especially the take home final, are the time hogs. Table 3 presents the results of analysis of student perceptions of the graded assignments and examinations. The only item to show significant difference across semesters is the difficulty
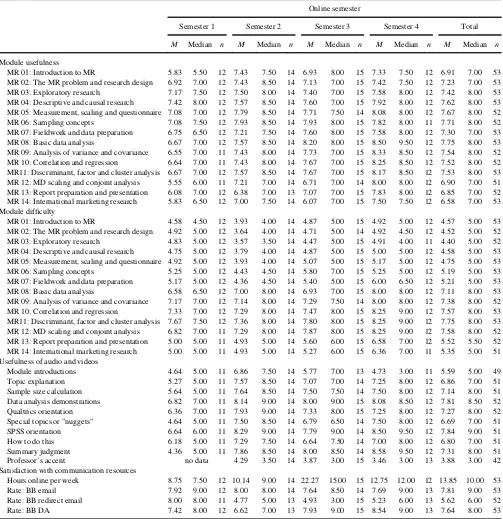
of GA4b (basic data analysis) and this is perhaps due to a strengthening of the requirements after the first offering of the online course. Also, when the Total column is exam-ined, across the semesters, the overall mean for most of the TABLE 4
Perceptions of Module Usefulness and Difficulty, Usefulness of Audio and Videos, and Satisfaction With Communication Resources
Online semester
Semester 1 Semester 2 Semester 3 Semester 4 Total
M Median n M Median n M Median n M Median n M Median n
Module usefulness
MR 01: Introduction to MR 5.83 5.50 12 7.43 7.50 14 6.93 8.00 15 7.33 7.50 12 6.91 7.00 53 MR 02: The MR problem and research design 6.92 7.00 12 7.43 8.50 14 7.13 7.00 15 7.42 7.50 12 7.23 7.00 53 MR 03: Exploratory research 7.17 7.50 12 7.50 8.00 14 7.40 7.00 15 7.58 8.00 12 7.42 8.00 53 MR 04: Descriptive and causal research 7.42 8.00 12 7.57 8.50 14 7.60 7.00 15 7.92 8.00 12 7.62 8.00 53 MR 05: Measurement, scaling and questionnaire 7.08 7.00 12 7.79 8.50 14 7.71 7.50 14 8.08 8.00 12 7.67 8.00 52 MR 06: Sampling concepts 7.08 7.50 12 7.93 8.50 14 7.93 8.00 15 7.82 8.00 11 7.71 8.00 52 MR 07: Fieldwork and data preparation 6.75 6.50 12 7.21 7.50 14 7.60 8.00 15 7.58 8.00 12 7.30 7.00 53 MR 08: Basic data analysis 6.67 7.00 12 7.57 8.50 14 8.20 8.00 15 8.50 9.50 12 7.75 8.00 53 MR 09: Analysis of variance and covariance 6.55 7.00 11 7.43 8.00 14 7.73 7.00 15 8.33 8.50 12 7.54 8.00 52 MR 10: Correlation and regression 6.64 7.00 11 7.43 8.00 14 7.67 7.00 15 8.25 8.50 12 7.52 8.00 52 MR11: Discriminant, factor and cluster analysis 6.67 7.00 12 7.57 8.50 14 7.67 7.00 15 8.17 8.50 12 7.53 8.00 53 MR 12: MD scaling and conjoint analysis 5.55 6.00 11 7.21 7.00 14 6.71 7.00 14 8.00 8.00 12 6.90 7.00 51 MR 13: Report preparation and presentation 6.08 7.00 12 6.38 7.00 13 7.07 7.00 15 7.83 8.00 12 6.85 7.00 52 MR 14: International marketing research 5.83 6.50 12 7.00 7.50 14 6.07 7.00 15 7.50 7.50 12 6.58 7.00 53 Module difficulty
MR 01: Introduction to MR 4.58 4.50 12 3.93 4.00 14 4.87 5.00 15 4.92 5.00 12 4.57 5.00 53 MR 02: The MR problem and research design 4.92 5.00 12 3.64 4.00 14 4.71 5.00 14 4.92 4.50 12 4.52 5.00 52 MR 03: Exploratory research 4.83 5.00 12 3.57 3.50 14 4.47 5.00 15 4.91 4.00 11 4.40 5.00 52 MR 04: Descriptive and causal research 4.75 5.00 12 3.79 4.00 14 4.87 5.00 15 5.00 5.00 12 4.58 5.00 53 MR 05: Measurement, scaling and questionnaire 4.92 5.00 12 3.93 4.00 14 5.07 5.00 15 5.17 5.00 12 4.75 5.00 53 MR 06: Sampling concepts 5.25 5.00 12 4.43 4.50 14 5.80 7.00 15 5.25 5.00 12 5.19 5.00 53 MR 07: Fieldwork and data preparation 5.17 5.00 12 4.36 4.50 14 5.40 5.00 15 6.00 6.50 12 5.21 5.00 53 MR 08: Basic data analysis 6.58 6.50 12 7.00 8.00 14 6.93 7.00 15 8.00 8.00 12 7.11 8.00 53 MR 09: Analysis of variance and covariance 7.17 7.00 12 7.14 8.00 14 7.29 7.50 14 8.00 8.00 12 7.38 8.00 52 MR 10: Correlation and regression 7.33 7.00 12 7.29 8.00 14 7.47 8.00 15 8.25 9.00 12 7.57 8.00 53 MR11: Discriminant, factor and cluster analysis 7.67 7.50 12 7.36 8.00 14 7.80 8.00 15 8.25 9.00 12 7.75 8.00 53 MR 12: MD scaling and conjoint analysis 6.82 7.00 11 7.29 8.00 14 7.87 8.00 15 8.25 9.00 12 7.58 8.00 52 MR 13: Report preparation and presentation 5.00 5.00 11 4.93 5.00 14 5.60 6.00 15 6.58 7.00 12 5.52 5.50 52 MR 14: International marketing research 5.00 5.00 11 4.93 5.00 14 5.27 6.00 15 6.36 7.00 11 5.35 5.00 51 Usefulness of audio and videos
Module introductions 4.64 5.00 11 6.86 7.50 14 5.77 7.00 13 4.73 3.00 11 5.59 5.00 49 Topic explanation 5.27 5.00 11 7.57 8.50 14 7.07 7.00 14 7.25 8.00 12 6.86 7.00 51 Sample size calculation 5.64 5.00 11 7.64 8.50 14 7.50 7.50 14 7.50 8.00 12 7.14 8.00 51 Data analysis demonstrations 6.82 7.00 11 8.14 9.00 14 8.00 9.00 15 8.08 8.50 12 7.81 8.50 52 Qualtrics orientation 6.36 7.00 11 7.93 9.00 14 7.33 8.00 15 7.25 8.00 12 7.27 8.00 52 Special topics or "nuggets" 4.64 5.00 11 7.50 8.50 14 6.79 6.50 14 7.50 8.00 12 6.69 7.00 51 SPSS orientation 6.64 6.00 11 8.29 9.00 14 7.79 9.00 14 8.50 9.50 12 7.84 9.00 51 How to do this 6.18 5.00 11 7.29 7.50 14 6.64 7.50 14 7.00 8.00 12 6.80 7.00 51 Summary judgment 4.36 5.00 11 7.86 8.50 14 8.00 8.50 14 8.58 9.50 12 7.31 8.00 51 Professor’s accent no data 4.29 3.50 14 3.87 3.00 15 3.46 3.00 13 3.88 3.00 42 Satisfaction with communication resources
Hours online per week 8.75 7.50 12 10.14 9.00 14 22.27 15.00 15 12.75 12.00 12 13.85 10.00 53 Rate: BB email 7.92 9.00 12 8.00 8.00 14 7.64 8.50 14 7.69 9.00 13 7.81 9.00 53 Rate: BB redirect email 8.00 8.00 11 4.77 5.00 13 4.93 3.00 15 5.23 6.00 13 5.62 6.00 52 Rate: BB DA 7.42 8.00 12 6.62 7.00 13 7.93 9.00 15 8.54 9.00 13 7.64 8.00 53
Note:Perceptions of usefulness and difficulty were evaluated using a 10-point Likert-type scale with responses ranging from 1 (very low) to 10 (very high), with only end points labeled. Usefulness of audio and videos was evaluated using two 10-point Likert-type scales, a scale for usefulness ranging from 1 (not at all useful) to 10 (very useful) and a scale for accent ranging from 1 (not at all difficult) to 10 (very difficult). Satisfaction was evaluated using a 10-point Likert-type scale ranging from 1 (not at all satisfied) to 10 (very satisfied).
342 Q. SUN AND G. GANESH
assignments is significant and positive. GA3 (web survey design) and GA4 (basic data analysis) were cited as the most useful assignments, while GA1 (decision trees) was uniformly seen as the least useful. As expected, the take-home final involving basic as well as multivariate analysis was clearly the most difficult assignment, easily outdistanc-ing the others. Students also overwhelmoutdistanc-ingly felt that the time given for each graded assignment was just right. The only exception was the take home final, for which students expressed a lack of time during the first semester. This was corrected and now it also displays a pattern just like the other assignments.
Table 4 shows the results of analysis of student percep-tions of usefulness and difficulty of the course content mod-ules. This time, there are no significant differences across semesters. When the overall means across the semesters (the Total column) is examined, all modules are viewed positively (significantly useful with mean > 5.50, while
only the data analysis modules 08 through 12 are seen as significantly difficult (mean>5.50). As expected, the first
four modules (introduction to market research, the market research problem and research design, exploratory research, and descriptive and causal research) are seen as signifi-cantly easier while four modules on sampling, field work,
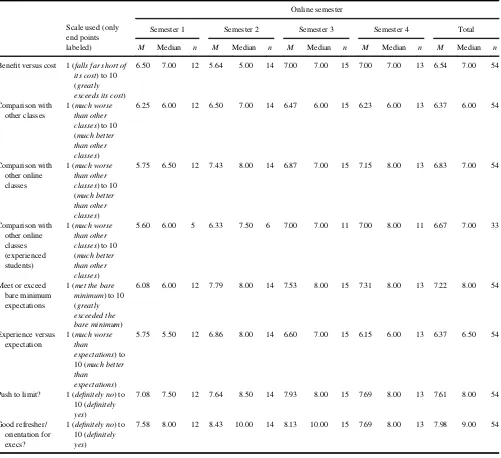
TABLE 5
Other General Perceptions of Course
Scale used (only end points labeled)
Online semester
Semester 1 Semester 2 Semester 3 Semester 4 Total
M Median n M Median n M Median n M Median n M Median n
Benefit versus cost 1 (falls far short of its cost) to 10
report preparation, and international market research fall in between (mean not significantly different from 5.50).
Perceptions of the ACV content, shown in Table 4, are of particular interest as so much time was spent in creating these. It is gratifying to note that overall, most of the ACVs are perceived significantly positively (total mean >5.50).
There are no significant differences across semesters, except in the case of the special topic nugget ACVs and overall summary judgment. The data analysis and how-to demonstration ACVs were consistently rated as the best. The students expressed a preference for accessing the ACVs as links within modules or as a separate ACV cluster on Blackboard. Both options are currently implemented.
Table 4 confirms that satisfaction with the communica-tion resources used in the online course do not differ by semester and the two main ones (email and the discussion area) are viewed significantly positively. The redirect email feature is passive (e.g., simply forwarding Blackboard e-mail to the student’s preferred ee-mail address) and it is there-fore not surprising that it was viewed as not significantly different from the neutral point.
None of the general perceptions of the online course, shown in Table 5, differ across the four semesters and it is interesting to note that all the comparative ratings are sig-nificantly positive (total mean >5.50). In particular, the
comparison of the online marketing research class to other online classes favors the former, for all students and the subgroup of students who have taken a significant number (median of5) of online classes. Likewise, students over-whelmingly endorsed the custom methods used for access-ing the basic topic outlines online, preferraccess-ing to keep current look and feel as opposed to change to resemble other Blackboard courses.
CONCLUSIONS
This article described in detail the experience of developing and teaching an online MBA marketing research course. Detailed feedback from students suggests that they per-formed comparably to their face-to-face peers, reacted quite positively to the class, perceived it as something valuable and were comfortable with various aspects of its implemen-tation. There have also been voluntary feedback letters and comments from former students appreciative of what they learned in this class. In particular, the positive evaluations of ACVs highlights the importance of resembling the online courses with face-to-face classroom by utilizing vid-eos. The live project with a real client also ensures the experiential learning in online courses, as required by AACSB. As a result, the results of this study provide empir-ical data on the feasibility of teaching statistempir-ical contents online, as well as the effectiveness of online learning.
One issue not addressed here is a detailed attitudinal comparison of the online class with the face-to-face class.
However, that would require collecting identical data from both formats taught by the same professor using a near-identical syllabus. The authors propose to explore this fur-ther in the future. The online course could also be used by doctoral students to learn or refresh basics of marketing research, especially to those who have not taken such a course before joining the doctoral program. In addition, this online course has just been adapted and taught at the undergraduate level, primarily by excluding the more advanced topics. The authors propose to collect data from the undergraduate class for at least 4–5 iterations before making a formal assessment about the undergrad-uate experience and sharing the results. There is also a need to collect data from the students one year after they finished this course compare and evaluate the effective-ness of this online marketing research course. Future researchers should compare student perceptions of course usefulness and difficulty as well as their satisfaction for online and face-to-face formats.
In addition, the detailed explanation of the online MBA marketing research course in this study would hopefully help marketing educators at other institutions design and implement a similar course effectively and efficiently. The longitudinal analysis of course evalua-tions provide insights on what contents are most impor-tant to the students and how other marketing educators can effectively teach online market research at MBA level. In particular, the ACV contents and live case could help bridge the gap of online teaching and traditional face-to-face communication.
REFERENCES
Anderson, P. M. (1982). Comparing texts and faculty/practitioner priorities for MBA marketing research course content.Journal of Marketing Edu-cation,4(1), 35–41.
Association to Advance Collegiate Schools of Business (AACSB). (2003).
Eligibility procedures and standards for business accreditation. St. Louis, MO: Author.
Bellenger, D. N., & Bernhardt, K. L. (1977). Revising the undergraduate curriculum: The views of practitioners and educators. In B. A. Green-berg & D. N. Bellenger (Eds.),Contemporary marketing thought(pp. 45–49). Chicago, IL: American Marketing Association.
Bhattacharya, C. B., & Sheth, J. N. (1996). Instill social responsibility through marketing research field projects.Journal of Marketing Educa-tion,6(2), 23–31.
Bove, L. L., & Davies, W. M. (2009). A case study of teaching marketing research using client-sponsored projects.Journal of Marketing Educa-tion,31, 30–39.
Bradstreet, T. E. (1996). Teaching introductory statistics courses so that nonstatisticians experience statistical reasoning.The American Statisti-cian,50(1), 69–79.
Bridges, E. (1999). Experiential learning and customer needs in the under-graduate marketing research course.Journal of Marketing Education,
21(1), 51–59.
Castleberry, S. B. (2001). Using secondary data in marketing research: A project that melds web and off-web sources.Journal of Marketing Edu-cation,23, 195–203.
344 Q. SUN AND G. GANESH
Dobni, D., & Links, G. (2008). Promoting statistical intelligence in market-ing research students: Best practice ideas.Marketing Education Review,
18, 61–64.
Ganesh, G. K. (1992). The marketing research as taught in U.S. business schools.Journal of Marketing Education,14(1), 22–34.
Ganesh, G. K., & Sun, Q. (2009). Using simulations in the undergraduate marketing capstone case course.Marketing Education Review,19, 7–16. Giacobbe, R. W., & Segal, M. N. (1994). Rethinking marketing research education: A conceptual, analytical, and empirical investigation.Journal of Marketing Education,16, 43–58.
Liu, S., Gomez, J., Khan, B., & Yen, C.-J. (2007). Toward a learner-oriented community college online course dropout framework. Interna-tional Journal on E‑Learning,6(1), 519–542.
Malhotra, N. K. (2004).Marketing research(4th ed.). Englewood Cliffs, NJ: Prentice-Hall.
Malhotra, N. K. (2007).Marketing research(5th ed.). Englewood Cliffs, NJ: Prentice-Hall.
Malhotra, N. K., Dixit, A., & Uslay, C. (2002). Integrating Internet tech-nology in marketing research education.Marketing Education Review,
12(3), 25–34.
Matulich, E., Papp, R., & Haytko, D. L. (2008). Continuous improvement through reaching innovations: A requirement for today’s learners. Mar-keting Education Review,18(1), 1–7.
McGorry, S. Y. (2006). Data in the palm of your hand.Marketing Educa-tion Review,16(3), 83–90.
Peterson, M. (2006). Teaching web-based international-marketing-research through the creation of a global hedge fund. Marketing Education Review,16, 63–69.
Sebastianelli, R., & Tamimi, N. (2011). Business statistics and manage-ment science online: Teaching strategies and assessmanage-ment of student learning.Journal of Education for Business,86, 317–325.
Smith, S., & Fisher, D. (2006). You can observe a lot by just watching: Using videography in a retail setting to teach observational research methods.Marketing Education Review,16, 75–78.
Steiner, S. D., & Hyman, M. R. (2010). Improving the student experi-ence: Allowing students enrolled in a required course to select online or face-to-face instruction.Marketing Education Review, 20, 29–33.
Stern, B. L., & Tseng, L. P. D. (2002). Do academics and practitioners agree on what and how to teach the undergraduate marketing research course?Journal of Marketing Education,24, 225–232.
Stewart, B. L. (2004). Online learning: A strategy for social responsibility in educational access.Internet and Higher Education,7, 299–310. Zahay, D., & Fredricks, E. (2009). Podcasting to improve delivery of a
project-based Internet marketing course.Marketing Education Review,
19, 57–63.