Full Terms & Conditions of access and use can be found at
http://www.tandfonline.com/action/journalInformation?journalCode=cbie20
Download by: [Universitas Maritim Raja Ali Haji] Date: 18 January 2016, At: 21:44
Bulletin of Indonesian Economic Studies
ISSN: 0007-4918 (Print) 1472-7234 (Online) Journal homepage: http://www.tandfonline.com/loi/cbie20
PRODUCTIVITY AND FIRM DYNAMICS: CREATIVE
DESTRUCTION IN INDONESIAN MANUFACTURING,
1994–2000
Jan ter Wengel & Edgard R. Rodriguez
To cite this article: Jan ter Wengel & Edgard R. Rodriguez (2006) PRODUCTIVITY AND FIRM DYNAMICS: CREATIVE DESTRUCTION IN INDONESIAN MANUFACTURING, 1994–2000, Bulletin of Indonesian Economic Studies, 42:3, 341-355, DOI: 10.1080/00074910601053219
To link to this article: http://dx.doi.org/10.1080/00074910601053219
Published online: 23 Nov 2006.
Submit your article to this journal
Article views: 72
ISSN 0007-4918 print/ISSN 1472-7234 online/06/030341-15 © 2006 Indonesia Project ANU DOI: 10.1080/00074910601053219
PRODUCTIVITY AND FIRM DYNAMICS:
CREATIVE DESTRUCTION IN INDONESIAN
MANUFACTURING, 1994–2000
Jan ter Wengel* Edgard R. Rodriguez*
Javeriana University, Carleton University and
Bogota International Development
Research Centre, Ottawa
This paper examines the entry and exit, and the labour productivity, of Indonesian manufacturing fi rms with 20 workers or more, using a fi rm-level panel dataset con-structed for the years 1994–2000. Overall change in manufacturing labour produc-tivity reached 27.2%—an average growth of 3.5% per annum—between 1994 and 2000, a period that includes the 1997–98 Asian fi nancial crisis, which hit Indonesia hard. Vibrant fi rm dynamics characterised this period, in which about 10% of man-ufacturing enterprises were renewed in any one year. By 2000, one-third of all en-terprises in existence in 1994 had closed, but the number of enen-terprises that closed was lower than the number that entered and survived up to the year 2000. The replacement of exiting fi rms with newly entering fi rms contributed signifi cantly to increases in overall labour productivity. Regulatory reform in support of this proc-ess should lead to gains in productive employment for Indonesian workers.
INTRODUCTION
Worldwide, Indonesia ranks close to the bottom as an environment conducive to starting a business: 137th out of 175 countries (World Bank 2006). Opening a limited-liability business in Indonesia takes 151 days, while the same procedure in China and Vietnam takes only one-third as long: 48 and 50 days, respectively.1 Nearby Malaysia and Thailand require only 30 and 33 days, respectively, while Singaporean business start-ups take a mere six days and those in Australia and Canada two to three days. It is not surprising to fi nd among the highlights of the investment package announced in early 2006 that the Yudhoyono administra-tion has explicitly committed to cutting the time to start a business from 150 to
* janterwengel@javeriana.edu.co and erodriguez@idrc.ca. The authors gratefully acknowl-edge the Asian Development Bank and Indonesia’s Central Statistics Agency (Badan Pusat Statistik, BPS) for providing access to the data. The paper has benefi ted from insightful comments by the editor and two anonymous referees. All remaining errors are ours. 1 All entry indicators reported in the World Bank’s Doing Business reports (World Bank 2003, 2004, 2005a, 2006) describe a limited-liability company—not a sole proprietorship, a partnership, a cooperative, a joint stock company or a corporation. Private limited-liability companies are the most prevalent business form around the world.
cBIEDec06.indb 341
cBIEDec06.indb 341 27/10/06 5:19:19 PM27/10/06 5:19:19 PM
30 days.2 For a long time, international donors have advocated cutting the time and cost of opening new businesses in Indonesia, and a recent evaluation of donor-sponsored ‘one-stop shops’ for domestic business registration and licens-ing estimates a cost reduction of about 30% and a cut in waitlicens-ing times of 40% (Asia Foundation 2005, 2006).
Symptomatic of the problem is that, regardless of its activity, every Indonesian business needs to apply for a trading licence—a procedure that takes two weeks and, if the owner has come from out of town, requires a ‘good conduct’ note from the police in the place of origin, leaving entrepreneurs vulnerable to implicit or explicit demands for bribes (World Bank 2004: 40). With the advent of decentrali-sation in 2001, the regulatory burden, including bribes, has worsened for fi rms in Indonesia (Asia Foundation 2004; Kuncoro 2004; World Bank 2005a). It is believed that the fi xed cost of dealing with regulations imposes a relatively larger burden on small fi rms, discouraging compliance and contributing to a large informal sec-tor.3 For fi rms that comply, costs in time and sales become signifi cant. According to an investment climate survey by the Asian Development Bank and the World Bank (World Bank 2005b), fi rms spend about 10% of their time (14–16% for large fi rms) completing forms and dealing with other regulatory requirements. More than half of this time is spent on local government regulations. About one-third of fi rms report hiring consultants to work almost entirely on matters related to government regulations.
Not only is entry of new fi rms costly: the exit of failing fi rms is also problem-atic. Lengthy liquidation procedures impose additional costs on the process of reallocating resources to more productive uses (Schroeder and Sidharta 2004). According to the same World Bank report (World Bank 2006), Indonesia ranks 135th out of 175 countries in terms of the ease of closing a business. While it takes more than 5.5 years to liquidate a business in Indonesia, it takes only 2.7 years in Thailand, 2.4 in China, and 2.2 in Malaysia (and 1 year in Australia and Canada).
Other laws and regulations that affect businesses are less visible but have far more serious consequences, and have also attracted increasing donor attention.4 For instance, a review of the reservation scheme for small fi rms,5 which limits entry into certain activities to fi rms below a specifi ed size, concluded that the scheme had long-term and hidden effi ciency costs for the economy, especially in industries in which only larger fi rms are able to realise economies of scale: forgone investment in these industries adds to the cost of the scheme (ADB 2002). Another review, of compulsory assistance by state-owned enterprises to small enterprises,6 revealed a loss of effi ciency and high administration costs
2 Presidential Instruction 3/2006, dated 27 February 2006.
3 According to Schneider (2002), 19.4% of the economy is considered informal.
4 Rodriguez (2004) presents a perspective on donor support to enterprise development in Southeast Asia after the Asian fi nancial crisis.
5 Presidential Decree 99/1998 on Reservation of Particular Industry Sectors for Small-scale Enterprises.
6 Minister of Finance Decree (SK Menteri Keuangan) 316/KMK.016/1994 on Compulsory Assistance by State-owned Enterprises to Small-scale Enterprises.
cBIEDec06.indb 342
cBIEDec06.indb 342 27/10/06 5:19:20 PM27/10/06 5:19:20 PM
(ADB 2001). These reviews concluded that both pieces of legislation needed to be revoked.7
In this context, it is of interest to examine the fi rm dynamics driving evolution of the industrial structure within the crucial manufacturing sector of the econ-omy. This study can shed light only on the productivity and the entry and exit of formal sector fi rms by size and by manufacturing sub-sector between 1994 and 2000, a very turbulent period for Indonesia;8 the paper does not attempt to provide any explicit measure of the cost of entry or exit by year or sub-sector. However, the analysis should lay the foundation for further research to guide regulatory policy reforms already under way. Does it really represent ‘creative destruction’ as proposed by Schumpeter (1942)? And if so, does economic policy hinder this process? Can it support it? In Indonesia, overall economic growth has been below potential, and structural reforms are needed to make a dent on poverty, which stands barely below pre-crisis levels.9 The Yudhoyono govern-ment, which took offi ce in October 2004, has pledged to continue and extend the reforms of the previous government in an effort to improve the investment and business environment.
The next section of this paper presents an overview of growth in employment and value added in manufacturing. The following two sections examine the pro-ductivity of exit, continuing and entry fi rms by fi rm size and by manufacturing sub-sector, respectively. The fi nal section presents the conclusions.
OVERVIEW OF MANUFACTURING
IN THE INDONESIAN ECONOMY, 1994–2005
Manufacturing contributes signifi cantly to the economy (table 1). Between 2001 and 2005, manufacturing GDP grew by an average of 5.4% annually and con-tributed 29% of total GDP. This share represented an increase of more than 8 percentage points over the 1988–93 period, when manufacturing was grow-ing at record double-digit rates. Moreover, manufacturgrow-ing accounts for nearly 12% of the employed labour force, which reached almost 93 million in 2004. It is worth noting that only about 40% of the total manufacturing workforce (of almost 11 million in 2000) was employed in enterprises with 20 workers or more (< http://www.bps.go.id/sector/manufacturing/ibs/table3.shtml>), up from 36% in 1986; in other words, a majority of manufacturing workers (about 60%)
7 Recent technical assistance provided by the Asian Development Bank (ADB) to the Indonesian government included a review of registration, licensing and other business legislation related to small businesses. ‘Promoting Deregulation and Competition’ (Tech-nical Assistance No. 3416) and ‘Small and Medium Enterprise Development’ (Tech(Tech-nical Assistance No. 3417) ran in parallel with a policy-based loan for Industrial Competitive-ness and Small and Medium Enterprise Development (Loan No. 1738 for $200 million) (ADB 2000).
8 At the time of writing, the central statistics agency had not yet made the 2001 and later data available.
9 In relation to the national poverty line, 15% of Indonesians lived in poverty in 1996 and in 2004. If the international poverty line of $2 per day is used, 45% were poor in 2004, some-what less than the 50% headcount of 1996 (IMF 2005: 13).
cBIEDec06.indb 343
cBIEDec06.indb 343 27/10/06 5:19:20 PM27/10/06 5:19:20 PM
were employed by unincorporated or informal enterprises with fewer than 20 workers.
Manufacturing exhibits higher than average labour productivity, notwith-standing large variations within the sector. Workers employed in manufactur-ing contribute on average twice as much value added as the average worker in the economy. Relative productivity remained largely unchanged over the period 1988–2000, and rose to a ratio of 2.15 in 2001–04.
Within the sector, annual labour productivity growth was unimpressive from the late 1980s to 2000 (in the remainder of this paper, ‘productivity’ refers to labour
TABLE 1 Key Economic Indicatorsa
1988–93 1994–98 1999–2000 2001–05
Employment (million)
Employed 76.0 84.2 89.3 92.8
Employed in manufacturing 7.7 10.5 11.6 11.7
GDP
GDP (Rp trillion) 275.0 392.4 388.7 2,119.2 Manufacturing GDP (Rp trillion) 57.6 95.9 102.0 611.1 Manufacturing GDP (% of total GDP) 20.8 24.4 26.2 29.0 Growth in GDP (annual average, %) 8.3 3.0 2.9 4.9 Growth in manufacturing GDP
(annual average, %)
11.1 5.7 5.0 5.4
Labour productivity
Entire economy
(GDP per employed worker, Rp million)
3.6 4.7 4.4 17.1
Manufacturing
(manufacturing GDP per worker employed in manufacturing, Rp million)
7.5 9.1 8.8 38.1
Labour productivity: ratio of manufacturing to entire economy
2.07 1.96 2.02 2.23
Growth in manufacturing GDP per worker employed in manufacturing (annual average, %)
3.2 3.1 –2.8 6.4
Investment
Foreign direct investment ($ billion) 1.4 3.0 –3.2 –0.6 Gross domestic capital formation
(% of GDP)
25.8 29.1 21.3 22.7
a Data are in constant 1993 prices for 1988–2000, and in 2000 prices for 2001–04. All data are calendar year averages.
Source: Asian Development Bank, Key Indicators 2006, <http://www.adb.org/Documents/Books/ Key_Indicators/2006/xls/INO.xls>.
cBIEDec06.indb 344
cBIEDec06.indb 344 27/10/06 5:19:21 PM27/10/06 5:19:21 PM
productivity). It averaged 3.1% between 1988 and 2000 in 1993 constant prices (table 1).10 Data for the years 1975–96 show no major increases in labour produc-tivity in manufacturing fi rms, except for those with fewer than 20 workers (most of which were operating in the informal sector), and only for the earlier years.11 From 1975 to 1996, Berry, Rodriguez and Sandee (2001) estimate that medium fi rms (those with 20 to 99 workers) experienced the lowest rate of increase (only 0.3%). According to the same study, productivity growth for large fi rms (those with 100 workers or more) peaked at 3.4% between 1986 and 1996—a period of signifi cant infl ows of foreign direct investment that ended with the 1997–98 cri-sis (table 1). The differentials in productivity growth explain why the productiv-ity gap between medium and large fi rms in Indonesia—known to be one of the largest by international standards, according to Berry and Mazumdar (1991)—has persisted: it increased from about 220% in 1975 and 1986 to 290% in 1996 (see Berry, Rodriguez and Sandee 2001, table 1, for a comparison of manufacturing survey data since 1975).
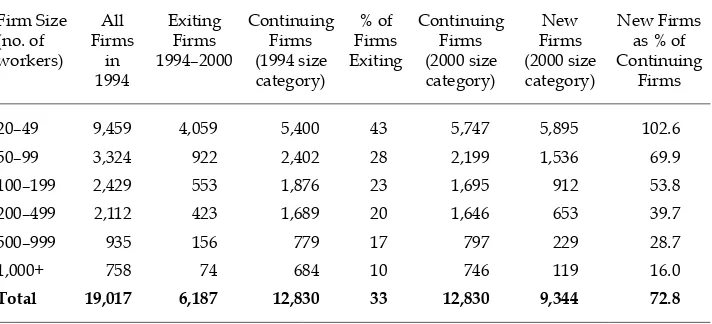
The data in the present paper exclude micro-enterprises (those with fewer than 5 workers) and small fi rms (those with 5–19 workers)—most of which are informal enterprises. In 1996, these fi rms with fewer than 20 workers generated about 15% of manufacturing GDP, but accounted for about 60% of manufacturing employ-ment, so their average labour productivity was very low. This paper does not focus on the dynamics of this segment of the manufacturing sector, but rather on the (mostly formal) enterprises that have 20 workers or more. The coverage is dic-tated by the availability and comprehensiveness of data collected in the Annual Manufacturing Survey produced by the central statistics agency.12 Between 1994 and 2000, the number of these fi rms increased by 16.6%, from 19,017 to 22,174.13 This increase, although impressive, conceals other important changes in the sec-tor. Some 6,187 fi rms—32.5% of the total in existence in 1994—closed before the year 2000. In the same period, however, 9,344 new fi rms were established. That is, in the year 2000, 42% of the fi rms tallied in the manufacturing sector survey were new.
PRODUCTIVITY GROWTH IN FIRMS OF DIFFERENT SIZE
Data have been checked to verify that the new fi rms are not just old fi rms that may have been sold or reorganised, or have changed their names. Table 2 provides entry and exit rates of fi rms between 1994 and 2000 by fi rm size. It shows that
10 More recent data indicate a far higher (8%) average annual growth for 2001–04 in 2000 constant prices (table 1).
11 Data tend to be less reliable for very small fi rms. Survey data show very high produc-tivity growth (16.2%) for this group between 1975 and 1986, but negative growth between 1986 and 1996 (Berry, Rodriguez and Sandee 2001: table 1).
12 Survey years relevant here are 1975, 1986 and 1996. The annual surveys cover manufactur-ing fi rms with 20 workers and more, and are de facto censuses for this population of fi rms. 13 According to the 1996 census of manufacturing establishments, of 2.8 million total establishments, by far the majority (2.5 million) were micro-enterprises with fewer than fi ve workers. There were 28,798 fi rms with 20 workers or more (Berry, Rodriguez and San-dee 2002: table 1).
cBIEDec06.indb 345
cBIEDec06.indb 345 27/10/06 5:19:21 PM27/10/06 5:19:21 PM
9,344 new fi rms started manufacturing operations in the fi ve years between 1994 and 2000—that is, almost half of all the fi rms in existence in 1994. Thus in every year during the period, on average about 10% of fi rms were new. Moreover, between 1994 and 2000 nearly one-third of all fi rms in existence in 1994 closed.14 Such a high rate of failure is not implausible. Bernard and Jensen (2002: 2) observe that: ‘Over a typical fi ve year period, more than 32% of U.S. manufacturing plants shut down, accounting for more than 22% of job destruction.’
The main hypothesis of this paper is that the increase in productivity of the manufacturing sector can to a large extent be attributed to the entrance of new fi rms and the displacement of less productive ones. Other authors have put for-ward similar hypotheses, such as Melitz (2002: 1), who asserts that ‘productiv-ity differences between entering and exiting fi rms signifi cantly contribute to aggregate productivity changes over time’. In other words, if we compare the value added per unit of labour for the exit and the entry fi rms, the latter are more productive.15 When assessing the productivity of enterprises it is important to distinguish between labour productivity and effi ciency. Labour productivity is the ratio of value added to total employment, whereas effi ciency is the ratio of value added to the cost of all factors of production (capital, labour and other fac-tors). Low labour productivity does not necessarily imply low effi ciency, but may
14 The number of fi rms that closed is understated because it does not take into account those that were established between 1995 and 1999 but which had closed by the year 2000. This number is considerable because of the high failure rate of new enterprises.
15 Firm dynamics have also been found to be correlated with increased exports (Rod-riguez and Ter Wengel 2006; Sandee and Van Diermen 2004). These studies do not explain whether fi rms become exporters because they are more productive or whether they are more productive because they export.
TABLE 2 Evolution of Manufacturing Enterprises, 1994–2000a
Firm Size
20–49 9,459 4,059 5,400 43 5,747 5,895 102.6 50–99 3,324 922 2,402 28 2,199 1,536 69.9
100–199 2,429 553 1,876 23 1,695 912 53.8 200–499 2,112 423 1,689 20 1,646 653 39.7
500–999 935 156 779 17 797 229 28.7
1,000+ 758 74 684 10 746 119 16.0
Total 19,017 6,187 12,830 33 12,830 9,344 72.8
a Data refl ect number of fi rms unless otherwise indicated.
Source: BPS, Annual Manufacturing Survey, 1994–2000 (unpublished).
cBIEDec06.indb 346
cBIEDec06.indb 346 27/10/06 5:19:22 PM27/10/06 5:19:22 PM
instead refl ect low levels of input of complementary factors of production, or low skill levels. In this paper, value added per unit of labour is used as a proxy for effi ciency, however: ‘more productive’ is taken to indicate ‘more effi cient’. This is a reasonable simplifi cation when comparing fi rms of similar size, which are expected to have similar levels of technological sophistication.16
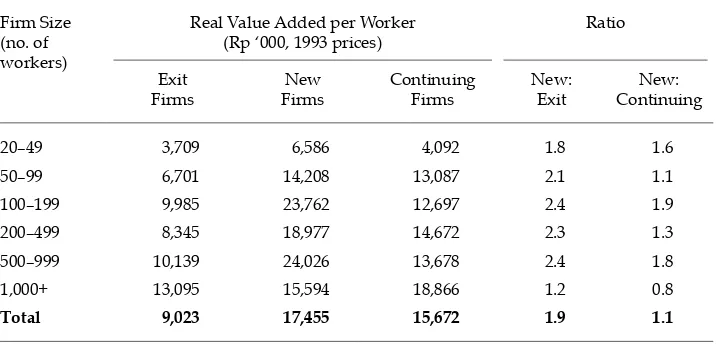
The productivity of labour for all fi rms that exited in the 1994–2000 period is measured in 1994, while the labour productivity of fi rms that entered during the period is measured in 2000. Both measurements are in constant 1993 prices. From table 3 it is apparent that entry fi rms on average have almost twice the productiv-ity of exit fi rms.
To what extent can the labour productivity difference between new and exit fi rms be attributed to the high productivity of new fi rms or the low productivity of exit fi rms? In order to answer this question we also compare the productivity of entry fi rms with that of continuing fi rms (‘the new-to-continuing’ ratio). In all but one case (the largest category of fi rms) this ratio of their labour productivity meas-ures is greater than unity, and in all cases it is lower than that for entry fi rms to exit fi rms in the same size categories. We conclude, therefore, that new fi rms have somewhat higher labour productivity than their continuing counterparts, but that the high ‘new-to-exit’ ratio arises from the exit of low productivity fi rms.
New, more productive entrants are able to cope with high entry costs in a very restrictive regulatory environment, among many other challenges. The higher pro-ductivity of new and continuing (relative to exiting) fi rms also helps to reduce the productivity gap between small and large fi rms. This gap is sensitive to aggregation
16 Empirical work on technical effi ciency needs to focus on a specifi c industry. For in-stance, Mini and Rodriguez (2000) explore the positive relationship between size and tech-nical effi ciency in the Philippines textile industry.
TABLE 3 Labour Productivity of Entry and Exit Firms, 1994–2000
Firm Size (no. of workers)
Real Value Added per Worker (Rp ‘000, 1993 prices)
Ratio
Exit Firms
New Firms
Continuing Firms
New: Exit
New: Continuing
20–49 3,709 6,586 4,092 1.8 1.6
50–99 6,701 14,208 13,087 2.1 1.1
100–199 9,985 23,762 12,697 2.4 1.9
200–499 8,345 18,977 14,672 2.3 1.3
500–999 10,139 24,026 13,678 2.4 1.8
1,000+ 13,095 15,594 18,866 1.2 0.8
Total 9,023 17,455 15,672 1.9 1.1
Source: BPS, Annual Manufacturing Survey, 1994–2000 (unpublished).
cBIEDec06.indb 347
cBIEDec06.indb 347 27/10/06 5:19:22 PM27/10/06 5:19:22 PM
by fi rm size, but is lower for new and continuing fi rms than for exit fi rms when we focus on fi rms with 20–99 workers and those with 100 workers or more.
Another way to estimate the contribution of ‘churning’ (entry and exit of fi rms) to increasing labour productivity is to use a simplifi cation of the decomposition method proposed by Foster, Haltiwanger and Krizan (1998: 16), based on Baily, Hulten and Campbell (1992):
ΔP = sCt–1.ΔpCt + (pCt–1 – Pt–1).ΔsCt + ΔpCt.ΔsCt + sNt(pNt – Pt–1) – sXt–1(pXt–1 – Pt–1) (1)
where
Pis average labour productivity in manufacturing;
sis labour employed in enterprises in the group (continuing, new or exit) as a share of total labour employed in manufacturing;
pis the labour productivity of enterprises in the group;
C, N and X are subscripts for groups of continuing, new and exiting fi rms, respectively; and
tandt–1 are time subscripts.
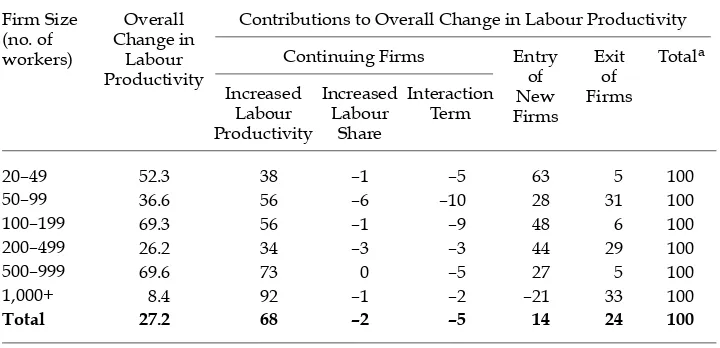
Equation (1) decomposes the change in labour productivity into fi ve terms. The fi rst captures the increase in productivity of the continuing enterprises, using their labour share in the initial period. The second shows the increase in productivity attributable to continuing enterprises due to the change in their share of labour employed between the initial and the fi nal period. The third captures the contribu-tion to productivity increase of continuing enterprises from the interaccontribu-tion of the change in their productivity and the change in their labour share. The fourth is the contribution to productivity increase resulting from entry of new enterprises, and the fi fth is that attributable to enterprise closures. Equation (1) is applied to fi rms in each of the six size categories (based on number of workers) shown in table 3.
Table 4 shows the results of the decomposition. For all enterprises combined, most of the increase in productivity (68%) was due to increases in the productivity of continuing fi rms. The balance was explained by the exit of relatively unproduc-tive enterprises and their replacement by higher productivity enterprises (the 4th and 5th terms sum to 38%). The shedding of relatively unproductive enterprises was accompanied by the entry of more productive ones—a clear pattern of ‘crea-tive destruction’, in line with the experience reported for 27 developing coun-tries by Bartelsman, Haltiwanger and Scarpetta (2005). Finally, restructuring and downsizing (increases in productivity accompanied by decreases in employment: 3rd term), rather than expansion, are also associated with gains in productivity, as the negative sign for the interactive term for continuing fi rms indicates.17
The results in table 4 vary by fi rm size. Among the smallest enterprises covered in this study (those with 20 to 49 workers), the lion’s share (63%) of the increase in productivity is attributable to the entry of new enterprises. Among the largest enterprises (those with 1,000 workers or more), most of the increase is attribut-able to a rise in the productivity of continuing enterprises and the closure of less productive fi rms.
17 The sign of the interactive term is also compatible with the study of Bartelsman, Halti-wanger and Scarpetta (2005).
cBIEDec06.indb 348
cBIEDec06.indb 348 27/10/06 5:19:23 PM27/10/06 5:19:23 PM
A SUB-SECTORAL VIEW OF PRODUCTIVITY GROWTH
This section compares labour productivity of entry and exit enterprises by man-ufacturing sub-sector. It also uses the number of workers to fi nd evidence of creative destruction at the sub-sectoral level. Because of the need to look at the behaviour of continuing fi rms as well as entry and exit fi rms, the analysis cannot be conducted using only the number of fi rms.
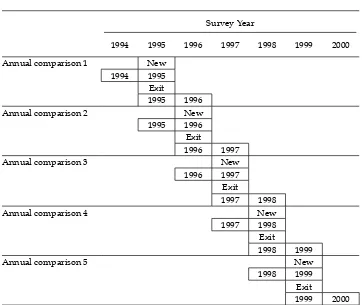
Work by Dunne and Roberts (1988) for the US has established a strong cor-relation between entry and exit rates across industrial sectors. In our dataset, for the period 1994–2000, we are able to conduct fi ve such annual comparisons, as depicted in the data utilisation scheme presented in fi gure 1, in which we com-pare the productivity of fi rms that exit with that of fi rms that enter in the same year. The methodology causes us to lose the endpoints of the data. Thus, we have exit fi rms in 1994 whose productivity we cannot compare with that of entry fi rms in 1994 (similarly, we have new fi rms in 2000 but we do not know which fi rms will exit by 2001). The year 1995 is the fi rst for which we can obtain full year data on both entrants and exit enterprises by industrial sector. Since the data collec-tion for the annual manufacturing surveys is usually carried out in the fi rst few months following a completed year, 1995 is the fi rst year for which we have data on enterprises that are in the survey in 1995 and were not listed in 1994. Unfortu-nately, we cannot employ the output data for enterprises that were present in 1994 but absent in 1995, because these are expressed in 1994 values. We would need sub-sectoral defl ators to compare data in 1994 values with data in 1999 values. We prefer not to use such defl ators because of their inaccuracy. Even if the 1994 data could be employed, the comparison would not make very much sense. Our implicit model is that more productive entry enterprises encourage the exit of less
TABLE 4 Contributions to Increased Labour Productivity in Manufacturing, 1994–2000
Contributions to Overall Change in Labour Productivity
Continuing Firms Entry
Source: Authors’ calculations, based on equation (1).
cBIEDec06.indb 349
cBIEDec06.indb 349 27/10/06 5:19:23 PM27/10/06 5:19:23 PM
productive enterprises. Therefore, if we have new enterprises in 1995, the relevant exit enterprises are those that were present in 1995 but were no longer there in 1996. Since we are comparing entry and exit enterprises on the basis of data for the same year, it does not matter that we do not have sub-sectoral defl ators.
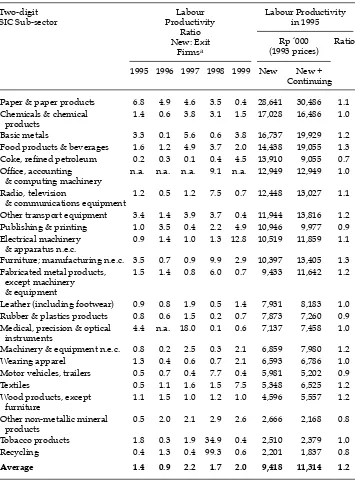
Table 5 presents labour productivity fi gures in constant price terms, using economy-wide defl ators to compare the labour productivity of entry and exit enterprises by 2-digit SIC (Standard Industrial Classifi cation) manufacturing sub-sector. The table shows that entrants have higher labour productivity than enterprises that exited. On average over the fi ve years 1995–99, the productivity of the entry enterprises was more than 60% higher than that of the exit enter-prises. (For certain sub-sectors, the reduced number of fi rms and the impact of the 1997–98 crisis have resulted in empty cells or extreme values.) The averages shown at the bottom of the table represent the ‘new-to –exit’ ratio of total value added per worker for all sectors. In four out of the fi ve years it is considerably higher than unity. In presenting data on the productivity of new enterprises, we include only those enterprises that continued through the year 2000. The last column of table 5 shows that, on average, new enterprises in 1995 were only 20% more productive than all new and continuing fi rms in the same sub-sector.
FIGURE 1 The 1994–2000 Data Utilisation Schemea
Survey Year
1994 1995 1996 1997 1998 1999 2000
Annual comparison 1 New 1994 1995 Exit
1995 1996 Annual comparison 2 New 1995 1996 Exit
1996 1997
Annual comparison 3 New
1996 1997 Exit
1997 1998
Annual comparison 4 New
1997 1998 Exit
1998 1999
Annual comparison 5 New
1998 1999 Exit
1999 2000
a A fi rm is classifi ed as an exit enterprise in the year prior to its exit.
cBIEDec06.indb 350
cBIEDec06.indb 350 27/10/06 5:19:24 PM27/10/06 5:19:24 PM
TABLE 5 Productivity of New Enterprises with Respect to Exit and New and Continuing Firms
Two-digit
Paper & paper products 6.8 4.9 4.6 3.5 0.4 28,641 30,486 1.1 Chemicals & chemical
products
1.4 0.6 3.8 3.1 1.5 17,028 16,486 1.0
Basic metals 3.3 0.1 5.6 0.6 3.8 16,737 19,929 1.2 Food products & beverages 1.6 1.2 4.9 3.7 2.0 14,438 19,055 1.3 Coke, refi ned petroleum 0.2 0.3 0.1 0.4 4.5 13,910 9,055 0.7
Other transport equipment 3.4 1.4 3.9 3.7 0.4 11,944 13,816 1.2 Publishing & printing 1.0 3.5 0.4 2.2 4.9 10,946 9,977 0.9 Electrical machinery
& apparatus n.e.c.
0.9 1.4 1.0 1.3 12.8 10,519 11,859 1.1
Furniture; manufacturing n.e.c. 3.5 0.7 0.9 9.9 2.9 10,397 13,405 1.3 Fabricated metal products,
except machinery & equipment
1.5 1.4 0.8 6.0 0.7 9,433 11,642 1.2
Leather (including footwear) 0.9 0.8 1.9 0.5 1.4 7,931 8,183 1.0 Rubber & plastics products 0.8 0.6 1.5 0.2 0.7 7,873 7,260 0.9 Medical, precision & optical
instruments
4.4 n.a. 18.0 0.1 0.6 7,137 7,458 1.0
Machinery & equipment n.e.c. 0.8 0.2 2.5 0.3 2.1 6,859 7,980 1.2 Wearing apparel 1.3 0.4 0.6 0.7 2.1 6,593 6,786 1.0 Motor vehicles, trailers 0.5 0.7 0.4 7.7 0.4 5,981 5,202 0.9 Textiles 0.5 1.1 1.6 1.5 7.5 5,348 6,525 1.2 Wood products, except
Tobacco products 1.8 0.3 1.9 34.9 0.4 2,510 2,379 1.0 Recycling 0.4 1.3 0.4 99.3 0.6 2,201 1,837 0.8
Average 1.4 0.9 2.2 1.7 2.0 9,418 11,314 1.2
n.a. = not applicable.
n.e.c. = not elsewhere classifi ed.
a Extreme values of the productivity ratios result from small sample size and, perhaps, the impact of the 1997–98 crisis.
Source: BPS, Annual Survey of Large and Medium Manufacturing, 1994–2000 (unpublished).
cBIEDec06.indb 351
cBIEDec06.indb 351 27/10/06 5:19:24 PM27/10/06 5:19:24 PM
This 1995 average fi gure is quite representative of the other years in this period (not shown in the table). In other words, the fact that the average ‘new-to-exit’ enterprise productivity ratio is higher than the representative 1995 continuing’ ratio suggests that gains in productivity must arise mainly from the exit of the least productive fi rms.
Over time, productivity comparisons for sub-sectors present methodological diffi culties because of the need to use sub-sector price indices. One way to make inter-temporal comparisons is to focus on changes in the number of workers—that is, jobs created or destroyed. In fact, job creation or destruction helps illustrate the main hypothesis of this paper: more productive (new and expanding-continuing) enterprises push out less productive (exit and contracting-continuing) enterprises. This hypothesis would be further corroborated if we could show that the exit of fi rms occurs in the same sectors as the entry of fi rms, and that the contraction of continuing fi rms occurs in the same sectors as the expansion of continuing fi rms, using job fl ows (jobs created and jobs destroyed per sector).
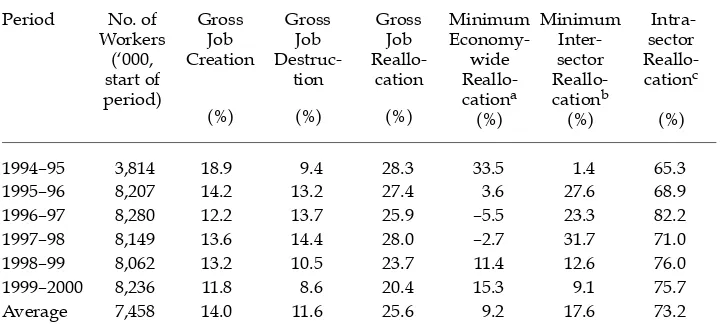
Over the period 1994–2000, the number of jobs created by new and expanding-continuing enterprises and the number of jobs destroyed in contracting- expanding-continuing and exit enterprises have been large, with a noticeable decline in the latter years. We follow the methodology outlined by Dunne, Roberts and Samuelson (1989: 65) to establish the proportion of jobs that are accounted for by (i) the general growth or decline of the manufacturing sector (ΔLt); (ii) between sub-sector (or inter-sub-sector) reallocation; and (iii) within sub-sector (or intra-sub-inter-sub-sector) reallocation.
For each sub-sector, s, we defi ne new enterprise job creation (NEJC), continuing enterprise job creation (CEJC), continuing enterprise job destruction (CEJD) and exit enterprise job destruction (EEJD), where L stands for employment.
NEJCs Lt
Summing the gain in jobs in all sub-sectors in the new and expanding- continuing enterprises, we obtain gross job creation (GJC). Similarly, for the continuing and exit enterprises we obtain gross job destruction (GJD). Then gross job reallocation (GJR) equals the sum of GJC and GJD. Defi ning sub-sectoral job
where Ls stands for sub-sector employment, GJR can be decomposed into three components: (i) the minimum amount of job reallocation required to accommodate the growth or decline of the economy; (ii) the minimum reallocation necessary to accommodate the growth or decline of sub-sectors; and (iii) the intra-sub- sectoral reallocation that takes place. The decomposition is shown in the last three columns
cBIEDec06.indb 352
cBIEDec06.indb 352 27/10/06 5:19:25 PM27/10/06 5:19:25 PM
TABLE 6 Job Creation and Destruction in Manufacturing, 1994–2000
1994–95 3,814 18.9 9.4 28.3 33.5 1.4 65.3 1995–96 8,207 14.2 13.2 27.4 3.6 27.6 68.9 1996–97 8,280 12.2 13.7 25.9 –5.5 23.3 82.2 1997–98 8,149 13.6 14.4 28.0 –2.7 31.7 71.0 1998–99 8,062 13.2 10.5 23.7 11.4 12.6 76.0 1999–2000 8,236 11.8 8.6 20.4 15.3 9.1 75.7 Average 7,458 14.0 11.6 25.6 9.2 17.6 73.2
a The minimum amount of job reallocation required to accommodate the growth or decline of the economy.
b The minimum reallocation necessary to accommodate the growth or decline of sub-sectors.
c The reallocation that takes place within sub-sectors.
Source: Authors’ calculations.
of table 6, which indicate that almost three-quarters of the job reallocation (from low to high productivity fi rms) takes place within well-defi ned (3-digit SIC) sub-sectors, while less than one-fi fth occurs across sub-sectors.
CONCLUSIONS
This paper demonstrates that entry and exit of fi rms plays an important role in the dynamics of Indonesian manufacturing. Over the period 1994–2000, in any one year about 10% of the manufacturing base was renewed. New and more productive enterprises entered and pushed out less productive enterprises. The labour produc-tivity of entry enterprises was found to be only a little higher than that of continuing fi rms, implying that gains in productivity must have been due mainly to the exit of low productivity competitors. A decomposition exercise showed that the increase in productivity refl ected the relative productivity of continuing fi rms, the entry of new and more productive enterprises, and the closure of failing fi rms.
After investigating productivity gains for fi rms in various size categories, we examined productivity at the sub-sectoral level. The purpose of this change of measurement angle was to add further support to our proposition that high pro-ductivity enterprises push out less productive ones. At the sub-sectoral level we tracked the performance of entry and exit fi rms for fi ve years, and found that on average, for any one year, the productivity of new enterprises was greater than that of those set to exit in the following year. At the sub-sectoral level we also examined changes in the number of jobs. There was substantial job reallocation, especially within (as opposed to between) manufacturing sub-sectors.
cBIEDec06.indb 353
cBIEDec06.indb 353 27/10/06 5:19:26 PM27/10/06 5:19:26 PM
Despite the complex prevailing regulatory framework, fi rm dynamics have clearly played a key role in productivity growth within the important manu-facturing sector of the economy during one of the most turbulent episodes of Indonesia’s economic history. Is there any room for policy intervention? Regula-tions that lower the costs of entry—such as simplifi ed registration and licensing procedures—as well as those that facilitate the exit of fi rms—such as effective bankruptcy laws and well-functioning courts—are recognised as policy levers to facilitate the establishment and expansion of more productive fi rms and the release of resources tied up in less productive ones. Policies that aim to promote entry of new fi rms are therefore to be encouraged, whereas those that aim to prevent fi rm closures, usually justifi ed on the grounds of avoiding increases in unemployment, are misguided and counter-productive, since there are always new—and usually more productive—fi rms ready to take their place. Little is yet known about how laws and regulations affect fi rm dynamics and productivity, on which Indonesians depend to increase their prospects of better and more plentiful jobs. As the government attempts to fi nd ways to increase growth prospects, and as international donors continue to press for regulatory reform, more micro-level research will be required to guide the process.
REFERENCES
Asia Foundation (2004) ‘Decentralization and local governance in Indonesia’, The Asia Foundation, Jakarta, January, <http://www.asiafoundation.org/>.
Asia Foundation (2005) ‘Streamlining business licensing: an evaluation of the impact of one-stop centers’, The Asia Foundation, Jakarta, July, <http://www.asiafoundation. org/>.
Asia Foundation (2006) ‘Improving the business environment in Indonesia’, The Asia Foundation, Jakarta, March, <http://www.asiafoundation.org/>.
ADB (Asian Development Bank) (2000) Report and Recommendation of the President to the Board of Directors on a Proposed Loan to the Republic of Indonesia for Industrial Competitiveness and Small and Medium Enterprise Development, Manila (Loan No. 1738 for $200 million), <http://www.adb.org>.
ADB (Asian Development Bank) (2001) ‘Improving the regulatory framework for SMEs: streamlining business formalization procedures and facilitating one-stop services’, Policy Paper No. 7, Jakarta, October, also in Final Report of ADB’s Technical Assistance to the Republic of Indonesia for Small and Medium Enterprise Development (TA No. 3417), Manila, 2002.
ADB (Asian Development Bank) (2002) Final Report of ADB’s Technical Assistance to the Republic of Indonesia for Promotion of Deregulation and Competition (TA No. 3416), Manila.
Baily, Martin, Hulten, Charles and Campbell, David (1992) ‘Productivity dynamics in man-ufacturing plants’, Brookings Papers on Economic Activity: Microeconomics: 187–249. Bartelsman, Eric, Haltiwanger, John and Scarpetta, Stefano (2005) ‘Microeconomic
evi-dence of creative destruction in industrial and developing countries’, Working Paper, The World Bank, Washington DC.
Bernard, Andrew B. and Jensen, J. Bradford (2002) ‘The deaths of manufacturing plants’, NBER Working Paper 9026, July.
Berry, Albert, Rodriguez, Edgard and Sandee, Henry (2001) ‘Small and medium enterprise dynamics in Indonesia’, Bulletin of Indonesian Economic Studies 37 (3): 363–84.
cBIEDec06.indb 354
cBIEDec06.indb 354 27/10/06 5:19:26 PM27/10/06 5:19:26 PM
Berry, Albert, Rodriguez, Edgard and Sandee, Henry (2002) ‘Firm and group dynamics in the SME sector in Indonesia’, in Small Firm Dynamism in East Asia, Farrukh Iqbal and Shujiro Urata (eds), Kluwer Academic Publishers, Dordrecht: 141–61.
Berry, Albert and Mazumdar, Dipak (1991) ‘Small-scale industry in the Asian-Pacifi c region’, Asian-Pacifi c Economic Literature 5 (2): 35–67.
Dunne, Timothy and Roberts, Mark J. (1988) ‘Patterns of fi rm entry and exit in U.S. manu-facturing industries’, Rand Journal of Economics 19 (Winter): 495–515.
Dunne, Timothy, Roberts, Mark J. and Samuelson, Larry (1989) ‘Plant turnover and gross employment fl ows in the US manufacturing sector’, Journal of Labour Economics 7 (1): 48–71.
Foster, Lucia, Haltiwanger, John and Krizan, C.J. (1998) ‘Aggregate productivity growth: lessons from microeconomic evidence’, National Bureau of Economic Research (NBER) Working Paper No. 6803, November.
IMF (International Monetary Fund) (2005) Staff report for the 2005 Article IV consultation and third post-program monitoring discussions, IMF Country Report No. 05/326, 21 June.
Kuncoro, Ari (2004) ‘Bribery in Indonesia: some evidence from micro-level data’, Bulletin of Indonesian Economic Studies 40 (3): 329–54.
Melitz, Marc J. (2002) ‘The impact of trade on intra-industry reallocations and aggregate industry productivity’, National Bureau of Economic Research (NBER) Working Paper No. 8881, April.
Mini, Federico and Rodriguez, Edgard (2000) ‘Technical effi ciency indicators in a Philip-pine manufacturing sector’, International Review of Applied Economics 14 (4): 461–73. Rodriguez, Edgard (2004) ‘An overview of donors’ role in SME development in
South-east Asia after the crisis’, in Entrepreneurship and SMEs in SouthSouth-east Asia’s Economic Development, Denis Hew and Loi Wee Nee (eds), Institute of Southeast Asian Studies, Singapore.
Sandee, Henry and Van Diermen, Peter (2004) ‘Exports by SMEs in Indonesia’, in Business in Indonesia: New Challenges, Old Problems, M. Chatib Basri and Pierre van der Eng (eds), Institute of Southeast Asian Studies, Singapore.
Schneider, Friedrich (2002) Size and measurement of the informal economy in 110 coun-tries around the world, Department of Economics, Johannes Kepler University of Linz, Austria, July (mimeo).
Schroeder-van Waes, Marie-Christine and Sidharta, Kevin Omar (2004) ‘Upholding Indo-nesian bankruptcy legislation’, in Business in Indonesia: New Challenges, Old Problems, M. Chatib Basri and Pierre van der Eng (eds), Institute of Southeast Asian Studies, Singapore.
Schumpeter, Joseph A. (1942) Capitalism, Socialism and Democracy, Unwin, London.
Ter Wengel, Jan and Rodriguez, Edgard (2006) ‘SME export performance in Indonesia after the crisis’, Small Business Economics 26 (1): 25–37.
World Bank (2003) Doing Business 2004: Understanding Regulations, Washington DC. World Bank (2004) Doing Business 2005: Removing Obstacles to Growth, Washington DC. World Bank (2005a) Doing Business 2006: Protecting Investors, Washington DC.
World Bank (2005b) Raising investment in Indonesia: a second generation of reform, Report No. 31708-ID, East Asia Poverty Reduction and Economic Management Unit, Washington DC, February.
World Bank (2006) Doing Business 2007: How to Reform, Washington DC.
cBIEDec06.indb 355
cBIEDec06.indb 355 27/10/06 5:19:27 PM27/10/06 5:19:27 PM
The 25th
Indonesia Update Conference
ISLAMIC LIFE AND POLITICS
The Australian National University Friday and Saturday, 7–8 September 2006
Some 190 million Indonesians profess Islam as their faith. But what precisely is the role of Islam in their private and public lives? How is this changing in contemporary Indonesia?
Considerable research has been done on specifi c aspects of Indonesian Islam, such as politics, liberal thought and violent radicalism, but a great many other aspects are little studied and poorly understood outside Indonesia’s Islamic community. For example, growing numbers of Muslims, particularly in urban areas, are seeking more overtly Islamic expressions of their identity. This is evident in the rising popularity of shari’a banking and insurance, Islamic spiritual healing and traditional treatments such as cupping and herbal remedies, Muslim fashions, Islamic multi-level marketing, corporate mystical brotherhoods and new electronic preaching media such as video-stream sermons to mobile phones, cyber chat rooms and satellite television programs.
This conference will examine the multi-dimensional nature of contemporary Indonesian Islam. It will take a critical look at developments in politics and radicalism, as well as the increasing Islamisation of the economy, marketing and health and education services. The aim is to capture the complexity and rapidly changing nature of Islamic religiosity.
Conference convenors
Greg Fealy Research School of Pacifi c and Asian Studies and Faculty of Asian Studies
greg.fealy@anu.edu.au
Sally White Research School of Pacifi c and Asian Studies sally.white@anu.edu.au
The annual Indonesia Update is presented by the Indonesia Project, Economics Division, Research School of Pacifi c and Asian Studies (RSPAS), and the Department of Political and Social Change (RSPAS) at the Australian National University (ANU). Support from the Australian Agency for International Development (AusAID) and ANU is gratefully acknowledged.
Enquiries Indonesia.Project@anu.edu.au Ph +61 2 6125 3794
Fax +61 2 6125 3700
http://rspas.anu.edu.au/economics/ip
cBIEDec06.indb 356
cBIEDec06.indb 356 27/10/06 5:19:27 PM27/10/06 5:19:27 PM