Full Terms & Conditions of access and use can be found at
http://www.tandfonline.com/action/journalInformation?journalCode=vjeb20
Download by: [Universitas Maritim Raja Ali Haji] Date: 11 January 2016, At: 22:05
Journal of Education for Business
ISSN: 0883-2323 (Print) 1940-3356 (Online) Journal homepage: http://www.tandfonline.com/loi/vjeb20
Where Did They Go? Market Share Trends of
Business Student Enrollment at Public,
Not-for-Profit, and For-Profit Institutions From 1996 to
2008
Bonnie Kathleen Fox Garrity
To cite this article: Bonnie Kathleen Fox Garrity (2012) Where Did They Go? Market Share Trends of Business Student Enrollment at Public, Not-for-Profit, and For-Profit Institutions From 1996 to 2008, Journal of Education for Business, 87:6, 309-315, DOI: 10.1080/08832323.2011.625997
To link to this article: http://dx.doi.org/10.1080/08832323.2011.625997
Published online: 30 Aug 2012.
Submit your article to this journal
Article views: 151
View related articles
CopyrightC Taylor & Francis Group, LLC ISSN: 0883-2323 print / 1940-3356 online DOI: 10.1080/08832323.2011.625997
Where Did They Go? Market Share Trends of
Business Student Enrollment at Public,
Not-for-Profit, and For-Profit Institutions From 1996
to 2008
Bonnie Kathleen Fox Garrity
D’Youville College, Buffalo, New York, USAThe author presents the trends in market share of business student enrollment at public, not-for-profit, and for-profit 4-year-and-above institutions from 1996 to 2008. Although each sector of the institutions has experienced growth in overall enrollments, the relative market share of public and not-for-profit institutions has dropped, whereas the market share held by for-profit institutions has increased to 20% of business students at 4-year-and-above institutions by 2008. The key player institutions in the enrollment of business students in 2008 are presented. The author gives an explanation for the shift in market share and discusses the implications and strategies for response to the changes.
Keywords: business students, for-profit, not-for-profit, public
According to the National Center for Education Statistics (2010), there were 4 million postsecondary business students in the United States in 2008, making business the single largest major field of study. Sixty-five percent (2.6 million) of these students were enrolled in 4-year-and-above institutions. Postsecondary education in the United States is offered by a combination of public, not-for-profit, and for-profit in-stitutions. Statistics are readily available related to the total numbers of business students and the relative market share of all students by control of the institution. However, there are no publications or statistics available which provide market share data on the enrollment of business students by control of the institution.
I begin with a review of the literature on enrollment data and business students. The methodology section in-cludes an overview of the Integrated Postsecondary Edu-cation Database System (IPEDS) and the calculations used in the study. Descriptive results of the enrollment and market share of business students are provided, as is a discussion of the results as related to the reasons, implications, and possible responses to the observed trends.
Correspondence should be addressed to Bonnie Kathleen Fox Garrity, D’Youville College, Department of Business, 320 Porter Avenue, Buffalo, NY 14201, USA. E-mail: [email protected]
REVIEW OF LITERATURE
Postsecondary Enrollment
In the fall of 2008 there were 19.6 million students enrolled in Title IV participating postsecondary institutions (Knapp, Kelly-Reid, & Ginder, 2010). These are institutions eligible to grant Title IV student financial aid such as Pell Grants and federally subsidized student loans to their students. Of the 19.6 million students, 62% were enrolled in 4-year-and-above institutions (Knapp, Kelly-Reid, & Ginder, 2010).
Undergraduate enrollment at 4-year-and-above institu-tions has grown by 35% (from 6,960,470 to 9,394,633 stu-dents) and enrollment at the graduate level has increased by 32% (from 2,072,275 to 2,736,803 students) between 1998 and 2008 (author’s calcuations based on data from Snyder & Dillow, 2011; Snyder & Hoffman, 2001).
Postsecondary education is provided by public, not-for-profit, and for-profit providers competing for student enrollments in a mixed-form market (see Marwell & McInerney, 2005). Market share is not evenly distributed. Public providers hold the largest market share with 60% (5,951,146 students) of the students at 4-year-and-above institutions whereas not-for-profits hold 30% (2,501,181 students) and for-profits hold 10% (942,306 students; Knapp et al., 2010). In addition, each sector of institution has
310 B. K. FOX GARRITY
experienced different growth rates resulting in changing market shares. Between 1998 and 2008, undergraduate enrollment at 4-year-and-above institutions grew 26% (from 4,714,943 to 5,951,146 students) at public institutions, 20% (from 2,088,197 to 2,501,181 students) at not-for-profit institutions, and 499% (from 157,330 to 942,306 students) at for-profit institutions (author’s calculations based on data from Snyder & Dillow, 2011; Snyder & Hoffman, 2001).
Business Student Enrollment
Business student enrollments represent the single largest ma-jor field of study in the United States. During the 2007–2008 year, 16% of students were enrolled in business, manage-ment, and marketing major fields of study (National Center for Education Statistics, 2010). When including economics, the percentage increases to 17% of students. At 4-year-and-above institutions, enrollments of business students account for 20% of all student enrollments (National Center for Ed-ucation Statistics).
Expense Structures
Expense structures differ between institutions and among sectors of institutions. Most public and not-for-profit institutions provide a subsidy to students whose tuition dollars do not cover the entire expense of the education provided (Winston, 1999b). These subsidies are provided by government grants to the institutions or through private donations. Public and not-for-profit institutions vary widely in the amount of subsidy provided (Winston, 1999b). These subsidies of students may serve as barriers to entry of for-profits (Winston, 1999a). Due to these subsidies, increases in enrollment at not-for-profit and public institutions may lead to increased expenses without an equivalent increase in revenue. However, for-profit institutions rarely provide a subsidy to students (Winston, 1999a) and compete through minimization of expenses (Turner, 2006).
Not only are many students subsidized by not-for-profit and public institutions, students enrolled in some majors are subsidized by students enrolled in other majors. Although peer-reviewed literature on the topic is rare, the direct and in-direct instructional costs associated with courses and depart-ments differ (McChlery & Rolfe, 2004; Middaugh, 1996). Business courses carry relatively low instructional costs com-pared with some disciplines on campus (Ahumada, 1992). Even though expenses differ, students are often charged the same tuition regardless of major field of study or elective courses selected. Thus the difference between tuition charged and expenses incurred differs depending on the major field of study and course schedules. Students in lower expense programs, therefore, subsidize the education of the students in higher expense programs.
Winston (1999a) and Kelly (2001) suggested that func-tional cherry-picking may take place by for-profits where services and programs with the greatest difference between
expenses and revenue will be targeted by for-profits. There-fore, as lower expense programs with 3.5 million students, business programs may be an attractive entry point for for-profit providers.
Not only would the increase in for-profit provision of busi-ness education impact enrollments in the busibusi-ness programs on public and not-for-profit campuses, it may negatively im-pact the ability of these same institutions to continue offering higher expense programs if they fail to maintain enrollments in lower expense programs such as business to sufficiently subsidize the students in the higher expense programs.
For-Profit Business Education History
For-profit provision of business education is not a new con-cept in the United States. Approximately 250 proprietary or for-profit business schools were in existence by 1890 with 81,000 students (Kinser, 2006a). One of the earliest for-profit institutions still in existence is Bryant and Stratton, which was established in 1852 and is credited with pioneering cur-riculum and textbook standardization to minimize expenses, which are techniques still utilized by many for-profit insti-tutions (Kinser). However, the movement toward for-profit provision of 4-year-and-above education has been a relatively recent phenomenon.
RESEARCH QUESTIONS
The published data include extensive tables detailing insti-tutional enrollments. Unfortunately, there are no published sources on enrollments by major within the different insti-tutional sectors. This lack of analysis leaves a gap in the data available to inform enrollment management and busi-ness department strategic planning initiatives. Therefore, in this article I will answer the following research questions:
Research Question 1:What were the trends in enrollment of business students at public, not-for-profit, and for-profit 4-year-and-above institutions between 1996 and 2008?
Research Question 2:What were the trends in relative market share of business students at public, not-for-profit, and for-profit 4-year-and-above institutions between 1996 and 2008?
Research Question 3:Which institutions were the key players in the enrollment of business majors in 2008?
METHOD
The National Center for Education Statistics (NCES) collects data from all postsecondary institutions that participate in the Title IV student aid programs such as Pell Grants and feder-ally subsidized student loans. Therefore, this dataset contains data on nearly all institutions in the United States. All par-ticipating institutions are required to complete nine surveys each year to be in compliance with the Higher Education
TABLE 1
Total Business Students Enrolled in 4-Year-and-Above Institutions
Type 1996 1998 2000 2002 2004 2006 2008
Public 721,457 729,999 752,456 891,254 909,264 951,339 1,012,747
Not-for-profit 507,374 488,562 455,116 602,995 612,640 644,999 675,400
For-profit 44,952 29,629 64,889 159,572 277,400 369,861 433,455
Total 1,273,783 1,248,190 1,272,461 1,653,821 1,799,304 1,966,198 2,121,602
Note.Data from my calculations from Integrated Postsecondary Education Database System data.
Act (2008) as amended. In addition, during even numbered years, 4-year institutions are required by the Office of Civil Rights Compliance to report enrollment data in nine specific fields of study including business management and adminis-trative sciences. These data are then made available through the IPEDS for research use. This provides data on the entire population of Title IV participating institutions for analysis. For this study, enrollment and institutional characteristics files for each of the seven years included in the study were downloaded from the IPEDS system. Syntax files were run. Files were then restructured, variables were calculated, and files were matched using SPSS to pair enrollment by major (CIP Code) with sector of the institution for each year. The dataset for each year contained approximately 2,000 institu-tions.
The values for the 2006 enrollments of business students were imputed for 97 institutions (54 of which were campuses of the University of Phoenix) due to a lack of reported or re-leased data by major that year. The imputation was completed by averaging the 2004 business student enrollment with the 2008 business student enrollment for institutions that had data reported for both 2004 and 2008 but none for 2006.
RESULTS
Research Question 1
What were the trends in enrollment of business students at public, not-for-profit, and for-profit 4-year-and-above insti-tutions between 1996 and 2008? Enrollments of business
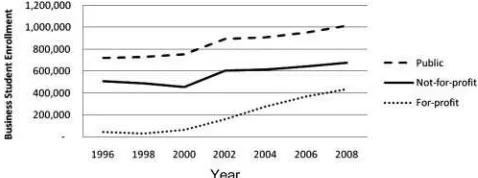
FIGURE 1 Total enrollment of business students at 4-year-and-above institutions 1996–2008. Data from my calculations from Integrated Postsec-ondary Education Database System data.
students in all sectors of institutions have increased from 1996 to 2008 (see Table 1 and Figure 1). There was a slight decline in enrollments at not-for-profit institutions in 1998 and 2000 and at for-profit institutions in 1998, but the gen-eral trend has been growth with ovgen-erall enrollments growing from 1.3 million in 1996 to 2.1 million in 2008.
However, the increases have not been proportionate among the sectors. The for-profit sector has shown the great-est percentage increase in business student enrollments with greater than an 850% increase in business students from 1996 (44,952) to 2008 (433,455; see Table 1), whereas public and not-for-profit institutions reported increases of 40% (from 721,457 to 1,012,747) and 33% (from 507,374 to 675,400), respectively.
Figure 1 shows the general trends within each sector with the greatest increases in each sector from 2000 to 2008. By 2008, more than 1 million business students were enrolled in 4-year-and-above public institutions, which was nearly half of all business students. At this same time not-for-profits en-rolled 675,000 business students whereas for-profits enen-rolled the smallest number of business students, 433,000. Evident in this figure is the narrowing of the gap between total business student enrollments at not-for-profit and for-profit institu-tions.
Research Question 2
What were the trends in relative market share of business students at public, not-for-profit, and for-profit, 4-year-and-above institutions between 1996 and 2008? Figure 2 shows the relative market share of each sector of institution in each year of the study. Despite the growth in enrollments in each sector, there was a striking increase in for-profit market share with a resulting decrease in market share in the public and not-for-profit sectors. Public institutions en-rolled 59% (from 752,456 of 1,272,461) of business stu-dents in 2000. Within just 8 years, the public market share declined to 48% (from 1,012,747 of 2,121,602). Not-for-profit institutions had their highest market share in 1996 at 40% (from 507,374 of 1,273,783). Although hovering around 36% for several years of the study, they have declined to 32% (from 675,400 of 2,121,602) in 2008. By 2008 for-profit institutions enrolled 20% (from 433,455 of 2,121,602) of the business students at 4-year-and-above institutions,
312 B. K. FOX GARRITY
FIGURE 2 Market share of business student enrollment at 4-year-and-above Institutions 1996–2008. Data from my calculations from Integrated Postsecondary Education Database System data. Percentages may not sum to 100% due to rounding.
up from a low of 2% (from 44,952 of 1,273,783) in 1998 (see Figure 2).
Research Question 3
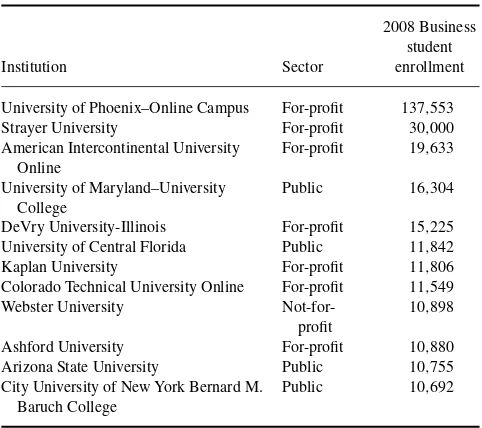
Which institutions were the key players in the enrollment of business majors in 2008? A key player in the market for business student enrollment is defined as an institution with greater than 10,000 business students. Table 2 lists the 12 key player institutions in 2008. The top three institutions were all for-profit, including the University of Phoenix online campus (137,553), Strayer University (30,000), and Ameri-can Intercontinental University (19,633). The University of Phoenix Online Campus enrolled 6.5% of all business stu-dents at 4-year-and-above institutions in 2008. This total does not include the land-based enrollments at the 73 other Uni-versity of Phoenix campuses located throughout the United States.
Of the 12 key player institutions, one was not-for-profit, four were public, and seven were for-profit. These 12 key players held a combined 14% market share of the business student enrollments at 4-year-and-above institutions.
DISCUSSION
The relative loss of market share within the public and not-for-profit sectors may not have been evident because each sector of institution has generally experienced increases in business student enrollments during the years of the study. However, those increases have not been great enough to keep pace with the growth of the for-profit sector.
The compounded annual growth rate of the market of busi-ness students has been 4.75% (from 1,273,783 to 2,121,602) from 1996 to 2008. For-profit institutions as a sector ex-perienced a 22.88% (from 44,952 to 433,455) compounded annual growth rate whereas public and not-for-profit institu-tions had a 3.13% (from 721,457 to 1,012,747) and 2.63% (from 507,374 to 675,400) compounded annual growth rates,
TABLE 2
Key Players in the 2008 Market for Business Students
Institution Sector
2008 Business student enrollment
University of Phoenix–Online Campus For-profit 137,553
Strayer University For-profit 30,000
American Intercontinental University Online
For-profit 19,633
University of Maryland–University College
Public 16,304
DeVry University-Illinois For-profit 15,225
University of Central Florida Public 11,842
Kaplan University For-profit 11,806
Colorado Technical University Online For-profit 11,549
Webster University
Not-for-profit
10,898
Ashford University For-profit 10,880
Arizona State University Public 10,755
City University of New York Bernard M. Baruch College
Public 10,692
Note.Data from my calculations from Integrated Postsecondary Educa-tion Database System data.
respectively, from 1996 to 2008. With annual growth rates lower than the market growth rate, these sectors of institu-tions were not taking advantage of the growth of the market and were losing market share to the for-profit sector.
The increase in market share of for-profit institutions is clearly related to the growth of one institution (University of Phoenix), which may be deemed to be atypical of the for-profit sector (Kinser, 2006b), leading some to ignore the overall growth rate of for-profit market share; however, the list of key players contains six other for-profit institutions demonstrating that dismissing the growth of the sector based upon one key player would be fallacious.
Three key player institutions are online campuses of for-profit institutions. This could lead to an assumption that most online business students are enrolled at for-profit institutions and that the growth of for-profit institutions is driven by a disproportionate enrollment of online students. The growth of online enrollments has contributed to the expansion of the market of business students, with 60% of fully online business programs reporting increased student enrollments between fall 2009 and fall 2010 (Allen & Seaman, 2010).
Reports of online course enrollment growth vary, ranging from an annual rate of 21% (Allen & Seaman, 2010) to 40% (Lee & Nguyen, 2007). However, for-profit institutions are not the leader in overall online (nonhybrid) course enroll-ments. At 4-year-and-above institutions publics have more than 2.4 million (45%), for-profits have more than 1.6 million (30%), and not-for-profits have more than 1.3 million (25%) online course enrollments (Parsad, Lewis, & Tice, 2008).
So, although online enrollments have certainly con-tributed to the growth of the business student market and
for-profit provision of business education at online campuses, growth of online enrollments is not likely the sole reason for the increase in for-profit market share. Further study of the changes in online enrollments in business programs by sector over time is suggested.
The size of the key players in the market suggests the pursuit of economies of scale in the provision of business education to minimize expenses. However, at public and not-for-profit institutions, the subsidies provided to students may discourage many institutions from pursuing the growth rates needed to see results from economies of scale. On the other hand, in a for-profit model where there is very little subsidy of students, increased enrollment can lead to an increase in revenue and profit making pursuit of economies of scale an attractive strategy.
Reasons for the Growth of For-Profit Business Education
Several factors have contributed to the growth of for-profit provision of postsecondary business education. These factors are divided between those related specifically to the growth of for-profit business education and factors related to the general growth of for-profit enrollments.
Business student enrollment at for-profit institutions have been influenced by the comparatively low expenses of of-fering business programs, legal restrictions on the programs offered, and the relatively high incomes of business program alumni.
Because business programs generally have lower expenses than some other programs, maximizing business enrollments at for-profit institutions is to be expected. The lower expenses coupled with large enrollments make business programs an especially attractive target of for-profit institutions.
The pursuit of increased enrollments of business students at for-profits is related to a combination of legislation and the higher reported incomes of business graduates. For-profit institutions are limited by the Higher Education Act of 1965 as amended to offering programs that prepare students for gainful employment in a recognized occupation. In addition, a new gainful employment rule announced in June 2011 (Field, 2011) is to compare the income of people who have been enrolled in each program of a for-profit institution to the student loan debt held by those former students. If the results show a high student loan debt-to-income ratio, that program may lose eligibility to participate in Title IV stu-dent aid programs. Because business majors have relatively high incomes after graduation (Carnevale, Strohl, & Melton, 2011), enrollments of additional business students is not likely to cause an institution to violate this new gainful em-ployment rule. It can, therefore, be predicted that for-profit institutions will continue to pursue enrollments of business students.
Factors related to the general growth of for-profit postsec-ondary enrollments include aggressive recruitment strategies
employed by some for-profit institutions, federal student aid policies, access to capital, and the customer service focus of for-profit institutions.
Concerns about aggressive recruitment strategies em-ployed by some for-profit institutions triggered a federal investigation in 2009. Widespread media coverage of the investigation and the subsequent modifications to the gov-ernment’s report documented these practices.
In addition to these practices, financial factors have con-tributed to growth. Most federal student aid such as Pell Grants and military tuition benefits are portable and follow the student to their institution. Periods of growth of for-profit postsecondary education have been linked to increased ac-cess to federal student aid (Bailey, Badway, & Gumport, 2001; Kinser, 2006a, 2006b; Turner, 2006). Increases in Pell Grants, the temporary allowance of two Pell Grants per year, and enhanced tuition benefits for military personnel have all increased the availability of federal student aid during the years of this study.
Capital is required to fuel expansion plans and increase en-rollments. Access to capital is related to the revenue sources of each sector. Reductions in state and private donations and a tightening of credit policies have limited the ability of public and not-for-profit institutions to engage in expansion plans. For-profit institutions are mainly tuition-driven and have ac-cess to capital markets as funding sources for expansion strategies. The relative advantage of public institutions de-creases as direct government subsidies to institutions decline (Turner, 2006).
In addition to financial reasons, for-profit institutions are more likely to adopt a customer service approach to attract students and increase enrollments (Morey, 2004). This may include course schedules designed to fit around work sched-ules, assistance with financial aid filings, locations conve-nient to work and major highways, urban campuses, and a reduction in general education courses required for a degree (Kinser, 2006a; Morey).
This approach has been observed in other industries with mixed-form economies including hospitals and prisons (Hart, Shleifer, & Vishny, 1997; Picone, Chou, & Sloan, 2002). To maximize profits, for-profit providers may increase perceived quality by investing in amenities that are readily observable such as modern facilities, food services, and equipment while cutting less observable inputs affecting the quality of the services provided such as employee compensation levels, minimum hiring standards, and training. Hart et al. named the difficult-to-observe quality markersnoncontractible quality
because it is difficult for the government to provide a contract with enough detail related to every facet of the operations of an institution. Those factors that are not detailed in the contract are noncontractible and left to the discretion of the provider. Other examples in education include scheduling, curriculum requirements, and locations.
As for-profit providers reduce noncontractible quality and increase markers of perceived quality meant to attract
314 B. K. FOX GARRITY
students, not-for-profit and public providers are pressured to compete to attract and retain students. This pressure to compete leads to one of the major implications of these findings.
Implications
There are several major implications of the findings of this study. One of the more serious is the impact that competing for students with for-profit institutions may have on not-for-profit and public institutions. The practices of customer service and reductions in noncontractible quality may be mimicked as institutions compete for business student en-rollments. Competition with for-profit institutions influences decisions at not-for-profit and public institutions (Allen & Seaman, 2010; Morey, 2004). A 2002 report to the Board of the Association to Advance Collegiate Schools of Busi-ness (AACSB) noted pressure on AACSB schools to offer programs in different formats to satisfy customer wants and needs. Emergence of new competitors was cited as the num-ber two factor driving change at AACSB schools of business (Olian, 2002).
Additional implications include a potential change in the perceived value of degrees from different sectors; a reduction of business faculty involvement in shared governance, pub-lic service and research activities; and difficulty supporting higher expense programs at not-for-profit and public institu-tions.
The perceived value of a degree from a particular institu-tion may be related to the instituinstitu-tion’s control. Most public and not-for-profit institutions hold regional accreditation. Some for-profit institutions are regionally accredited but many hold national accreditation. However, accreditation is not the only indicator of perceived value. Hiring de-cisions by employers, industry-institution partnerships, limitations in employer tuition assistance benefit programs, government funding appropriation decisions, and student enrollment decisions all provide partial answers to the question of the perceived value of a degree from a particular institution.
A pertinent change has been observed in the public per-ception of for-profit and not-for-profit hospitals. Reports of fraudulent practices at for-profit hospitals adversely affected public opinion in the mid-1980s; however, respondents re-ported that quality was not related to ownership status. How-ever, by 2002 a majority of people surveyed believed that for-profit hospitals provided higher quality care whereas not-for-profit hospitals had lower costs (Schlesinger, Mitchell, & Gray, 2004). Several instances of fraudulent or deceptive re-cruitment practices at for-profit educational institutions have been reported recently. The trends in the hospital industry suggest that those incidents soon may be forgotten by the public and the perception of quality may tilt in favor of for-profit institutions. This could alter the perceived value of degrees from various sectors of institutions.
The implications for business faculty and their role in shared governance, research, and public service are of note. Shared governance is practiced in some form on most not-for-profit and public campuses. However, for-not-for-profit institutions rarely engage in shared governance activities and often employ more adjunct faculty than other types of institutions (Morey, 2004). Similarly for-profit institutions generally do not provide for public service nor do they expect or support their faculty in research activities (Morey). As business student enrollments are disproportionately high at for-profit institutions, full-time faculty jobs, business faculty engage-ment in shared governance, and overall public service and research in this field may also be disproportionately reduced compared with other fields. In addition, the use of centrally designed curriculum is common at for-profits leaving teaching faculty with little control over the curriculum and reducing the need for subject matter expertise of those who teach.
Financially, public and not-for-profit campuses with busi-ness programs may have difficulty in funding higher expense programs when business students are cherry-picked by the for-profit institutions. This will lead to a need for increased revenue from other sources.
Alternatives and Strategies for Change
Business schools have options of how to respond to the trends in business student enrollments. Several defense strategies are suggested. Institutions may also choose to increase their institution’s business student enrollments. Alternatively, in-stitutions may choose to ignore the trends, although this would likely be an ill-fated long-term strategy.
To defend the role of their own institution, business school faculty and administrators should establish and communicate the value of a degree from their institution to maintain cred-ibility with employers, donors, potential students, state and federal policymakers, and alumni. Specialized accreditation can be used to establish value. This value should be explained and reinforced to all constituencies.
Coordinated lobbying efforts should be used to ensure that state and federal policymakers are familiar with the dif-ferences between sectors of institutions. This strategy has been used heavily by for-profit institutions in response to congressional actions including legislation changes and in-vestigations.
Policies and standards that limit expansion should be ex-amined to determine if they serve as legitimate protections for students and learning. If they do, that value must be com-municated to stakeholders. If they do not, efforts should be made to change them.
Market expansion should be monitored and opportuni-ties to expand explored. Business faculty and administra-tors should lobby for increased funding to expand business programs if appropriate. Knowledge of the relative expense levels of programs on campus may assist in these efforts.
The value of the research and public service provided by the full-time faculty and funded in part by the university must be clearly articulated. This is essential to continuing funding and distinguishing between institutions in different sectors.
The most important strategy is to monitor changes in mar-ket share. Do not ignore any one sector as all three now hold a sizeable number of business student enrollments. Careful monitoring of trends in enrollment will allow each institution and sector to plan a strategic response.
CONCLUSION
The general increases in business student enrollments at each sector of institution might have masked the dramatic changes in market share from 1996 to 2008. The changing landscape of business education in the United States is highlighted by the dramatic increase in market share held by for-profit insti-tutions and the identification of the key players in the market. It is imperative that all institutions engaged in educating busi-ness students understand and respond strategically to these changes.
REFERENCES
Ahumada, M. (1992). U.S. methods for costing in higher education: Taking the technology abroad.Higher Education,24, 363–377.
Allen, I., & Seaman, J. (2010).Class differences: Online education in the United States, 2010. Babson Park, MA: Babson Survey Research Group. Bailey, T., Badway, N., & Gumport, P. (2001).For-profit higher education and community colleges. Stanford, CA: National Center for Postsecondary Improvement.
Carnevale, A., Strohl, J., & Melton, M. (2011).What’s it worth? The eco-nomic value of college majors. Washington, DC: Georgetown University Center on Education and the Workforce.
Field, K. (2011, June 2). For-profit colleges win major concessions in final ‘gainful employment’ rule. Chronicle of Higher Educa-tion. Retrieved from http://chronicle.com/article/For-Profit-Colleges-Win-Major/127744/
Hart, O., Shleifer, A., & Vishny, R. (1997). The Proper scope of government: Theory and an application to prisons.Quarterly Journal of Economics, 112, 1127–1162.
Higher Education Opportunity Act, 20 U.S.C.§1002 (2008).
Kelly, K. (2001).Meeting needs and making profits: The rise of for-profit degree granting institutions. Denver, CO: Educational Commission of the States.
Kinser, K. (2006a). From Main Street to Wall Street.ASHE Higher Educa-tion Report,31(5), 1–146.
Kinser, K. (2006b). What Phoenix doesn’t teach us about for-profit higher education.Change,38(4), 24–29.
Knapp, L., Kelly-Reid, J., & Ginder, S. (2010).Enrollment in postsecondary institutions, fall 2008; graduation rates, 2002 & 2005 cohorts; and finan-cial statistics, fiscal year 2008. Washington, DC: National Center for Education Statistics.
Lee, Y., & Nguyen, H. (2007). Get your degree from an educational ATM: An empirical study in online education.International Journal on E-Learning, 6(1), 31–40.
Marwell, N., & McInerney, P. (2005). The nonprofit/for-profit continum: Theorizing the dynamics of mixed-form markets.Nonprofit and Voluntary Sector Quarterly,34(1), 7–28.
McChlery, S., & Rolfe, T. (2004). University costing systems: A case study on value management.Journal of Finance and Management in Public Services,4(1), 67–87.
Middaugh, M. (1996, October).Instructional costs and productivity, by academic discipline: A national study revisited. Paper presented at the Annual Forum of the Association for Institutional Research, Albuquerque, NM.
Morey, A. (2004). Globalization and the emergence of for-profit higher education.Higher Education,48, 131–150.
National Center for Education Statistics. (2010).Table 242. Enrollment in postsecondary education, by student level, type of institution, age, and major field of study: 2007–2008. Retrieved from http://nces.ed.gov/ programs/digest/d10/tables/dt10 242.asp
Olian, J. (2002).Management education at risk: Report of the management education task Force to the AACSB International Board of Directors. Tampa, FL: AACSB.
Parsad, B., Lewis, L., & Tice, P. (2008).Distance education at degree-granting postsecondary institutions: 2006–2007. Washington, DC: Na-tional Center for Education Statistics.
Picone, G., Chou, S., & Sloan, F. (2002). Are for-profit hospital conversions harmful to patients and to Medicare?Journal of Economics,33, 507–523. Schlesinger, M., Mitchell, S., & Gray, B. (2004). Public expectations of nonprofit and for-profit ownership in American medicine: Clarifications and implications.Health Affairs,23, 181–191.
Snyder, T., & Dillow, S. (2011). Digest of education statistics 2010. Table 203: Total fall enrollment in degree-granting institutions, by level of enrollment, sex, attendance status, and type and control of institution: 2008. Retrieved from http://nces.ed.gov/programs/digest/ d10/tables/dt10 203.asp?referrer=list
Snyder, T., & Hoffman, C. (2001).Digest of education statistics 2000. Washington, DC: National Center for Education Statistics.
Turner, S. (2006). For-profit colleges in the context of the market for higher education. In D. Breneman, B. Pusser, & S. Turner (Eds.),Earnings from learning: The rise of for-profit universities(pp. 51–68). Albany, NY: State University of New York.
Winston, G. (1999a). For-profit higher education: Godzilla or Chicken Lit-tle?Change,31(1), 12–20.
Winston, G. (1999b). Subsidies, hierarchy, and peers: The awkward eco-nomics of higher education.Journal of Economic Perspectives,13(1), 13–36.