Global Employment Outlook: Bleak Labour Market Prospects for Youth 1 Young unemployed people around
the world may not see their situation improve soon. As the euro area crisis continues in its second year, the impacts are spreading further, slowing down economies from East Asia to Latin America. Other regions such as Sub-Saharan Africa that had expected faster improvements in their youth labour markets will now take longer to revert to levels seen prior to the global financial crisis. In developed economies, youth unemployment rates are expected to fall over the
coming years, after having suffered from the largest increase among all regions at the beginning of the crisis, but principally because discouraged young people are withdrawing from the labour market and not because of stronger hiring activity among youngsters. Despite this decline and even though the young unemployed in advanced economies represent 13% of the world total, the global youth unemployment rate is expected to continue to edge higher beyond 2014 (chart 1 provides the ILO’s
Global spill-overs from advanced to emerging economies
worsen the situation for young jobseekers
September 2012 I L O
Global Employment Outlook
estimates and projections of global and regional unemployment rates from 2007 to 2017).
In certain regions, the regional youth unemployment rate disguises large variation across countries. In particular in the Developed E c o n o m i e s r e g i o n , y o u t h unemployment rates range from over 50% in Spain and Greece to less than 10% in Germany and Switzerland. Even when the youth unemployment ratio is considered – the number of young unemployed in
Note: Youth u e ploy e t rates for you g jo seekers et ee a d years i per e t of a i e youth populaio . Esi ate e for ; Proje -io s p for through 7.
Sour e: ILO, Tre ds E o o etri Models, July ; IMF World E o o i Outlook, July .
Chart 1: Global and regional youth unemployment rates (15-24 years)
WORLD
12.5 12.7
12.7 12.8 12.9
Developed economies and European Union 17.2
17.5 17.3
15.6 Centerl &
South-Eastern Europe 17.6
16.9 17.0 17.0
East Asia
9.2 9.5
9.7 10.4
South-East Asia & the Pacific
12.8 13.1
13.5 14.2
South Asia 9.7 9.6
9.7
9.8 Latin America &
the Caribbean
14.7 14.6 14.6
14.7
Middle East 25.7 26.4
27.0
28.4
North Africa
27.1 27.5
27.6
26.7
Sub-Saharan Africa 11.9 12.0 11.9 11.8
5.0 10.0 15.0 20.0 25.0 30.0
2007 2008 2009 2010 2011 2012 2013 2014 2015 2016 2017
Yo
u
th
u
n
emp
lo
y
men
t
ra
te
(%
)
Global Employment Outlook: Bleak Labour Market Prospects for Youth 2 work among youth has grown faster t h a n a m o n g a d u l t s , a n d increasingly appears to be driven by a lack of alternative employment opportunities for young people (see
h t t p : / / w w w . i l o . o r g / g l o b a l / hand, the bleak situation for young jobseekers has triggered only limited cross-border movements of young people but a lengthy and stretched-out recovery is likely to intensify the quest of young, more mobile people to seek their fortunes abroad.
The difficulties of young people to find gainful employment reflects the overall weak state of labour markets around the world (see table 1). Global output has grown weakly over the past six months and is not expected to accelerate in the near future. As noted in the WTO’s World Trade Report 2012, global trade has also decelerated sharply as g lobal demand especially in advanced economies has faltered. This has created global spillovers, leading to a slow-down of activity in emerging economies in East and South Asia and Latin America. High private and public debt in the advanced economies is leading to private households and firms deleveraging to relieve their high debt burden through increased savings rates, and austerity measures for public sectors. The combined downward pressure on both private and public consumption and investment is dragging down aggregate demand and growth. Therefore, at the current juncture there is a s u bs ta n t i a l r is k th a t th i s simultaneity may trigger yet another significant downward spiral
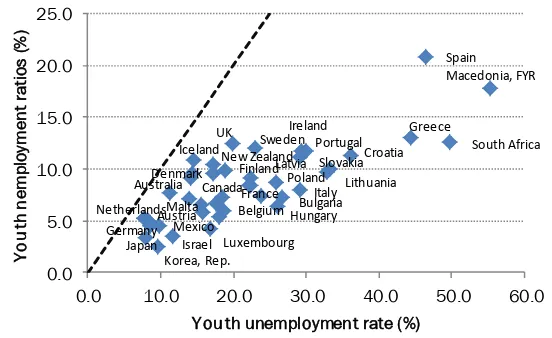
Box 1: Youth unemployment rates vs. ratios in international comparison
Cross-country comparisons of the extent of youth unemployment are complicated by the fact that large differences exist across countries regarding the labour market participa-tion of people below the age of 25. Partly, this is related to differences in the educaparticipa-tion system as countries with a well-developed vocational training system consider young people to be employed while they are following their (part-time) vocational education. In contrast, in countries with full-time education systems only those who have completed a first secondary degree or have dropped out of school and are seeking work are typically considered to be part of the labour force. Such effects of institutional differences across countries on measured youth unemployment can be addressed by considering the youth unemployment ratio rather than the rate. As chart 2 shows, this results in lower values for the youth unemployment ratio because of a larger denominator (the youth population rather than the youth labour force) compared to the youth unemployment rate. Youth unemployment ratios, therefore, have a tendency to underestimate the extent to which joblessness prevails among young people, in particular when youth labour force participation is low and youth unemployment rates are high as illustrated by the fact that countries lie further away from the dotted, 45 degrees line in chart 2, the higher their youth unemployment rate and the lower their youth labour force partici-pation rate is.
Chart 2: Unemployment rates vs. unemployment ratios in selected countries (2011)
Note: The chart shows the relationship between the youth unemployment rates and youth unemployment ratios for selected countries in 2011. The dotted line represents the 45 de-grees line.
Source: ILO, Key Indicators of the Labour Market.
In addition, cross-country comparisons of youth joblessness are further complicat-ed by the fact that youth unemployment rates tend to understate the problem of young people on the labour market in many developing and emerging economies. In these countries, labour force participation rates are typically higher among young people than in developed economies. As alternative income opportunities or well-developed social protection systems rarely exist in these countries, young people are eager to take up any form of employment, be it in the informal econo-my or below their education level. This tends to suggest a youth employment situation that is better than what is actually experienced by those in the labour market who have to face low, unstable incomes and weak prospects.
Netherlands
You th unemployment rate (%)
that could bring the world economy closer to another global recession by the end of 2012, further threatening a sustained labour market recovery.
Additional downward pressure on the global economy is coming from
Global Employment Outlook: Bleak Labour Market Prospects for Youth 3 Table 1: Global and regional total unemployment rates (age 15 and above)
unsustainable levels of non-performing loans, forcing some governments to bail out their distressed banks. This transferred private debt into public. The ensuing increase in interest payments and a general distrust in the capacity of the public sector to successfully manage this enhanced debt burden has compelled these governments into several rounds of austerity to reduce their borrowing costs. As a result, and despite highly accommodative monetary policy, the combination of sky-rocketing risk premia for long-term loans and depressed aggregate demand due to fiscal austerity measures have prevented both the private and the public sector in these countries from recovering and creating new jobs.
Moreover, structural imbalances that were built up prior to the crisis have worsened, further slowing the recovery. Indeed, even in countries with first signs of a jobs recovery and where firms started to open new vacancies, many unemployed have had difficulties in landing a job. This is partly linked to the shift in sectoral demand that countries with a bust housing sector face: As employment in sectors such as construction declines new sectors with different skill requirements may not be able to absorb the unemployed from these shrinking sectors. In some countries with high youth unemployment rates, this is a particularly harsh problem leading to discouragement and rising NEET rates (“neither in e m p l o y m e n t , e d u c a t i o n o r training”) among young people. Note: Total unemployment rates in per cent of labour force. Estimate (e) for 2011; Projections (p) for 2012 through 2017.
Source: ILO, Trends Econometric Models, July 2012; IMF World Economic Outlook, July 2012.
Region 2011e 2012p 2013p 2014p 2015p 2016p 2017p
WORLD 6.0 6.0 6.1 6.0 6.0 6.0 6.0
Developed Economies & European Union 8.5 8.6 8.6 8.5 8.2 8.0 7.8
Central & South-Eastern Europe (non-EU) & CIS 8.7 8.4 8.4 8.3 8.2 8.2 8.2
East Asia 4.3 4.4 4.5 4.6 4.6 4.7 4.7
South-East Asia & the Pacific 4.4 4.5 4.6 4.6 4.6 4.6 4.6
South Asia 3.8 3.8 3.8 3.8 3.8 3.8 3.8
Latin America & the Caribbean 7.2 7.2 7.2 7.2 7.2 7.2 7.2
Middle East 9.9 10.1 10.2 10.2 10.3 10.4 10.4
North Africa 10.6 10.8 10.9 10.8 10.7 10.6 10.5
Sub-Saharan Africa 7.8 7.8 7.8 7.8 7.7 7.7 7.7
Total youth
unem-ployed (in '000) antee Scheme Cost of Youth Guar-(in % of GDP)
2011q4 2012q1
Euro area (17 countries) 3291 3331 0.2%
Austria 51 0.1%
Belgium 78 79 0.2%
Cyprus 9 10 0.3%
Estonia 17 16 0.5%
Finland 64 64 0.2%
France 652 615 0.2%
Germany 388 371 0.2%
Greece 158 161 0.4%
Ireland 62 60 0.3%
Italy 537 0.3%
Luxembourg 2 2 0.1%
Malta 4 4 0.2%
Netherlands 119 130 0.2%
Portugal 150 151 0.2%
Slovakia 77 85 0.2%
Slovenia 15 14 0.1%
Spain 908 920 0.3%
Czech Republic 67 70 0.1%
Denmark 65 68 0.1%
Norway 32 30 0.1%
Sweden 147 146 0.4%
United Kingdom 1005 0.3%
United States 3547 3452 0.2%
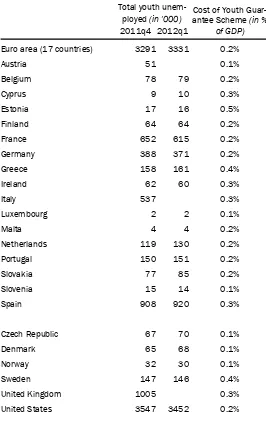
Table 2: Youth employment guarantee schemes – Estimated annual budgetary costs
Note: The table shows annual fiscal costs of a youth employment guarantee scheme, allowing cur-rently young jobseekers to enter paid employment either through public works schemes or through subsidised private employment at 75% of the on-going minimum wage. The cost estimate includes a 20% administration cost and assumes that only 50% of all young jobseekers would be ready to enter such a scheme.
Global Employment Outlook: Bleak Labour Market Prospects for Youth 4
TRENDS Unit
Employment and Labour Market Analysis
Employment Sector
ILO
Looking ahead, a pre-condition fori m p r o v e m e n t i n y o u t h unemployment is a return to a sustained growth path and a general strengthening of the labour market. Without additional jobs being created, young people cannot expect to find employment. However, given the sheer size of the problem, even a quick acceleration in growth may not provide sufficient job opportunities in a short period of time. To address this, the ILO is calling for targeted measures to improve the labour market situation, especially for youth (see http://www.ilo.org/ wcmsp5/groups/public/---ed_emp/ d o c u m e n t s / p u b l i c a t i o n /
wcms_151459.pdf). For example,
providing employment or training guarantees for (targeted groups of) young people – such as those that
currently exist in several countries – could help get young job-seekers off the street and into useful activities and act as a safeguard against further economic and social stress. Estimates show that such programmes can come at very limited costs, less than half a per cent of GDP among European countries (see table 2), depending on administrative costs and actual take-up.
This is consistent with costs observed in existing youth e m p l o y m e n t g u a r a n t e e programmes, such as those enacted in Austria, Denmark, Finland, Norway and Sweden. In S w eden , a jo b g u a r a n tee programme for youth enacted in the 1980s and reformed in 2007 combined active labour market