REPÚBLICA DEMOCRÁTICA DE TIMOR-LESTE
MINISTÉRIO DAS FINANÇAS
GABINETE DA MINISTRA
Timor-Leste Petroleum Fund
ANNUAL REPORT
Ministry of finance
2014
Content
Message from the Minister of Finance
The Petroleum Fund at Glance
About the Petroleum Fund
Legal Framework
Purpose
Key Features
Governance
Size of the Fund
Petroleum Fund Balance
Petroleum Revenues
Withdrawals
The Fund’s Investmen
t
Performance in 2014
Management Fees
Going Forward
Advice from the Investment Advisory Board
Annexes
Annex I
Statement by Director General of Treasury
Annex II
Audited Financial Statements
Annex III
Statement on Accounting Policies of the Petroleum Fund for the Fiscal
Year 2014
Annex IV
Comparison of Income Derived from the Investment of the Petroleum
Fund Assets with the Previous Three Fiscal Years
Annex V
Comparison of Nominal Income on the Investment of the Petroleum
Fund Assets to the Real Returns
Annex VI
Comparison of Nominal Income on the Investment of the Petroleum
Fund Assets with the Benchmark Performance Index
Annex VII
Comparison of the Estimated Sustainable Income with the Sum of
Transfers from the Petroleum Fund
Annex VIII
Statement on Borrowings
Annex IX
A List of Persons Holding Positions Relevant for the Operations and
Performance of the Petroleum Fund
Annex X
Statement on Total Withdrawals versus the Approved Appropriation
Amount
Annex XI
Article 35 Report on the Petroleum Fund Receipts from Deloitte
Touche Tohmatsu
Message from
Santina J.R.F. Viegas Cardoso
Minister of Finance
The Petroleum Fund was created in 2005 to contribute to the wise management of
Timor-Leste’s petroleum resources. The objective is
to manage the financial investments so that
there is a reasonable probability that the Fund can provide transfers to the Government at a
sustainable level while maintaining the real long term value of the assets. Government
withdrawals of 3 per cent of Petroleum Wealth imply a corresponding long-run investment
return objective of 3 per cent after inflation and costs.
One of the Ministry of Finance’s primary tasks has been to develop an investment strategy
that best meets the Fund’s long
-term return and risk objectives. A key milestone was
achieved in June 2014 when the equity allocation reached 40 per cent of the Fund. Financial
modeling showed that equities needed to increase considerably for the Fund to have a
satisfactory likelihood of meeting its 3 per cent real return objective.
A long-run perspective is a key tenet of our investment strategy. The risk of short-term losses
has risen with the equity allocation
–
the risk of loss is now one in every five years. Our
long-term horizon means that such losses can be treated as temporary setbacks. These short long-term
fluctuations are unavoidable if we are to achieve the Fund’s long
-run objectives.
The Petroleum Fund returned 3.3 percent in 2014 or 2.5 per cent after inflation. Both bonds
and equities posted positive returns. Non-USD holdings detracted from the value of the bond
and equity portfolios when translated into US Dollars. Foreign exchange movements are
volatile but over the long-run some currency diversification will help protect the Petroleum
Fund’
s international purchasing power. Rather than give too much weight to the returns for
any single year, currency returns and the Fund’s overall performance are best evaluated over
a long horizon.
I am very pleased with the progress made with the Petroleum Fund. Good planning and hard
work have allowed us to achieve a lot over a relatively short period. Rest assured that the
Ministry of Finance - with guidance from the Investment Advisory Board and our external
advisors, along with support from the Banco Central Timor-Leste, the Petroleum
Fund’s
operational manager
–
is committed to continuing to improve the Fund’s investments and
management.
The Petroleum Fund at a Glance
Petroleum Fund Allocation as at 31 December 2014
End of Year
Balance
$16.5
bn
Petroleum
Revenues 2014
$1.8
bn
Net Investment
Return 2014
3.3
% ($502
m
)
Return Since
Inception
About the Petroleum Fund
The Petroleum Fund of Timor-Leste
(henceforth “the Fund”)
is the cornerstone of
the Government´s economic policy.
Legal Framework
The Petroleum Fund was established to fulfil the constitutional requirement set by
Article 139 of the Constitution of the Republic that mandates a fair and equitable use
of the natural resources in accordance with national interests, and that the income
derived from the exploitation of these resources should lead to the establishment of a
mandatory financial reserve. The Government therefore created the Petroleum Fund
in 2005, under the provision of the Petroleum Fund Law No.9/2005 (3 August 2005)
as amended by the Law No.12/2011 (28 September 2011).
Purpose
The preamble of the Petroleum Fund Law clearly states that the purpose of
establishing the Petroleum Fund is to contribute to the wise management of
Timor-Leste’s petroleum resources for the benefit of both current and future generations.
The Fund is also a tool that contributes to sound fiscal policy, where appropriate
consideration and weight is given to the long-term interest of Timor-Leste’s citizens.
Key Features
The Petroleum Fund Law provides mechanisms that assist Timor-Leste to
sustainably manage its petroleum revenues, details parameters for operating and
managing the Petroleum Fund, defines asset allocation guidelines and risk limits,
governs collection and management of the receipts, regulates transfers to the State
Budget, defines clear roles and responsibilities of entities involved in the
management of the Fund and provides for government accountability and oversight
of these activities.
The Petroleum Fund is formed as an account of the Ministry of Finance held in the
Central Bank of Timor-Leste (BCTL
1). The Fund separates the inflow of petroleum
revenues from government spending. All petroleum income initially enters the Fund
before any transfers are made to the State Budget. The amount of the transfers is
guided by the Estimated Sustainable Income (ESI), set at 3% of total petroleum
wealth
2. The rationale behind using the ESI is to smooth the spending of temporarily
high petroleum income and shield against the volatility of petroleum inflows and
safeguard the sustainable use of public finances.
The Fund is invested only in international financial assets. The implied investment
objective is to achieve a 3% real return to contribute to the sustainability of the fiscal
policy. The Government recognizes that pursuing this investment return objective
involves accepting risk in terms of short-term investment return volatility. Having a
long-term horizon however, means that such short term fluctuations should be of
less economic importance.
Governance
The Petroleum Fund model is internationally recognised for its high standard of
governance, accountability, transparency and disclosure of information. This helps
build public support for the wise management of petroleum revenues and reduces
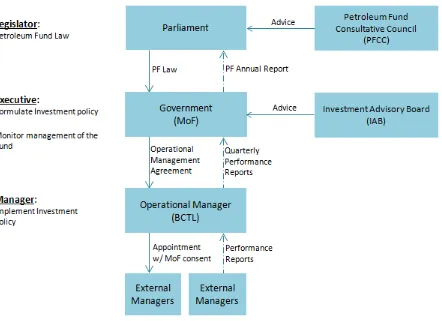
the risk of mismanagement. As shown in Figure 1 below, the relevant entities
involved in the management of the Petroleum Fund are independent, but
accountable to one another in the decision making process.
The Parliament sets the objective of the Fund, the broad asset allocation guidelines
and the risk limits. The Government, through the Ministry of Finance, is responsible
for the overall management of the Petroleum Fund including setting the investment
policy and strategy, investment guidelines and exercising of oversight.
The Ministry of Finance is required to seek advice from the Investment Advisory
Board (IAB) before making decisions on any matter relating to the investment
strategy or management of the Fund. The operational management of the Fund is
delegated to and carried out by the BCTL, which invests, and may delegate to
external managers to invest,
the Fund’s capital according to guidelines established
by the Ministry of Finance.
The Petroleum Fund Law also sets out the requirements for all entities involved in
the management of the Fund to provide and publish reports on the activities of the
Fund. The Ministry of Finance prepares the Petroleum Fund Annual Report,
Petroleum Fund financial statements and general state budget statement for the
National Parliament. The BCTL, on a quarterly basis, provides reports to the
Minister on the Fund’s performance over the quarter. In addition, an international
accredited external auditor is required to issue and publish an annual audit report
on the Fund’s financial statements. These reports are publicly available and easily
accessible on both Ministry of Finance (www.mof.gov.tl) and Central Bank
(www.bancocentral.tl) websites.
The Petroleum Fund, as an active member of the International Forum for Sovereign
Wealth Funds (IFSWF), conducted its fifth annual self-assessment of the Petroleum
Fund’s adherence with the Santiago Principles to ensure that the Fund continues to
be an example of international best practice with regard to funds governance. The
self-assessment report is published and attached as Annex XIII on this report. All
these efforts have been reflected in international recognition of the high level of
transparency of the Fund and the Government‘s good management of the resources
3.
Size of the Fund
The Petroleum Fund was established to fulfil the constitutional requirement set by
Article 139 of the Constitution
Petroleum Fund Balance
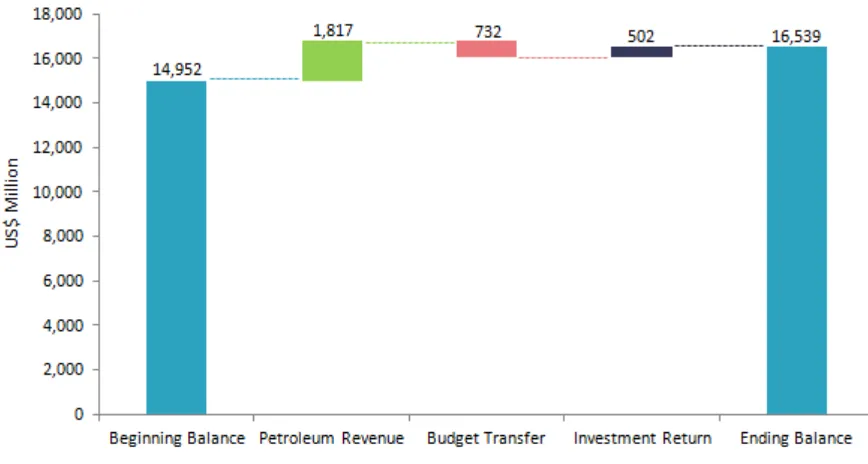
The Fund’s balance increased to US$ 16.5 billion as at the end of December 2014
from the previous year’s balance of US$ 15.0 billion (see Figure 2).
As Figure 3 illustrates, petroleum revenues and net investment return added
US$ 1,817 million and US$ 502 million to the Fund, respectively, while withdrawals
subtracted US $732 million.
Petroleum Revenues
Petroleum revenues come from the two existing fields; Bayu Undan and Kitan,
which started production in 2004 and 2011 respectively. Oil price, production
volume and production costs are the three main factors that affect the Government’s
inflow of petroleum revenues.
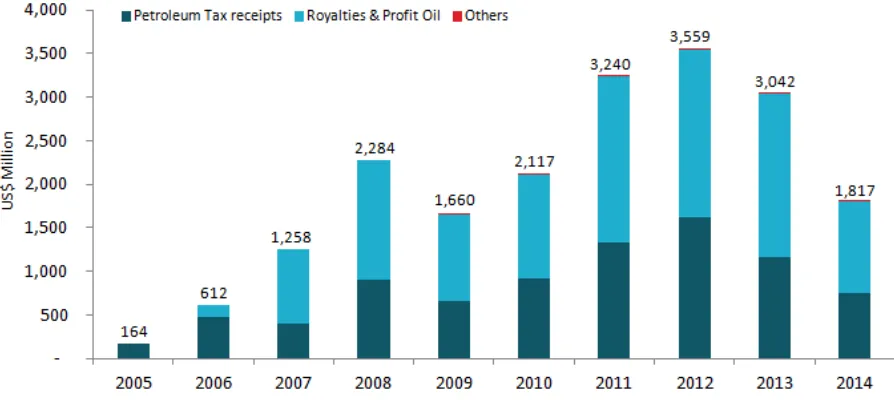
Of the total amount of US$ 1,817 million collected during 2014, US$ 752 million was
petroleum taxes, US$ 1,058 million was royalties and profit oil/gas, and US$ 7
million was other petroleum revenues (see Figure 4). These collections were in
accordance with Articles 6.1 (a), (b), and (e) of the Petroleum Fund Law,
respectively.
Petroleum revenue in 2014 was lower than the US$ 3,042 million in 2013. The fall in
petroleum revenues for 2014 was due to the decline in oil/gas production in both
Bayu Undan and Kitan. The shutdown in production that took place from late
August to early October 2014 and the drop of oil prices starting in mid 2014 further
contributed to the fall in petroleum revenues for the year.
Thus far since 2005 the Government has collected total petroleum revenues of
US$ 19.7 billion. Based on conservative estimates, total undiscounted petroleum
revenues of US$ 4.7 billion are expected to be collected during the remaining life of
the Bayu-Undan and Kitan. Petroleum revenues from these two fields are forecasted
to decline slowly and will end in a decade or so. Going forward, investment income
will be the main driver of the Petroleum Fund balance.
Withdrawals
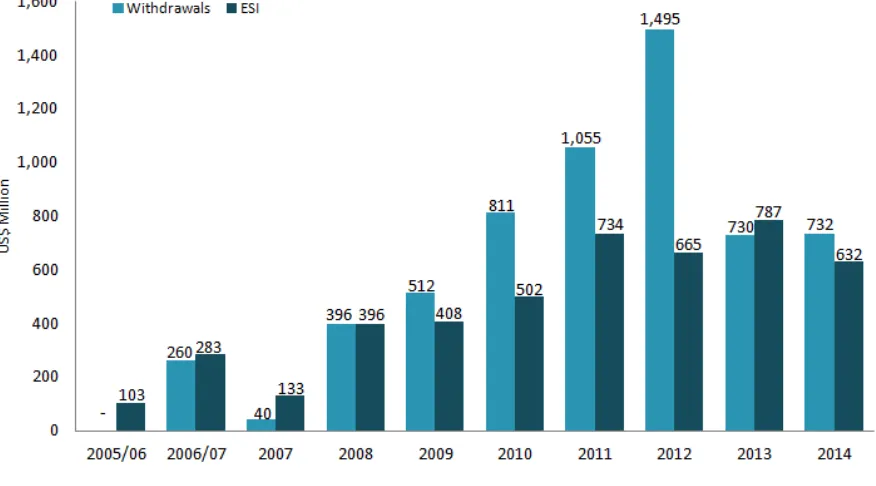
The Government withdrew US$ 732 million from the Fund to the Treasury Account
(CFET) during 2014. The amount withdrawn in 2014 was US$ 100 million more than
the ESI of US$ 632 million for the year (see Figure 5). The ESI is set at 3% of the
Petroleum Wealth which consists of the Petroleum Fund balance and the forecasted
net present value of the future petroleum revenues. Over time, as more petroleum
resources are converted into revenues, Petroleum Wealth will become equal to the
Fund balance and the ESI will be calculated as 3% of the Fund’s balance.
Of the total petroleum revenues collected, the Government has withdrawn US$ 6,031
million from the Fund since its inception in 2005 up to the end of 2014.
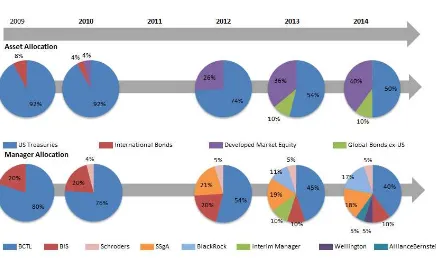
The Fund’s Investments
The Petroleum Fund’s investment strategy has evolved over time. The Fund was
initially invested completely in bonds (see Figure 6). This was designed to limit the
exposure to risk and volatility and allow time to build internal capacity and build
public support. Equities
– which have higher returns than bonds but are more
volatile
– were first introduced in 2010 although the allocation was constrained by
the original Petroleum Fund Law.
The Government knew that the Fund’s real return target of 3% could not be achieved
without a significant increase in the allocation to equities. The Petroleum Fund Law
was consequently amended in 2011 to allow up to a 50% equity allocation. Modeling
objective with a reasonable probability over the long run. This would safeguard the
sustainability of public spending, which over time is guided by the ESI, set at 3% of
the Petroleum Wealth. That allocation was agreed to by the Government in 2012 and
the equity weight has progressively increased to reach 40% in June 2014. Since then,
equities have been maintained at 40% with bonds at 60%. The Fund’s asset allocation
in December 2014 is shown in Figure 6 relative to other years.
Reaching 40% in equities represents an important milestone for the Petroleum Fund.
Our asset allocation is now at the point where we can expect to meet the real return
objective over long periods. The increase in equity holdings necessarily brings an
increase in volatility in returns. In some years the Fund’s actual return will exceed
the long-run objective, while in other years it will be below.
We have been fortunate in not experiencing negative returns as yet. There will be
years where the Petroleum Fund posts losses. This is an unavoidable aspect of the
short-term volatility in returns that is associated with the asset allocation that allows
us to meet our long-term return expectations. The outcome of modeling of the 40%
equity allocation helps put this risk in context.
How frequently will there be losses?
The Fund is expected to experience a loss in
one out of every five years.
What size of loss can we expect?
In the worst 5 years out of every 100, the loss
will be 5.2 per cent or higher. Based on a fund balance of $16.5 billion, this
represents a loss of US$853 million.
The authorities appreciate the importance of communicating to stakeholders these
risks commensurate with the return objective. This was a priority during the
socialization process that preceded the increase in the equity allocation. Our
willingness to accept short term volatility and stay the course with our investment
strategy is essential to the Fund’s long-term investment success.
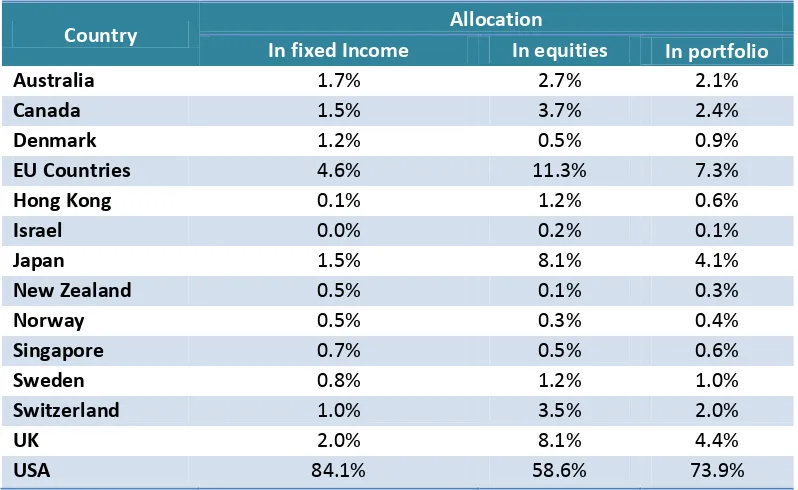
Diversification is a key principle underlying our investment strategy and helps
reduce volatility and remove unrewarded risks. The Fund diversifies across asset
classes by holding both equity and bonds. We also diversify across securities,
regions and currencies.
Country
Allocation
In fixed Income
In equities
In portfolio
Australia
1.7%
2.7%
2.1%
Canada
1.5%
3.7%
2.4%
Denmark
1.2%
0.5%
0.9%
EU Countries
4.6%
11.3%
7.3%
Hong Kong
0.1%
1.2%
0.6%
Israel
0.0%
0.2%
0.1%
Japan
1.5%
8.1%
4.1%
New Zealand
0.5%
0.1%
0.3%
Norway
0.5%
0.3%
0.4%
Singapore
0.7%
0.5%
0.6%
Sweden
0.8%
1.2%
1.0%
Switzerland
1.0%
3.5%
2.0%
UK
2.0%
8.1%
4.4%
USA
84.1%
58.6%
73.9%
The equity portfolio was diversified across 1,983 companies as at the end of the year.
The broad exposure of equities across countries and currencies shown in Figure 7
reflects the different size of each country’s equity market by market capitalization.
The US is by far the largest equity market, so the holdings of US companies account
for more than 50% of our equity portfolio. Bonds have represented 60% of the
Petroleum Fund’s investments since June 2014. The bond portfolio consists of:
One sixth of the US Government bonds with maturities of 5 to 10 years, which
is managed by the Bank for International Settlements (BIS).
One sixth of the non-US, developed market Government bonds. This was
originally passively managed by Russell Investments and is now split equally
between AllianceBernstein (commenced in July 2014) and Wellington
(commenced in December 2014).
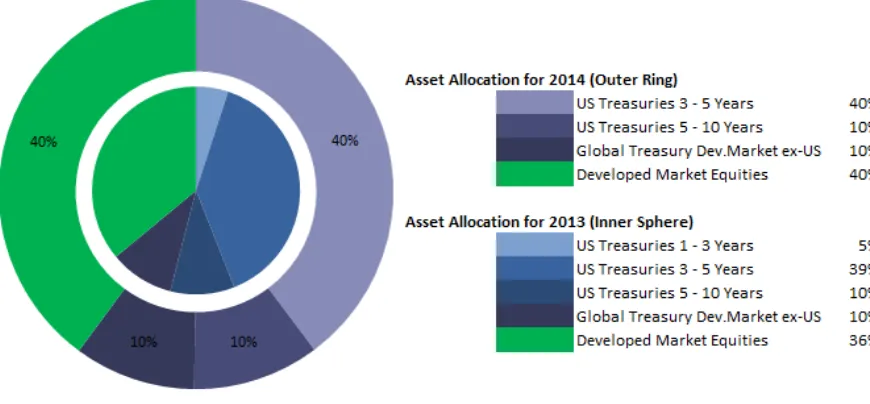
As shown in Figure 8 US Government bonds represent the bulk of our bond
portfolio. The concentration in US Treasuries was reduced in the second half of 2013
with the introduction of non-US developed market sovereign bonds. The benchmark
portfolio is designed to provide a broad exposure to non-US developed market
sovereigns by capping country weights at 10 per cent and the Eurozone at 30 per
cent. As discussed in Box 1, the currency exposure for this allocation is left
unhedged. In total, 546 securities were held in the bond portfolio as at the end of
2014.
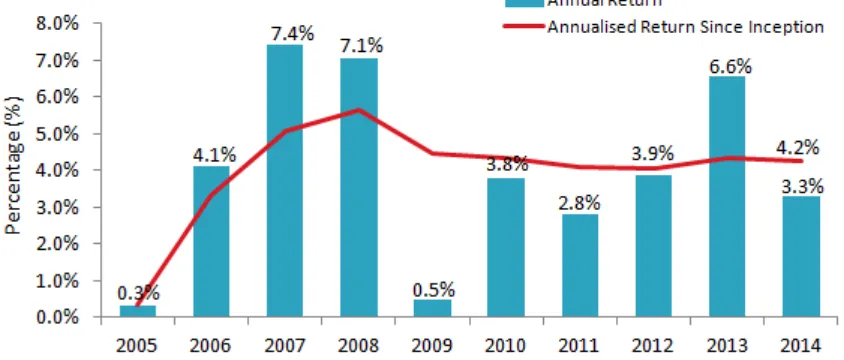
Performance in 2014
Investment income contributed US$ 502 million to the Fund’s balance in 2014, which
was lower than the US$ 865 million of income in the previous year. The Petroleum
Fund returned 3.3% in 2014 (see Figure 9). In real terms – that is, once USD inflation
is adjusted for - the Petroleum Fund returned 2.5%. The Fund’s return since its
inception in 2005 is 4.2% or 2.3% in real terms. Our real return objective over the
long-term is 3%. Having reached the 40% equity allocation in 2014, we can now
expect to meet this with a reasonable probability over the long term.
Developed market equities, measured by the MSCI World Index, returned 4.9% in
2014. The first half of the year recorded solid returns. Uncertainty weighed on
equities in the second half, given economic weakness outside of the US and concerns
about the impact of a sharp drop in oil prices. The 4.9% return is less than our
long-run expectations of about 8%
and follows 2013’s particularly high return of 27%.
The variation in the annual returns from equities that we may expect is illustrated in
Figure 10, which uses historical data. The Fund will experience very strong years like
2013 but there will also be periods where equities record losses. Again, the volatility
in annual returns is unavoidable in order to meet our investment objectives over the
long-term.
Figure 11 shows that our actual equity portfolio returned 5.2% or almost 0.3% above
the MSCI World benchmark index. The bulk of the equity portfolio is passively
managed to the MSCI World Index. Passive management involves holding the
Figure 9 - Annual Net Nominal Investment Return since Inception
managers are expected to closely match the index’s return before fees. In this case,
the higher return represents a difference in tax treatment between the benchmark
and our actual portfolio. The index assumes that dividend income is fully taxed by
each country, while in fact the Petroleum Fund benefits from tax exemptions in
certain countries.
% (USD)
Q1
Q2
Q3
Q4
2014
Total Fund
1.15
2.66
-1.35
0.83
3.30
Benchmark
1.16
2.73
-1.40
0.87
3.36
Excess
-0.01
-0.07
0.05
-0.04
-0.06
International Fixed Interest
0.99
1.32
-0.88
0.70
2.14
Benchmark
0.98
1.38
-0.92
0.69
2.13
Excess
0.01
-0.06
0.04
0.01
0.01
International Equity
1.39
4.84
-2.06
1.04
5.20
Benchmark
1.26
4.86
-2.16
1.01
4.94
Excess
0.13
-0.02
0.10
0.03
0.27
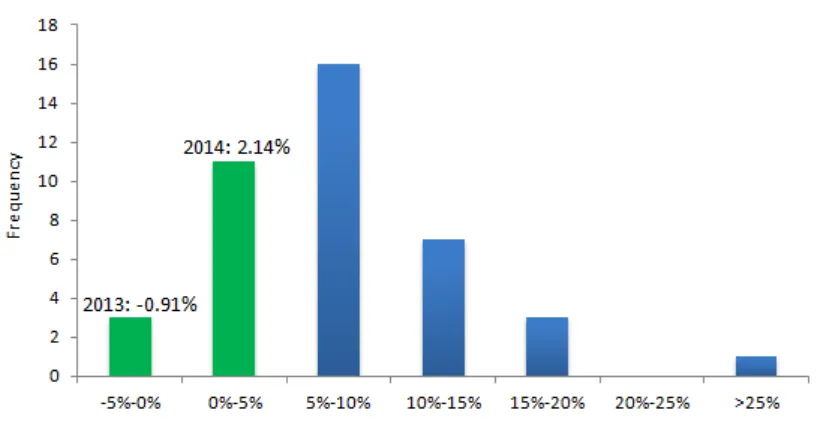
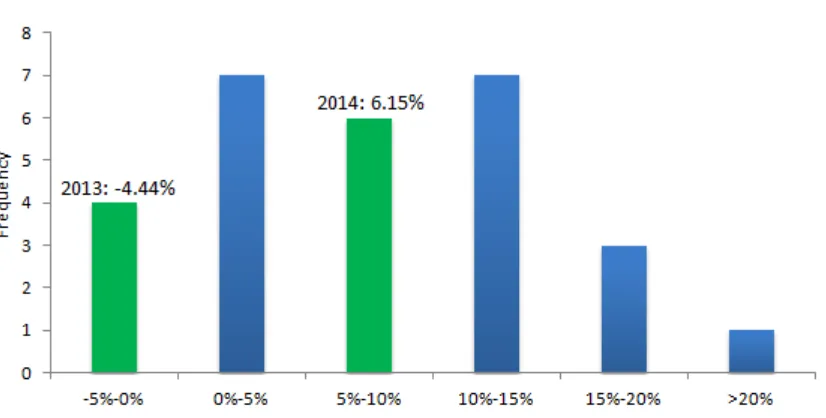
Our actual bond portfolio returned 2.14% in 2014, which was 0.01% higher than the
benchmark return. The passively managed 3-5 year US Treasuries returned 2.2%,
delivering an excess return of 0.07%. The longer-maturity US Treasuries 5-10 year
mandate benefited from falling yields, returned 5.94%, 0.21% short of the benchmark
return of 6.15%. The annual returns for 2014 of the different US Treasuries maturity
buckets are compared to their historical returns in the charts below.
Figure 11 - Investment Returns in 2014 in Percentage (USD)
Longer-term yields for non-US, developed market bonds also declined in 2014.
Consequently, the value of these bonds in local currency terms increased
– for
example, German bunds in Euro, Japanese bonds in Yen and UK Gilts in Pounds
Sterling all posted positive returns. However, the
gains were more than offset by
declines in the underlying currency relative to the USD. The USD appreciated
strongly in 2014. The overall return for the non-US, developed market bond
benchmark was negative 1.25% for 2014. That return can be split into a loss of -11.3%
on currency and 10.1% in local currency returns (coupon and price). The reasons for
the non-USD exposures are discussed in the box below.
Figure 13 - US Treasury 5 -10 years
Annual Return Distribution (1987-2014)
Box 1 -
The Petroleum Fund’s Foreign Currency Exposures
The Petroleu Fu d’s Foreig Curre c E posures
The appreciation of the US Dollar in 2014 caused the Petroleum Fund to record foreign exchange losses.
This o e plai s the ratio ale for the Fu d’s foreig urre
e posures a d the asso iated olatilit i
our reported returns.
Where does the foreign exchange exposure come from?
Timor-Leste uses the US Dollar as its local currency. The Petroleum Fund, as required by the Law, invests
globally outside of Timor-Leste. This includes equities and bonds issued in countries other than the US.
These investments are denominated in currencies other than the US Dollar.
How large is the Petrol
eu Fu d’s foreig excha ge exposure?
The ulk of the Petroleu Fu d’s i est e ts are i the U“ a d are therefore de o i ated i U“ Dollars.
The bond portfolio is primarily invested in US Government bonds, with about 16% of the bonds issued by
other countries and denominated in the associated currencies. A little more than 40% of the equity
portfolio is in companies outside the US. Aggregating this at the total Fund level, approximately a quarter
of our investments is in currencies other than the USD. The largest exposures reflect the major foreign
urre ies, a el the Euro, the UK’s Pou d “terli g a d the Japa ese Ye .
For example, Japanese equities (measured by MSCI Japan) valued in Yen performed strongly in 2014,
posting a return of 9.8%. However, Japanese equities fell 3.7% over the year when converted into USD. That
is the depreciation in the Yen against the USD more than offset the increase in equities in local currency
terms and resulted in on overall loss for the year.
How has foreign exchange impacted
o the Fu d’s portfolio?
Non-
U“D e posure i pa ts the PF’s alue a d retur s as the are reported i U“D. The i pa t o the
Fu d’s reported alue a e positi e or egati e.
The Petroleum Fund incurred a foreign exchange loss of
US$ 425.5 million for the year 2014. The appreciation in the USD in 2014 is attributed to the stronger
economic growth in the US and diverging monetary policy expectation across the world. Our large US
Treasury holding in prior years limited the foreign exchange gains when the US Dollar depreciated. Overall,
foreign exchange losses on equities and bonds have totalled US$ 444 million.
Table 1
–
The Petroleu Fu d’s Foreig E cha ge Gai s/Losses si ce 2009
Year
2014
2013
2012
2011
2010
2009
FX gains/losses (in USD)
(425.54)
(19.35)
0.72
(0.05)
0.02
0.16
Why have non-US dollar exposures?
The Petroleum Fund recorded significant losses on foreign exchange as the USD appreciated in 2014. We
continue to hold non-
U“ urre ies as it is elie ed to e i the Fu d’s lo g
-term interests. Over the
long-ru there are e pe ted to e e efits i ter s of urre
di ersifi atio a d hedgi g the go er
e t’s
non-USD spending.
Di ersifi atio is a ke pri iple u derl i g the Petroleu Fu d’s i est e t strateg . We e efit fro
diversifying across two key asset classes: equities and bonds. In equities, we diversify across companies,
sectors and countries. Diversification within the bond portfolio increased following the introduction of
non-US sovereign bonds in 2013.
We ould hoose to hedge or re o e the foreig e ha ge
exposure by taking offsetting derivative
positions in the foreign currency. The Government, on advice of the Investment Advisory Board, decided to
maintain the foreign exchange exposure in both the equity and bond portfolios. The objective was to
redu e the Fu d’s o e tratio i the U“ Dollar. B spreadi g the e posure a ross urre ies, the Fu d’s
international purchasing power is protected against the possible scenario where the USD is systematically
weaker over a prolonged period. In addition, a broader holding of currencies better reflects the
o positio of the Go er
e t’s spe di g. I ir u sta es su h as
a d
he the U“ Dollar
has been stronger, expenditure denominated in other currencies will be lower in US dollar terms. In other
ords, our fi a ial assets pro ide a i pli it hedge of the go er
e t’s o
-US dollar expenditure.
Di ersifi atio i this ase a tuall i reases the olatilit i the Fu d’s reported retur s. While this a
seem counterintu
iti e, it is si pl e ause the Fu d’s retur s are reported i U“D a d ill flu tuate ith
Management Fees
In accordance with the Operational Management Agreement signed between the
Ministry of Finance and the BCTL
4, a management fee is to be paid from the Fund to
the BCTL as the operational manager. As Figure 14 shown, management fees paid
and deducted from the Fund in 2014 totalled US$ 16.6 million. The amount included
custody and external management fee of US$ 9.6 million, BCTL operating expenses
of US$ 6.5 million, Investment Advisory Board (IAB) expenses of US$ 0.4 million.
Relative to the size of the Fund, the fees for 2014 were 0.10%, which was higher than
previous year of 0.06%.
Category
Amount (in $US)
External management & custody fees
9,618,804
BCTL operational management fees
6,455,290
IAB expenses
377,785
Other expenses
110,641
Total
16,562,520
Going Forward
The Government is contemplating making further incremental improvements to the
bond and equity portfolios by investing in a wider range of sub-asset classes to
improve the risk and return characteristics for the fund. Much work will be directed
towards understanding the risk and characteristics of these new investments, the
associated implementation, and their complexity vis-à-vis the availability of
governance resources.
Advice from the Investment Advisory Board
The Investment Advisory Board (IAB) of the Petroleum Fund held six meetings and
one workshop during 2014. The minutes from the meetings are available on the
BCTL’s website (www.bancocentral.tl
)
. The IAB provided two recommendations
(see Annex X) to the Minister of Finance in accordance with the requirements of
Article 16 in the Petroleum Fund Law:
1)
Advice on the appointment of new bond managers for the Petroleum Fund
After reviewing the BCTL’s proposal on the appointment of AllianceBernstein LP
and Wellington Management Company LLP as external managers of the
Petroleum Fund, the IAB advised Her Excellency the Minister of Finance on 27
March 2014 to approve the proposal as both proposed managers met the
stipulations in Article 12.2 and Article 12.4 of the Petroleum Fund Law. The
Minister of Finance accepted the IAB’s recommendation and instructed the BCTL
to operationalize it.
2)
Update on the IAB’s Statement of Investment Beliefs and Principles
Annex I
General Information
31 December 2014
Minister of Finance
Her Excellency Santina Cardoso (From 16 February 2015)
Her Excellency Emilia Pires
Director General of Treasury
Agostinho Castro
Members of Investment Advisory Board
Olgario de Castro
Gualdino da Silva
Francisco Monteiro
Torres Trovik
Kevin Bailey
Ex Officio (non-voting)
Venancio Alves Maria
Agostinho Castro (alternate, Basilio R.D.C. Soares)
Governor of Central Bank of Timor-Leste
Abraão de Vasconselos
Executive Director of the Petroleum Fund
Venancio Alves Maria
Operational Manager
Banco Central de Timor-Leste
Avenida Bispo Medeiros
Dili
Timor-Leste
Investment Managers
Banco Central de Timor-Leste
Bank for International Settlements
Schroders Investment Management Limited
State Street Global Advisors
BlackRock Investment Management Australia Limited
Russell Investment Management Ltd (ended December 2014)
Alliance Bernstein (commenced July 2014)
Wellington Management (commenced December 2014)
Members of Petroleum Fund Consultative Council
Mericio Juvinal dos Reis
Jose Augusto Fernandes Teixeira
Rui Meneses da Costa
Julio Fernandes
Pe. Julio Crispim Ximenes Belo
Bonaventura M. Bali
Zelia Fernandes
Custodian
J P Morgan Chase Bank N.A.
Statement by the Director General of Treasury
31 December 2014
BACKGROUND
The Petroleum Fund Law No. 9/2005 promulgated on 3 August 2005 and amended on 28 September 2011 (Petroleum Fund Law No.
12/2011) established the Petroleum Fund of Timor-Leste (“Petroleum Fund”). The Banco Central de Timor-Leste (“BCTL”) is responsible
for the operational management of the Petroleum Fund. In accordance with a Management Agreement dated 12 October 2005 and amended
on 25 June 2009 between the Ministry of Finance and the BCTL, BCTL is also responsible for maintaining the books of account for the
Petroleum Fund on behalf of the Director General of Treasury.
FINANCIAL STATEMENTS
In accordance with Article 21 of the Petroleum Fund Law, the financial statements have been prepared in accordance with International
Financial Reporting Standards (IFRS). The statements are:
Statement of profit or loss and other comprehensive income,
Statement of financial position,
Statement of changes in capital,
Statement of cash flows, and
Notes to the financial statements
These financial statements cover the year ended 31 December 2014.
The financial statements have been independently audited by Deloitte Touche Tohmatsu whose audit opinion is attached to the financial
statements.
PETROLEUM FUND CAPITAL
The Petroleum Fund had capital of US$15.0bn on 1 January 2014(2013: US$11.8bn). During the period, taxes and other petroleum revenue
under Article 6 of the Petroleum Fund were US$1.8bn (2013: US$3.0bn). The Fund earned an income of US$502m (2013: US$865m) during
the period. A summary of transactions for the income is given in the “Statement of profit or loss and other comprehensive income”.
US$732m was transferred from the Petroleum Fund to the Consolidated Fund during the year. The capital of Petroleum Fund as at 31
December 2014 was US$16.5bn (2013: US$15.0bn). A summary of the transactions is given in the “Statement of changes in capital”.
BENCHMARKS AND PERFORMANCE
At the Investment Advisory Board (IAB) meeting held on 28 June 2012 the decision was made by the Minister under advice from the Board
to expand the public equity exposure by 0.83% a month over a period of two years to 30 June 2014 to achieve 40% equity exposure.
The equity exposure of 40% was achieved during the year, and the Board considers this to be an appropriate level given the long tem
investment horizon of the Fund.
The Board will continue to review the investment strategy and asset alocation of the Fund to ensure the expected level of returns are in
alignment with the Estimated Sustainable Income (ESI).
Summary of benchmarks
Benchmark Index As at
31 December 2014
As at 31 December 2013 Fixed Interest
BOA Merrill Lynch US Government 0-5 Years 40.0% 45.0%
BOA Merrill Lynch US Government 5-10 Years 10.0% 10.0%
Barclays Global 10.0% 10.0%
Total Fixed Interest 60.0% 65.0%
Global Equities
MSCI World 40.0% 35.0%
Total Global Equities 40.0% 35.0%
Annex II
Statement of profit or loss and other comprehensive income
for the year ended 31 December 2014
Year ended
31/12/2014
Year ended
31/12/2013
Note
USD
USD
Revenue
Interest income
5
142,326,830
149,187,245
Dividend income
177,467,665
105,859,453
Trust income
5,800,126
3,644,699
Other investment income
34,725
162,874
Net gains on financial assets and liabilities at fair value through profit or loss
9
627,313,626
640,006,671
Net foreign exchange losses
(425,542,866)
(19,353,812)
Total revenue
527,400,106
879,507,130
Expenses
External management and custody fees
(9,618,804)
(6,993,353)
IAB expenses
(377,785)
(153,491)
BCTL operational management fees
(6,455,290)
(1,863,119)
Other expenses
(110,641)
(571,744)
Total expenses
(16,562,520)
(9,581,707)
Profit before tax
510,837,586
869,925,423
Withholding taxes
(9,284,000)
(5,010,732)
Profit for the year
501,553,586
864,914,691
Other comprehensive income
-
-Total comprehensive income for the year
501,553,586
864,914,691
Statement of financial position
as at 31 December 2014
As at 31/12/2014 As at 31/12/2013
Note
USD
USD
Assets
Cash and cash equivalents
8
66,842,141
70,185,105
Other receivables
6
20,063,101
11,112,267
Financial assets at fair value through profit or loss
9
16,466,483,685
14,904,678,996
Total assets
16,553,388,927
14,985,976,368
Liabilities
Payables for securities purchased
11,282,656
31,549,249
Accounts payable
3,488,811
2,327,814
Total liabilities
14,771,467
33,877,063
Net assets
16,538,617,460
14,952,099,305
Capital
Capital
16,538,617,460
14,952,099,305
Statement of changes in capital
for the year ended 31 December 2014
Year ended
31/12/2014
USD
Year ended
31/12/2013
USD
Capital at the beginning of the year
7
14,952,099,305
11,775,348,589
Petroleum Fund Gross Receipts
7
1,816,964,569
3,041,836,025
(pursuant to Article 6 of the Petroleum Fund Law)16,769,063,874
14,817,184,614
Transfers to the Consolidated Fund of Timor-Leste
(pursuant to Article 7 of the Petroleum Fund Law)
7
(732,000,000)
(730,000,000)
Transfers for refunds of taxation
(pursuant to Article 10 of the Petroleum Fund Law)