THE SPATIAL INTERACTION OF BANDUNG CITIZENS
Lili Somantri
Geography Education Departement FPIPS, Education University of Indonesia
ABSTRACT
Bandung is one of the cities in Indonesia which has rapid population growth. Bandung also has high citizen mobility that comes from both other areas around the city and inside the city itself. This mobility is caused daily activities of the citizen, eitherby studying or working. The objectives of this research are to analyze: 1) the citizen mobility in Bandung, 2) the spatial distribution of land uses in Bandung, and 3) the spatial interaction of Bandung citizens, on the basis of land use and citizen mobility in Bandung. This research uses descriptive analytical method. The data is collected by using interview based technique. The collected data consist of mobility location, type of occupation, modes of transportation, destination location, and land use type. The data are analyzed using percentage and origin-destination matrix. The result of this research indicates that the purpose of the citizen mobility in Bandung is mostly conducted to work by using his/her own vehicle. Most of the mobility is occurred around each developmental area. Furthermore, it is also revealed that there is a massive movement to Cibeunying region,n which is used for educational purposes, offices, and trading areas.
Keywords: spatial interaction, citizen mobility, origin-destination matrix, Bandung city
ABSTRAK
Bandung merupakan kota yang mengalami pertumbuhan penduduk yang cepat. Selain itu, Bandung merupakan kota yang memiliki mobilitas penduduk yang tinggi baik dari daerah sekitarnya, maupun dari dalam Kota Bandung sendiri. Pergerakan ini lebih disebabkan oleh ativitas warga sehari-hari yang bertujuan untuk bekerja atau sekolah. Penelitian ini bertujuan ingin mengkaji bagaimana kondisi mobilitas penduduk di Kota Bandung, bagaimana kondisi penggunaan lahan di Kota Bandung, dan bagaimana interaksi spasial penduduk Kota Bandung berdasarkan penggunaan lahan dan mobilitas penduduk di Kota Bandung. Penelitian ini menggunakan metode deskripsi analitis. Datanya diperoleh dengan menggunakan teknik wawancara. Data yang dikumpulkan adalah data mengenai lokasi pergerakan, mata pencaharian, kendaraan yang digunakan, lokasi tujuan pergerakan, dan data penggunaan lahan. Analisis data menggunakan persentase dan matrik asal-tujuan (MAT). Hasil penelitian menunjukkan bahwa mobilitas penduduk di Kota Bandung sebagaian besar bertujuan untuk bekerja, dengan menggunakan kendaraan pribadi. Pergerakannya sebagian besar masih di wilayah pembangunan masing-masing. Kemudian diketahui pula bahwa terjadi pegerakan yang besar menuju wilayah Cibeunying dengan penggunaan lahannya berupa kawasan pendidikan, perkantoran, dan perdagangan.
Kata Kunci : interaksi spasial, mobilitas penduduk, matrik asal - tujuan, kota Bandung
INTRODUCTION
Bandung is one of the major cities in Indo-nesia which has very high population den-sity. According to population cencus data of 2010 (BPS-statistics of Bandung), Ban-dung population density is about 14.300/ km2. The high number of population of a city in general, is not only determined by the nature of population growth, but also by the migration factor. According to Colby in Yunus [2010] rural- urban migra-tion is occurred becauseurban areas attract people to come, mainly due to extensive
employment opportunities in various sectors, to gain higher income, to increase access to public facilities (health, educa-tion, and recreation), to get easier accessi-bility, to increase opportunities in career development, and to improve the acce-ssibility to developmental new bussiness activities.
The citizen mobility in Bandung is not only occured in the term of rural-urban mobility, but also in the term of uran-urban mobility, as moving from one area to another area inside Bandung itself. So, it
117 is clear that there is a spatial interaction in Bandung. This spatial inetraction is influ-enced by the type of occupation from the citizen.
Daljoeni [1998] stated that spatial interaction in geography is the flow of people, goods, moneys, or informations either from urban-to-urban or rural-urban. There are three components of spatial in-teractions according to Ullman and Dal-djoeni [1998]: complementarity, transfer-ability, and intervening opportunity.
Inhabitants mobility is mainly caused by the need of complementarity, which is dri-ven by the existence of demands and offers. The complementarity only occurs when the offer is considered beneficial by the person who ask for demand. The be-nefit is determined by many aspects such as cultures, sciences, engineering, and life-conditions. In order to be met, offer and demand need to be bridged from the sepa-rated distance. The greater the complemen-tarity, the greater the flow of people and goods.
The possibility of goods or people to be moved to another place, not only depends on costs and duration. The rule or order to apply is also need to be taken into account, which includes transferabilities. The easier the tranferability, the greater the flow of people and goods.
Intervening opportunity, means, and dis-turbances of such events, for example due to natural disaster and infectious deseases epidemic, are often emerging when people are doing such movement from a place to another place, The people therefore choose alternative modes because their original one is considered unsuccessful. Another option to implement the original plan that ended unsuccessully is called the obsence of intervening opportunities. The greater the intervening opportunities, the smaller the flow of people and goods.
Spatial interaction of citizens, in term of social-geography, is known as population mobility. Kasto [2002] stated that popu-lation mobility is all movement accros the area in certain period of time. Population mobility consists of permanent mobility which is marked by the intention to settle in the destination area, and non permanent mobility which is charactererized by peo-ple who has no intention to live in the area of destination. Non-permanent mobility is divided into two: circular and commuter mobility to the area of destination. Based on the above definition, this reasearch fo-cus on the non-permanent’s commuter mo-bility, in which the population are moving to the their destination without taking a nap and coming back in the similar day, for example as going to office, school, and market.
According to Tamin [2000], spatial inte-raction in the urban area can be imple-mented based on the trip distribution pattern that connect the interaction of land use, transportation network, and traffic flow between the zone of origin (i) and the zone of destinantion (d) as the result of interaction between the zone and land use. The traffic flow will tend to increase if the distance between these two zones is closer. The higher the activity of land use, the higher its ability to attract the traffic flow.
Spatial interaction can be studied by creating a model that links the intensity of movement flow and direction of the current movement flow (no free variables) with the size of the land use structure (independent variables). For instance, the mobility pattern related to the working area inside the city can be modeled by using several variables, such as the distribution of employee locations and location of job opportunities.
118 origin to the destination zone in certain area and during certain time. Origin-desti-nation matrix (MAT) is used by trans-portation planner to describe the mobility pattern. MAT is the two-dimensions ma-trix whichconsists the number of mobility zone in certain areas. The lines inside the matrix represent the origin zone (Oi), while the columns represent the destination zone. Therefore, the matrix cell indicates the intensity of movement from the origin zone to the destinantion zone. Each of cells requires informations related to distance, duration, cost, or three of them as the measurement of accessibility [Waters,
1999; Tamin, 2000].
Mobility patterns also can be described by line pattern besides using matrix pattern. It is generated due to the fact that mobility pattern has not only dimension of the number of movements, but also spatial dimension that is easier to be described graphically [Tamin, 2000]. The research related to spatial interaction of Bandung citizens is very important. The objectives of this research are as follows: 1) to identify the circumstance of the population mobility in Bandung, 2) to identify the circumstance of the land use type in Ban-dung, 3) to identify the spatial interaction of Bandung citizens in terms of the connection between the population mobi-lity and the land use.
THE METHODS
Location
The location of this research is all areas in Bandung City. This area consists of eight developmental areas; namely Bojonegara, Cibeunying, Tegallega, Karees, Ujung Be-rung, Gedebage, Kordon, and Arcamanik.
Instruments and Materials
The main instrument used in this research is a guided interview material, which then applied toeach respondent. The material used in this research is map of the de-velopmental area of Bandung, provided by
Bappeda Bandung, Land use map gene-rated by Quickbird Image Interpretation in 2008. ArcGIS software was utilized for spatial interaction mapping purposes.
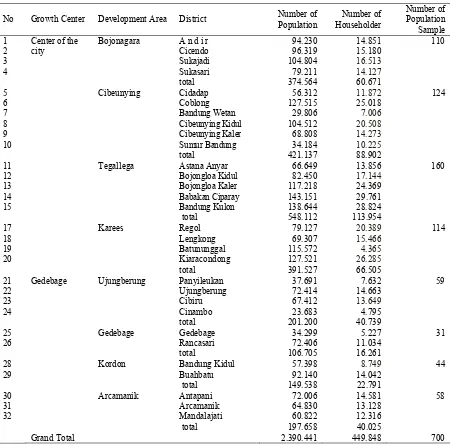
Population and Sample
The population of this research is all Ban-dung citizens, while the sample is about 700 people who are taken proportionally. The population and sample of this research can be seen in Table 1.
RESULT AND DISCUSSION
The population movement from a place to another place is also called population mobility. The mobility of Bandung citi-zens comes from the settlement area to destination area, such as working place or place for study (school, college, etc.). This kind of population mobility is commonly based on the economy and social purposes, which conducted by passing such admi-nistration areas as the borders of the city, district, or even village. Movement to the destination location is conducted commu-terly on a daily basis without purpose to settle in destinied area. This movement is also called as commuter mobility. This kind of mobility is implemented by people who are doing mobility for a short distance between their living places and destination area. Moreover, this movement is also su-pported by the accessibility of trans-portation facilities.
Respondent Jobs
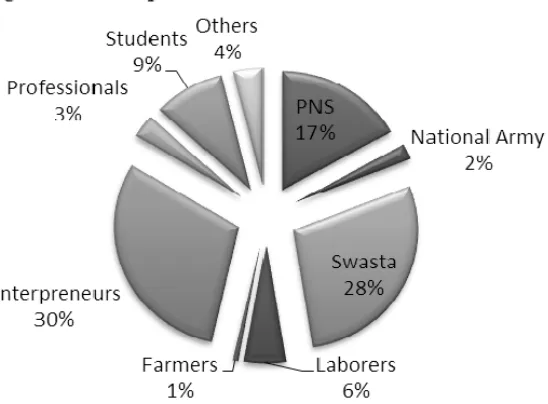
Job opportunities around urban areas have large variation, and so do with the kinds of job. Job opportunities has a relation with the function of the city itself. Bandung is functioned as city that provide services, educations, industries, trade, and center of administrations. Thus, the respondent jobs are also various, as shown by the data in Table 2.
119 Bojonagara region 39.1% of them are work as private employees, in the Cibeunying region, about 35.5% of them work as Entrepreneur, in the Gedebage region, about38.7% work civil servant, in the Karees region, 36.8% of the respondents work as Entrepreneur, in the Kordon re-gion, 29.5% respondents work as private employees, in the Tegallega region about-39.4% respondents work as an entre-preneur, while in the Ujungberung region, 37.3% of the respondents work as civil servants. It can be concluded that the job of the majority of the respondents comes
from private sectors and entrepreneurs. The percentage of the citizens based on their job can be seen in the Figure 1.
Destination of the Daily Movement
Destination of the daily movement has a strong relation with what someone is going to do in everyday life. In the term of daily movement destination, most of respon-dents states that they are going to work (79.3%), 10% of them are going to study in school or university, and about 6% of them are going to shop. To make it clear, the data can be seen in Table 3.
Table 1. Population and Sample of the Reasearch
No Growth Center Development Area District Number of Population
3 Sukajadi 104.804 16.513
4 Sukasari 79.211 14.127
total 374.564 60.671
5 Cibeunying Cidadap 56.312 11.872 124
6 Coblong 127.515 25.018
7 Bandung Wetan 29.806 7.006
8 Cibeunying Kidul 104.512 20.508
9 Cibeunying Kaler 68.808 14.273
10 Sumur Bandung 34.184 10.225
total 421.137 88.902
11 Tegallega Astana Anyar 66.649 13.856 160
12 Bojongloa Kidul 82.450 17.144
13 Bojongloa Kaler 117.218 24.369
14 Babakan Ciparay 143.151 29.761
15 Bandung Kulon 138.644 28.824
total 548.112 113.954
17 Karees Regol 79.127 20.389 114
18 Lengkong 69.307 15.466
19 Batununggal 115.572 4.365
20 Kiaracondong 127.521 26.285
total 391.527 66.505
21 Gedebage Ujungberung Panyileukan 37.691 7.632 59
22 Ujungberung 72.414 14.663
total 106.705 16.261
28 Kordon Bandung Kidul 57.398 8.749 44
29 Buahbatu 92.140 14.042
total 149.538 22.791
30 Arcamanik Antapani 72.006 14.581 58
31 Arcamanik 64.830 13.128
32 Mandalajati 60.822 12.316
total 197.658 40.025
120
Figure 1. Bandung Citizens Precentage
Table 2. Respondent Jobs in Bandung
Jobs
Arcamanik Bojonagara Cibeunying Gedebage Karees Kordon Tegallega Ujungberung Total
∑ % ∑ % ∑ % ∑ % ∑ % ∑ % ∑ % ∑ % ∑ %
Civilian Servant
(PNS) 6 10.3 22 20 16 12.9 12 38.7 22 19.3 5 11.4 13 8.1 22 37.3 118 16.9 National Army
(TNI) 1 1.7 4 3.6 1 0.8 - 0 4 3.5 1 2.3 3 1.9 1 1.7 15 2.1
Private-Employees 25 43.1 43 39.1 33 26.6 4 12.9 23 20.2 13 29.5 49 30.6 9 15.3 199 28.4 Laborer 3 5.2 5 4.5 6 4.8 2 6.5 10 8.8 2 4.5 10 6.3 - - 38 5.4
Farmer 0 2 1.8 1 0.8 0 0 1 2.3 1 0.6 - - 5 0.7
Entrepreneur 13 22.4 26 23.6 44 35.5 6 19.4 42 36.8 7 15.9 63 39.4 10 16.9 211 30.1
Professionals 2 3.4 0 7 5.6 0 0 5 11.4 5 3.1 3 5.1 22 3.1
Students 6 10.3 7 6.4 8 6.5 7 22.6 6 5.3 9 20.5 8 5 14 23.7 65 9.3
Others 2 3.4 1 0.9 8 6.5 0 7 6.1 1 2.3 8 5 - - 27 3.9
Total 58 100 110 100 124 100 31 100 114 100 44 100 160 100 59 100 700 100
Sources: Analysis Result, 2012.
Table 3. Respondent Destination of Daily Movement
Movement Destination
Arcamanik Bojonagara Cibeunying Gedebage Karees Kordon Tegallega Ujungberung Total
∑ % ∑ % ∑ % ∑ % ∑ % ∑ % ∑ % ∑ % ∑ %
To Work 51 87.9 87 79.1 104 84.5 24 77.4 94 82.5 36 81.8 128 80 49 83.1 561 79.3
To Study 7 12.1 12 10.9 8 6.2 7 22.6 8 7 7 15.9 16 10 9 15.3 77 10.9
To Shop 0 0 7 6.4 8 6.2 0 0 10 8.8 0 0 12 7.5 0 0 49 6.9
To Involve in
Social Activity 0 0 0 0 0 0 0 0 1 0.8 0 0 1 0.625 1 1.7 6 0.8 To Go for
Recreation 0 0 1 0.9 1 0.8 0 0 0 0 1 2.3 0 0 0 0 4 0.6 Others 0 0 3 2.7 3 2.3 0 0 1 0.8 0 0 3 1.875 0 0 10 1.4
Total 58 100 110 100 124 100 31 100 114 100 44 100 160 100 59 100 700
121
Modes of Transportation Used to Working Location
Modes of transportation that are used to the office areaare strongly related to the ownership of transportation vehicle. There are many factors that influence somebody to use particular modes of transportation to their office. Modes of transportation used by the respondent to the working place are shown in Table 4.
According to the modes of transportation data, most of them (77,1%) use their own vehicle; about 16,6% of them use public transportation; and about 5,4% of them going by walking, only 0,6% of them using picking up transportations.
When they are being asked about the rea-son using perrea-sonal transportation, most of them claim that it is faster, more econo-mical, cheaper, saver, and more comforta-ble than public transportation. Another reason is that public transportation follows the specified route, while the route of personal transportation is more flexible since it can be adjusted by the space (distance) and time needed by the owner. The owner of personal transportation has independency to choose the route, espe-cially to avoid the traffic area. The issue of personal transportation really associates with the increasing of income. However, the more the people use personal trans-portation, the greater the threat of traffic jam so that the government then attempts the people to use mass transportation.
The Location of Movement Destination
There are various respondents destination location according to their job in relation with the distance and. The destination mo-vement of the respondent can be seen in the origin-destination matrix of Bandung citizens in Table 5.
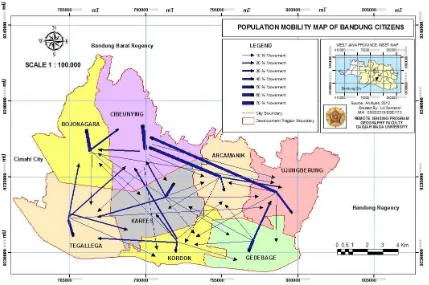
According to the table, it can be found that 18.5% of the respondents in Arcamanik region move to Cibeunying region. In
Bojonegara region, 75% of them move daily around the region itself, and so does in Gedebage region. In Karees region, 75% of the inhabitants also move inside the region itself. In Kordon region, 36.4% of them only move around Kordon, while 64.7% and 40% of them moves around Tegallega and Ujung Berung repectively.
There is a great movement to region Ci-beunying from this following regions: Arcamanik 18%, Bojonagara 13.7%, Ka-rees 8.1%, Kordon 9.7%, Tegallega 12.1%, and Ujungberung 8.8% (Figure 2).
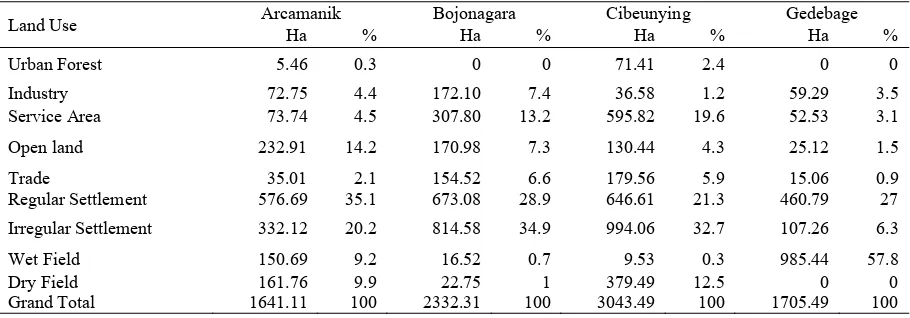
It can be found that about 55.3% of Arcamanik region is dry field, and 14.2% are open land. In Bojonagara region, about 63.8% is used as settlement, while 13.2% is used for educational area, such colleges as Indonesian Education University, Po-lytechnic Bandung, and Bandung Institute of Tourism. In Cibeunying region, 54% used as settlement, while 19.6% is used as educational area and governmental office, especially ITB, Governor of West Java office, Mayor of Bandung office, and governmental duty both West Java pro-vince and Bandung city. About 57.8% of the land in Gedebage is wetland, while 37% of it is regular settlement.
122
Tabel 4. Kind of Transportations Used by the Respondent to Their Office
Transportations
Arcamanik Bojonagara Cibeunying Gedebage Karees Kordon Tegallega Ujungberung Total
∑ % ∑ % ∑ % ∑ % ∑ % ∑ % ∑ % ∑ % ∑ %
Personal-Transportation 46 79.3 77 70 104 83.9 29 93.5 77 67.5 41 93.3 121 75.6 45 76.3 540 77.1 Picking-up
Transportation 0 0 0 0 0 0 0 0 1 0.9 0 0 3 1.9 0 0 4 0.6 Public
Transportation 10 17.2 27 24.5 16 12.9 0 0 20 17.5 3 6.8 26 16.3 14 23.7 116 16.6
By Foot 2 3.5 6 5.5 4 3.2 2 6.45 16 14 0 0 8 5 0 0 38 5.4
Others 0 0 0 0 0 0 0 0 0 0 0 0 2 1.3 0 0 2 0.3
Total 58 100 110 100 124 100 31 100 114 100 44 100 160 100 59 100 700 100
Source: Analysis Result, 2012.
Table 5. Origin-destination Movement Area of Bandung People
Destination
Arcamanik Bojonagara Cibeunying Gedebage Karees Kordon Tegallega Ujungberung Total
∑ % ∑ % ∑ % ∑ % ∑ % ∑ % ∑ % ∑ %
Arcamanik 10 17.2 0 0 23 18.5 0 0 4 3.5 11 25 0 0 10 16.9 58
Bojonagara 0 0 83 75.5 17 13.7 0 0 5 4.4 0 0 3 1.9 2 3.4 110
Cibeunying 25 43.1 14 12.7 36 29 0 0 5 4.4 1 2.3 28 17.5 15 25.4 124
Gedebage 4 6.9 0 0 0 0 20 64.5 3 2.6 4 9.1 0 0 0 0 31
Karees 5 8.6 0 0 10 8.1 0 0 75 65.8 3 6.8 18 11.3 3 5.1 114
Kordon 1 1.7 0 0 12 9.7 1 3.2 7 6.1 16 36.4 3 1.8 4 6.8 44
Tegallega 0 0 13 11.8 15 12.1 0 0 14 12.3 9 20.5 108 67.5 1 1.7 160
Ujungberung 13 22.4 0 0 11 8.8 10 32.3 1 0.9 0 0 0 0 24 40.7 59
Grand Total 58 100 110 100 124 100 31 100 114 100 44 100 160 100 59 100 700
Source: Analysis Result, 2012.
Table 6. Land Use in Arcamanik, Bojonagara, Cibeunying, and Gedebage region
Land Use Arcamanik Bojonagara Cibeunying Gedebage
Ha % Ha % Ha % Ha %
Urban Forest 5.46 0.3 0 0 71.41 2.4 0 0
Industry 72.75 4.4 172.10 7.4 36.58 1.2 59.29 3.5 Service Area 73.74 4.5 307.80 13.2 595.82 19.6 52.53 3.1
Open land 232.91 14.2 170.98 7.3 130.44 4.3 25.12 1.5
Trade 35.01 2.1 154.52 6.6 179.56 5.9 15.06 0.9
Regular Settlement 576.69 35.1 673.08 28.9 646.61 21.3 460.79 27
Irregular Settlement 332.12 20.2 814.58 34.9 994.06 32.7 107.26 6.3
Wet Field 150.69 9.2 16.52 0.7 9.53 0.3 985.44 57.8
Dry Field 161.76 9.9 22.75 1 379.49 12.5 0 0
Grand Total 1641.11 100 2332.31 100 3043.49 100 1705.49 100
123
Table 6.(Cont.) Land Use in Region Karees, Kordon, Tegallega, and Ujungberung
Land Use Karees Kordon Tegallega Ujung Berung Total
Ha % Ha % Ha % Ha % Ha %
Urban Forest 19.22 0.9 0 0 0 96.09 0.6 Industry 106.66 5.1 32.95 2.7 371.36 15.1 374.75 16.9 851.71 5.9
Service Area 429.46 20.4 107.33 8.6 100.40 4.1 66.05 3 1667.08 11.5 Open land 32.55 1.6 53.09 4.3 143.20 5.8 38.47 1.7 788.28 5.4 Trade 194.95 9.3 28.27 2.3 216.42 8.8 23.99 1.1 823.78 5.7 Regular Settlement 648.19 30.8 567.75 45.7 512.80 20.8 236.59 10.6 4086 28.1 Irregular Settlement 611.84 29.1 236.37 19 958.40 38.8 595.49 26.8 4054.61 27.9 Wet Field 60.01 2.9 216.02 17.4 164.89 6.7 403.45 18.1 1604 11
Dry Field 0 0 0 485 21.8 564 3.9
Grand Total 2102.89 100 1241.78 100 2467.57 100 2223.80 100 14534.64 100
Source: Interpretation of Quickbird Imagery, 2008.
Figure 2. Population Mobility Map of Bandung Citizens
CONCLUSION
Mobility of Bandung citizen, in terms of job occupancy, indicates that most of them are entrepreneur and private employees. Their daily movement is to work, and the most dominant transportation used is personal transportation.
124 wetlands, in Karees region, about 59,9% is used as settlement, in Kordon region about 65,7% of the land is used as settlement, in Tegallega region, about 68,6% of the area used as settlement, and for Ujungberung region about 21,8% of the area is used for wet land.
Most of Bandung inhabintants moves in their own region, however, among the regions in Bandung, most of the citizens are moving to Cibeunying region. This
situation is led by the land use of the Cibeunying area, which is dominated by offices and service areas, such as governmental office, college, public company, and private offices.
ACKNOWLEDGEMENT
Acknowledgement given to my supervisors Prof. Totok Gunawan, MS., Projo Danoedoro, Ph.D and Prof. Su Ritohardoyo.
REFERENCES
BPS (2008), Statistics of Bandung.
Daldjoeni (1998), Rural-urban geography (in bahasa), Alumni, Bandung.
Hurst, E. (1974), Geography Transporta-tion: Comments and Readings.
McGraw-Hill, Inc., New York.
Kaltheier, R.M. (2002), Urban Transport and Poverty in Developmental Co-untries: Analysis and Options for Transport Policy and Planning,
Deutache Gesselchaft for Technis-che Zusammenarbeit Eschborn.
Mouncif, H., Boulmakoul, A., and Chala, M. (2006), Integrating GIS-Tec-hnology for Modelling Origin-Destination Trip in Multimodal Transportation Network, Interna-tional Arab Journal of Information Technology 3, (3): 256-264.
Tamin, O.Z. (2000), Transportation plann-ing and modelplann-ing (in bahasa), ITB Publisher, Bandung.
Tamin, O.Z. (2008), Planning, modeling, and manipulation of theoretical transportation; theory, example, and application (in bahasa), ITB Publisher, Bandung.
Tukiran and Ediastuti, E. (2004), Present indonesian citizens and challanges in the future (in bahasa), Uni-versitas Gadjah Mada, Yogyakarta.
Warpani, S.P. (2002), Traffic and road management transformation (in bahasa), ITB publisher, Bandung.