www.elsevier.comrlocaterdsw
Towards an holistic understanding of disruptions in
Operations Management
Patrik Jonsson
)School of Management and Economics, Vaxjo Uni¨ ¨ Õersity, 351 95 Vaxjo, Sweden¨ ¨
Abstract
The paper reviews the literature on maintenance management, integrates key dimensions of maintenance within a taxonomy of maintenance configurations, and explores the impact of differing configurations on contextual factors and operational performance.APreventionB, Ahard maintenance integrationB andAsoft maintenance integrationB were identified as key maintenance variables. Data were collected from 253 Swedish manufacturing companies, and three distinct clusters were identified.AProactive MaintainersBemphasized preventive maintenance policies.AIT MaintainersBrelied on computer-ized and company-wide integrated information systems for maintenance.AMaintenance LaggersB emphasized all mainte-nance dimensions to lesser extent than the others. The importance of maintemainte-nance prevention and integration differ between contexts. There were subtle performance differences across identified configurations, but preventive and integrated maintenance were more important for companies seeking competitive process control and flexibility. There existed no group with any great emphasis on all three maintenance dimensions, but attaining truly high performance may require a rare mix of the three dimensions. This mix of variables could constitute a hypothesizedAWorld Class MaintenanceB group. q2000
Elsevier Science B.V. All rights reserved.
Keywords: Operations strategy; Maintenance; Productivity
1. Introduction
Holistic and proactive concepts, such as Lean Production, Just-in-Time, Total Quality Management
ŽTQM , Concurrent Engineering and Supply Chain.
Management, are becoming important for companies seeking lean processes with short through-put time and zero defects. In most plants, the physical equip-ment is susceptible to failure through breakdown, deterioration in performance through age and use, and to obsolescence due to improvements in technol-ogy. However, the rising importance of A
streamlin-)Tel.:q46-470-708797; fax:q46-470-83092.
Ž .
E-mail address: [email protected] P. Jonsson .
ingBthe processes and achieving process control and flexibility raises the cost of disturbances, and thus increases the need for reliable and consistent equip-ment without quality problems.
Error-free production with a minimum of stop-pages, speed losses and quality defects are, however, still uncommon in industrial practice. Studies
indi-Ž
cate overall equipment efficiencies defined by Nakajima, 1988, as Availability=Performance
effi-.
ciency=Rate of quality product in the 40% to 70%
Ž .
range Ljungberg, 1998; Ericsson, 1997 , due to frequent process disturbances. These disturbances may lead to production losses and other indirect
Ž
AhiddenB costs e.g. bad internal and external
envi-.
ronment and safety of operators that affect the
0272-6963r00r$ - see front matterq2000 Elsevier Science B.V. All rights reserved.
Ž .
overall performances of the organizations, for exam-ple in terms of higher direct production costs, longer through-put times, lower product quality and low customer service. A main reason for disruptions and unavailability in the production equipment is often considered to be the absence of proper maintenance
Že.g. Nakajima, 1988; Ericsson, 1997 . Therefore,.
maintenance should have an important role in opera-tions management research and practices, yet this is not supported by current literature.
This paper seeks to fill some of the gaps in the literature on maintenance within operations strategy. The objectives are to review the literature on mainte-nance management, integrate key dimensions of
maintenance within a taxonomy of maintenance
figurations, and explore the impact of differing con-figurations on contextual factors and operational
performance.
The growing use of advanced information and manufacturing technologies, such as electronic data interchange, enterprise resource planning, activity based costing, flexible manufacturing systems, robo-tics, and automatic handling systems, may help com-panies to achieve competitive process control and flexibility. Research in operations strategy has clearly shown thatAlearning organizationsB with decentral-ized authority and empowered personnel are impor-tant prerequisites for achieving the full potential of
Ž
investments in technology e.g. Dean et al., 1992; Maffei and Meredith, 1994; Chen and Small, 1996;
.
Boyer et al., 1997 . There was only one study to be
Ž
found on advanced manufacturing technology
Jons-.
son, 1999 , which emphasized the importance of maintenance, and explained that it is a key variable for achieving high performance in advanced manu-facturing technology environments.
Maintenance is also a key missing variable in existing works that have explored configurations of operations strategy and infrastructure, and their var-ied impact on performance. Those studies focusing on the competitive capabilities of operations strategy
ŽMiller and Roth, 1994; Sweeney, 1991, 1993 are.
very well cited and have become Abasic theoryB in operations management. Another taxonomy describ-ing manufacturdescrib-ing structure and infrastructure is also valuable for understanding the role of infrastructure
Ž .
in high-tech companies Boyer et al., 1996 . These configurations are important contributions to
opera-tions strategy, but development of a maintenance taxonomy that links maintenance to operations strat-egy and performance would further the theory and practical development of operations strategies.
The paper is structured according to the objec-tives. First we discuss the development of the main-tenance discipline, review the present mainmain-tenance literature, and identify three key variables within a cohesive maintenance management approach. Cluster analysis is then employed to identify an empirical maintenance taxonomy based on the three mainte-nance variables. Survey data is collected from seven Swedish manufacturing industries that together rep-resent the majority of Swedish manufacturing com-panies. The similarities and differences of contextual factors and operational performance between the three identified clusters are explored by comparing means of the clusters. The paper ends with a discus-sion on the findings and limitations of the conducted study.
2. A maintenance management framework
This section discusses the development of the maintenance discipline and describes maintenance
Ž .
prevention, integration soft and hard , and context in more detail.
2.1. Present maintenance approaches and configura-tions
The development of the maintenance discipline has been influenced by academic disciplines, such as industrial engineering, operations research and busi-ness administration. It started as an engineering topic, then operations research was included, and now also more emphasis is on the business and management disciplines. The development is driven by the need
Ž .
of industry, but as Sherwin 1999 states; A mainte-nance management has always developed somewhat behind the current requirementsB.
During the last decades much emphasis has been put on preÕention and company-wide integration of
various levels of the organization, and emphasis is changing towards its contribution to overall perfor-mance, instead of pure costs. This could be illus-trated in the changed perspective from life-cycle
Ž
costs to life-cycle profits of systems e.g. Ahlmann,
.
1998 .
The Terotechnology and Total Productive
Mainte-Ž .
nance TPM concepts have integrated maintenance into machine design, production and quality
im-Ž
provement processes of organizations e.g.
Naka-.
jima, 1988; Rodriguez, 1990; Sherwin, 1999 . Focus is on interaction between operators, maintenance crew and support staff. The objective is to continu-ously decrease the equipment losses and to improve the availability. The activities that previously were hierarchically controlled by the maintenance depart-ment are, to a greater extent, becoming parts of the responsibility of production teams, and being
out-Ž .
sourced to external service providers Martin, 1997 . A basic idea of the ever more popular TPM concept is that the maintenance crew supports and trains the operators to do most of the daily equipment
mainte-Ž
nance e.g. cleaning, lubricating, tightening of bolts,
.
adjusting, etc. and that they themselves carry out only the more serious maintenance activities. It has finally transformed maintenance to an integrated or-ganization and quality discipline, and has helped organizations to improve considerably their levels of
Ž .
overall utilization Nakajima, 1989 . This approach to maintenance is important for lean industrial manu-facturing and the achievement of overall
improve-Ž .
ments. Patterson et al. 1996 , for example, showed in a case study that TPM may lead to improved equipment availability, resulting in dramatically im-proved product cycle time, higher quality levels, less tied-up capital and increased overall productivity.
Although, proper maintenance approaches exist, neither maintenance practice nor theory are fully developed. Several papers have indicated that main-tenance is a Alow priorityB discipline. Consultants have reported lists of maintenance-related problems
Že.g. Smith, 1993 , but most of these findings are.
based on limited cases and experience. Research
ŽWireman, 1990; De Jong, 1997; Jonsson, 1997;
.
McKone et al., 1999 , however, shows that mainte-nance is somewhatAunder-developedB, with lack of prevention and integration, in manufacturing compa-nies on most continents.
There is also a lack of maintenance management configurations, such that could be useful to improve the understanding of the underlying dimensions of maintenance, and that could explain the effects of preventive maintenance and integrating maintenance into manufacturing. However, we have found a few conceptual maintenance typologies that emphasize prevention andror integration. The basic A Tero-technology ModelBand advanced modifications of it
Že.g. Sherwin, 1999 call for feedback of information.
at several stages in the maintained system’s life cycle, and link maintenance to quality and delivery
Ž .
capabilities. Geraerds 1992 presented the
Eind-Ž .
hoven University of Technology EUT model that contained 14 sub-processes of maintenance and the
Ž .
Gits 1992 typology was based on Asix steps to
Ž .
generate maintenance rulesB. Raouf 1994 took an Aoperations managementBperspective, that was very similar to TPM, and described the maintenance
pro-Ž
cess in terms of organizing job design, standards,
.
work measurement and project management ,
plan-Ž
ning maintenance capability, maintenance strategies
. Ž
and scheduling and controlling inventory control, material control, quality control and management for
.
quality .
The content of, and relationship between, the prevention and integration variables are further dis-cussed in Sections 2.2–2.4. In Section 2.2, various preventive maintenance policies are described. Hard
Žtechnology and IT and soft human and organiza-. Ž .
tional integration, that are discussed in Section 2.3, are importantAenablersB for several preventive poli-cies. The optimum choice of maintenance policy and integration mechanisms differs between contexts
ŽFig. 1 . Preventive maintenance policies need to be.
supported by hard and soft integration. Computeri-zed maintenance management information systems, for example, are quite important for condition moni-toring and maintenance optimization, but also for decentralized improvement work that rely on em-powerment and self-managed teams. Maintenance approaches in various contexts are discussed in Sec-tion 2.4.
2.2. PreÕentiÕe maintenance
tra-Fig. 1. Interaction between maintenance prevention and integra-tion.
Ž
ditionally grouped as corrective i.e. failure-based
.
maintenance or preventive in nature, and this struc-ture is still relevant in most situations. The preven-tive policies can be further divided into use-based, condition-based, opportunity-based, design-out, and
Ž
stand-by equipment maintenance Pintelon and
.
Gelders, 1992, p. 308 .
Ž .
The failure-based maintenance FBM approach is planned, but the action is reactive. No action will be taken until the event of failure. Typical corrective maintenance activities are emergency actions, repair, remedial and other un-scheduled maintenance. In many instances, temporary repairs may be made or redundant equipment used, so that the process can function again as soon as possible. Permanent repairs would have to be made at a later and more conve-nient time. Some activities may be delayed, due to redundant equipment or for cost reasons. Mobley
Ž1990 referred to a study that showed that the costs.
for repair performed in this run-to-failure mode aver-age about three times higher than the same repair made within a use-based or condition-based mode. The costs are high due to high cost of restoring equipment to an operable condition in a crisis situa-tion, the secondary damage and safetyrhealth haz-ards inflicted by the failure, and the penalty and loss of future orders associated with lost production. Cor-rective maintenance, or failure-based, can in some cases be the most appropriate policy. However, in the cases of purely random breakdowns and low breakdown costs, the failure-based maintenance pol-icy may be the best polpol-icy. This is, however, not the
case for most organizations. Where ArandomB fail-ures are identified and, therefore, failure-based main-tenance considered, deeper investigation usually shows that data is being collected at too high a level. The system may have a random breakdown pattern, but the components and parts within the system probably have increasing failure rates. A preventive maintenance policy should therefore be most
appro-Ž .
priate. As Sherwin and Bossche 1993 state: A sys-tems fail but we renew partsB, so parts-level data are required for an accurate analysis.
Ž .
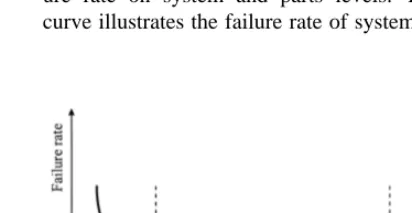
Use-based UBM maintenance is a preventive policy and is carried out at predetermined intervals or corresponding to prescribed criteria and is in-tended to reduce the probability of failure or the performance degradation of an item. Its objective is to reduce the probability of breakdown by replacing or maintaining components after a specified number of units or time are used. The objective of all use-based maintenance is to lower the failure rate of equipment. If the failure rate is decreasing, used-based maintenance would result in increasing the rate, and if the failure rate were constant, it would not alter it. In the traditionalAbathtub curveB, where the failure rate of the component or system is illus-trated as a function of its life cycle, we find an
Ž .
increased failure rate in the wear-out region Fig. 2 . Preventive maintenance interventions that are carried out before this region will only cost money, without lowering the probability of failure of the system. The bathtub curve is criticized, though. Sherwin and
Ž .
Bossche 1993 , for example, argued that there is a misunderstanding of the difference between the fail-ure rate on system and parts levels. The bathtub curve illustrates the failure rate of systems, but
ponents or parts are repaired, and the individual failure rates of the components have different shapes. A similar curve could, however, be drawn for a
Ž
repairable system consisting of components Pintelon
.
and Gelders, 1992 .
A positive effect of trend detection through data analysis carried out under use-based maintenance is that the analyst gains insight into the causes of failure, sees suitable preventive actions, and gets ideas for improvement that can help avoid future failures. These effects are often decreased as plan-ning, failure detection and repair are seldom carried out by the same people. The schedules are not always based on primary maintenance modeling, but rather on scheduling plans from the machine deliv-erer. This can be quite precarious, as these schedules often are based on historical average data from dif-ferent plants and environments, or on no data at all. Optimum application of the use-based maintenance policy requires proper data, often supported by com-prehensive and integrated information systems. There is great potential in use-based maintenance, but its complexity, misunderstanding of
systems-versus-Ž .
parts failures as discussed earlier and therefore lack of proper data, often makes use-based maintenance difficult to successfully apply. Therefore, use-based maintenance is one of the least applied preventive
Ž .
maintenance policies Jonsson, 1997 .
Ž .
Condition-based maintenance CBM concerns preventive maintenance initiated as a result of knowledge of the changed condition of any particu-lar item from routine or continuous monitoring. The causes of potential failures have to be identified since the key characteristics of underlying physical processes change from an initial value to a fatal value before failure occurs. Condition-based mainte-nance cannot be applied if such measurable A prog-nostic characteristicsBcannot be found. The selected parameters are inspected continuously or with a cer-tain frequency. Action, but often not overhaul, is taken if the measure exceeds the warning limit. Condition-based maintenance has been more
impor-Ž
tant lately Dekker, 1989; Geraerds, 1992; Mobley,
.
1990; Kelly, 1997; Pintelon and Gelders, 1992 . This is driven by the fact that the average manufacturing
Ž .
company no matter which industry streamlines its processes, and emphasizes quality and flexibility ca-pabilities to greater extent than before, which results
in more serious consequences of failure and the need for early detection of potential disruptions.
Condition monitoring techniques, such as vibra-tion monitoring, process-parameter monitoring, ther-mography and tribology, as well as operators, have key roles in condition-based maintenance policies. Visual inspection by operators can also be consid-ered to be a condition-monitoring technique. Many of the potential failures can often be recognized by using the five human senses in order to continuously monitor the conditions of the machines. It is not uncommon that lubrication, routine cleaning, span-nering and adjustment carried out by operators are the most profitable of all preventive maintenance
Ž .
policies e.g. Idhammar, 1992 . Studies presented by
Ž .
Maggard and Rhyne 1992 show that about 75% of maintenance problems could be prevented by opera-tors at an early stage, by frequent looking, listening, smelling and tasting. This is the basic principle
Ž
behind the operator involvement in TPM see e.g.
.
Nakajima, 1988 . However, although it may delay the need for heavy maintenance, it does not eliminate all of it, and CBM based on human senses should therefore be combined with some other preventive policy. Collection and distribution of proper planning data should be critical for condition monitoring, as well as for the use-based policy.
Ž .
Opportunity-based maintenance OBM is carried out during summer breaks, during other periods of low utilization, or when the equipment is idle, due to imbalance in planning or especially breakdown in other equipment. A negative result of maintenance during the shorter temporary stops is that the little maintenance jobs may be done rather than the big ones, which are repeatedly delayed.
Ž .
Design-out maintenance DOM deals with im-proving the maintainability and reliability of the equipment in the design stage or by later physical modification of the equipment. Perhaps, design-out maintenance should not be viewed as a policy. It is of a more strategic nature than the other policies.
Ž .
Despite the obvious importance of integrating main-tenance at an early stage, we could not find many papers that had discussed this topic in any detail.
Ž .
Gotoh 1988 , however, has presented a framework that builds maintenance reduction features into equip-ment at the design stage. His methods focus on reducing the time from new equipment design to stable operation, achieving effective balance between equipment maintenance, planning and improvement, and production of reliable equipment with lower life cycle costs.
Ž .
Stand-by equipment SBE redundancy is an addi-tional policy that typically will be used where the cost or risk of breakdown is extremely high, and where the equipment is not too expensive, or less expensive than buffer storage or alternative supplies. Failure in this type of equipment in particular may remain hidden until the item is in use. Preventive maintenance is therefore conducted through fault-finding activities at scheduled intervals. Hidden fail-ures also affect parts of operating equipment,
particu-Ž
larly trips and alarms Hidden failures do represent a
.
problem with other machines as well, though. . Par-tial redundancy, the ability to carry on at reduced output, is also an important aspect of redundancy.
Optimum policy is decided by its specific context, but the demand for short leadtimes, low tied-up capital, high quality and flexibility lead to increased costs for breakdown and consequently high costs for failure-based maintenance. Therefore, it is likely that a mix of preventive policies, rather than reliance
Ž .
on corrective maintenance failure-based policies , would be preferable in most industrial manufacturing systems. Several preventive policies are based on specific organizational design and IT decision sup-port, and, consequently, rely on hard and soft inte-gration, discussed in the next sections. Thus, the following hypothesis is tested:
H1. Companies that focus on preventive
mainte-nance policies are more likely to achieve high opera-tional performance than companies that focus on corrective policies.
2.3. Integration
Integration of maintenance into manufacturing and the rest of the organization is partitioned intoAhard
integrationB and Asoft integrationB variables. The AhardB issues deal with integration supported by technology and computers.ASoftBintegration, on the other hand, deals with human and work organiza-tional integration issues. The two integration vari-ables are closely related to the prevention variable, and are considered important enablers for effective realization of preventive policies.
2.3.1. Hard maintenance integration
Advanced technology has several objectives and functions, such as transactional, geographical,A auto-mationalB, analytical, informational, sequential, knowledge management, tracking and
dis-intermedi-Ž .
ation Davenport and Short, 1990 . In terms of main-tenance management the AhardB issues deal with Computerized Maintenance Management Systems
ŽCMMS of the MRO store maintenance, repair and. Ž .
operating supplies and scheduling of maintenance work, condition monitoring technologies, built-in test equipment, databases with reliability data on elec-tronic and mechanical components, decision support
Ž . Ž
systems DSS , etc. for a more thorough discussion on IT opportunities for maintenance see for example
.
Pintelon et al., 1999 . The objective of all AhardB maintenance issues is not primarily to integrate maintenance into the organization, but instead has an indirect effect.
A computerized maintenance management system is never a tool that can improve the competitiveness of an organization by itself, but rather it is a platform that collects and records the data for maintenance control and manufacturing process improvement, and supports the integration of functions and speeds up the flow of proper information. With a computerized maintenance management system integrated into the overall information system, the feedback from main-tenance to production could be improved, and distur-bance registration for continuous improvement could
Ž .
be conducted. De Smet et al. 1997 , for example, showed the positive effects of computerized distur-bance registration in a number of case studies. The
Ž .
between production and maintenance departments, and to connect the computerized maintenance man-agement system to alarms and bleepers via a
pro-Ž .
grammable logic controller PLC . This informa-tional link between maintenance and manufacturing is critical for inducing process improvement and maintenance into company-wide issues. The exis-tence of an integrated computerized maintenance management system is not enough in itself for pre-vention and proactive process improvement, but it enables organizations to implement it. The computer-ized maintenance management system contributes in two main ways. First, it enables automatic data capture and information transformation, leading to more accurate data quality. Secondly, it makes it easier for cross-functional design and project teams to base their decisions on facts. Thus, we test the following hypothesis:
H2. Companies that emphasize hard maintenance
integration are more likely to achieve high opera-tional performance than companies that do not.
2.3.2. Soft maintenance integration
Soft integration issues of maintenance deal with the structure and the actors in the organization. New technology allows plants to have fewer humans di-rectly participating in the physical manufacturing processes. Increased need for quality, flexibility, in-novation and service, as described by for example
Ž . Ž .
Chase et al. 1992 , Corbet and Wassenhove 1993
Ž .
and Hill 1993 , affect the organizational design of manufacturing firms as well. These changes often lead to decreased need for standardization and for bureaucratic organizational structures, even in mass production firms. In organizations that compete on most manufacturing capabilities the highly special-ized work force is exchanged for a multi-skilled and flexible one, with authority decentralized to the shop
Ž . Ž .
floor e.g. Brulin and Nilsson, 1995 . Spencer 1994 and others have shown that in theseAnew organiza-tionsB the horizontal flow of work across processes is more important than maintaining hierarchical con-trol, and managerial boundaries between functional areas should be eliminated to ease coordination.
The human role in theAnew manufacturing orga-nizationBis best described in the TQM literature, for
Ž .
example inADeming’s 14 pointsB 1986 or by Juran
Ž1989 ,. Spencer 1994, p. 447 summarizes the role. Ž .
of employees in TQM as:
Employees are empowered to make decisions, build relationships, and take steps needed to improve quality within the system designed by management. Additional training and educational opportunities provide necessary skills for this broader role
In the Malcolm Baldridge Quality Award, the human actors are identified by human resource plan-ning, employee involvement, employee education and training, employee performance and recognition, and employee well-being and fulfillment. Dean and
Bed-Ž .
nar 1994 emphasized that human resource planning has a small role in TQM. Employee involvement, empowerment and teamwork ideas are on the other hand corner stones in the concept. They are based on earlier organizational theories, such as those of
Lik-Ž . Ž . Ž .
ert 1967 , McGregor 1990 and Ouchi 1981 . Em-ployees, and in particular groups of emEm-ployees, are given authority to make appropriate decisions for the particular situations they face. Education and training can be considered prerequisites for most of the other human aspects. The focus is on horizontal and cross-functional training, to make the employees multi-skilled, and not on creating vertical
excellen-Ž .
cies. Bowen and Lawler 1992 assert that the ratio-nale of TQM is to help employees acquire a systems orientation via cross-functional career moves and horizontal reassignments. Performance and recogni-tion is changed from individual to the team or
sys-Ž . Ž .
tem level. Waldman 1994 and Deming 1986 ar-gue that performance is due mainly to system factors beyond an individual’s control and that individual performance appraisal should be abolished. Deming further asserts that job satisfaction, job commitment and pride of workmanship are most important for employee fulfillment. The link between job fulfill-ment and continuous improvefulfill-ment, customer satis-faction and performance is considered to be strong among TQM enthusiasts.
au-tonomous production teams, small group activities and mounting a major effort in education and train-ing are essential organizational buildtrain-ing blocks. The aim is to make maintenance and process disruptions into company-wide issues, i.e. the activities should be performed by other than the maintenance depart-ment. The human aspects of maintenance activities
Ž .
are well illustrated by Shirose 1992 and Suzuki
Ž1992 . They argued that TPM changes the way.
operators think about equipment. This change can be realized when employees are empowered to make decisions, build relationships, and take steps needed to prevent breakdowns and improve quality within a system designed by management. Additional training and educational opportunities provide necessary skills for this broader role. Change, continuous improve-ment, and learning are encouraged. Ideally, all orga-nizational members should be motivated to improve the status quo. The core idea is to create an environ-ment for the efficient flow of information and con-tinuous improvement by emphasizing integration, prevention and empowerment. Thus, we test the following hypothesis:
H3. Companies that focus on soft maintenance
inte-gration are more likely to achieve high operational performance than companies that do not.
2.4. Contextual factors and operational performance of maintenance
Various maintenance approaches are most likely to lead to high operational performance in different contexts. Here, contexts are described in terms of production process, industry, size and breakdown consequences.
In project or jobbing processes, redundancies and flexibility are built in. Machines are often idle and working hours flexible. In continuous processing, full standbys are rare and usually productive capacity is lost, but since some redundancies and inventories exist, it may be possible to survive breakdowns without preventive and optimized maintenance. The situation is more problematic for firms using hybrid batch processing to achieve both scale and scope economies. There, most machines are bottlenecks, inventory levels are minimized and delivery tight.
Ž
Studies of manufacturing strategy taxonomies e.g.
.
Ward et al., 1995 have shown correlation between manufacturing strategy groups and type of industry. None of these studies dealt with maintenance and integration, but industries are linked to production process choice and consequently also to mainte-nance.
Large firms may have more hierarchical, formal-ized and complex organizational structures than small firms. This would favor hard maintenance integration approaches, rather than soft. On the other hand, small firms probably favor jobbing processes and to a lesser extent line or continuous processes. This would lead overall to less need for preventive and company-wide integrated maintenance in small firms. There are two aspects of breakdown conse-quences; stoppage costs and environmental risks. Positive correlation is expected between the severity of stoppage costs and degree of preventive and inte-grated maintenance. Breakdowns also create safety and environmental risks, causing direct and indirect losses. Maintenance could reduce this. Risks are difficult to measure and are therefore sometimes omitted. If they are serious they still lead to in-creased maintenance, though. Thus, we test:
H4. The effect of maintenance approaches on
opera-tional performance differs between contexts
3. Methodology and measures
3.1. The sample
To estimate the non-respondent bias the reasons given for not answering the questionnaire were ana-lyzed, and respondents and non-respondents were
Ž
compared regarding contextual factors industry
.
members and company size . Altogether 210 non-re-spondents were followed up by telephone calls. 39 firms had no manufacturing and another 30 said they were not interested in answering. 40 telephone inter-views were carried out, but 101 non-respondents said that they were still thinking about answering the questionnaire, but did not want to answer by phone. The total number of relevant answers was 253, which corresponds to a response rate of 36%. Chi-square tests did not reveal any significantly different
re-Ž .
sponse rate p-0.05 between industries or be-tween firms of different sizes.
3.2. The measurement instrument
The study contained measures on theAkey main-tenance dimensionsB, Acontextual factorsB and Aoperational performanceB. The empirical
mainte-nance taxonomy was based on the three maintemainte-nance
Ž .
variables; preventive maintenance PMAIN , hard
Ž .
maintenance integration HMAIN , and soft
mainte-Ž .
nance integration SMAIN , that correspond to the main areas of literature review in Sections 2.2–2.4. Table 1 shows the average, standard deviation, mini-mum and maximini-mum for each measure.
Preventive maintenance is a mix of several
poli-Ž
cies and activities here defined as strategic mainte-nance planning, condition-based maintemainte-nance, and
.
other preventive policies . The respondents were asked to provide quantitative data for the number of hours spent on strategic maintenance planning, con-dition-based maintenance, other preventive mainte-nance policies and corrective maintemainte-nance activities
Žperformed by anyone within the organization, for
example maintenance, production or management
.
personnel . The accumulated proportion spent on the three first approaches made up the PMAIN used in
Ž .
the present analysis see Appendix A . There is always a possibility that the respondents forget to consider, or are not aware of, some preventive
main-Table 1
Descriptive data for measures used
Measure Average Std. Dev. Min. Max.
Ž .
Preventive maintenance PMAIN 51.45 23.97 1 5
Ž .
Hard maintenance integration HMAIN 1.71 1.05 1 4
Ž .
Soft maintenance integration SMAIN 3.61 0.81 1 5
Maintenance techniques
Condition monitoring 0.16 0.47 0 2
Five human senses 0.50 0.74 0 2
Maintenance optimization 0.08 0.32 0 2
Annual service 0.38 0.64 0 2
Other preventive approaches 0.95 0.83 0 2
Corrective maintenance 0.85 0.91 0 2
Breakdown consequences 2.11 1.56 1 6
Stop costs Median:
1500–8000 USDrh
Return on sales 11.63 10.12 1 40
Improvement programs 3.98 1.03 1 5
Manufacturing strategy
Defect raterproduct performance 4.28 1.36 1 6
Fastrdependable delivery 3.85 1.48 1 6
Rapid product change 3.19 1.55 1 6
Rapid volumerset-up change 4.30 1.38 1 6
Production costs 4.97 1.16 1 6
tenance activities when estimating the overall hours of prevention in an organization. The predictive reli-ability of PMAIN was tested by measuring the corre-lation between PMAIN and the perceived importance of condition monitoring techniques, the five human senses, maintenance optimization, annual service,
Ž .
other preventive approaches inspection , and
correc-Ž .
tive maintenance measures see Appendix A . PMAIN was significantly positively correlated with maintenance optimization, annual service and other preventive maintenance techniques, and significantly negatively correlated with corrective maintenance
ŽTable 2 . The correlations with condition monitor-. Ž
ing and the five human senses which are heavily
.
emphasized in TPM were not significant. A reason for this should be that few companies had imple-mented these approaches. The test for predictive reliability showed that PMAIN measures several as-pects of prevention, but it could still be somewhat biased because of lack of knowledge of the respon-dent. Another limitation of the measure, however, was that hours do not provide any indication of the effectiveness of a preventive maintenance program. Many hours spent on designing or carrying out a poorly designed program may not be effective.
HMAIN was measured asAthe perceived level of computerization of the maintenance management
in-Ž .
formation systemB see Appendix A . This was also a subjective measure, one which was easy to under-stand and estimate. More detailed measures, such as estimating the level of computerized communication of maintenance data between functions and pro-cesses, were not used, because of the expected dif-ferences between industries. More detailed measures could, however, have tracked other supportive tech-nologies than information systems. A limitation of the measure was that it only gave high rating to companies with comprehensive information systems.
Such systems were most common in large companies
ŽBi-variate correlation between HMAIN and SIZE is .
statistically significant at the p-0.01 level . Invest-ment in information systems, however, is considered the most important approach to hard integration. Consequently, the bias of the measure towards large companies was expected, and should not be a prob-lem in the analysis.
SMAIN was measured in terms of high commit-ment to maintenance issues, high overall status of maintenance, high overall maintenance knowledge in the production department, and a high degree of maintenance improvement and disruption decreasing programs implemented in the production department. SMAIN was a six-point Likert summated scale based
Ž
on four individual measures Aperceived commit-ment to maintenance in the production departcommit-mentB, Aperceived status of maintenance within the organi-zationB, Aperceived level of knowledge about main-tenance within the production departmentBandAlevel of maintenance process improvement and disruption
.
decreasing programsB. The measure is presented in Appendix A. Cronbach’s coefficient alpha is the most widely used measure for testing inter-item
reli-Ž
ability when using summated scales Sakakibara et
.
al., 1993 . The alpha of SMAIN was 0.70, thus the measure was considered internally reliable.
The inter-rater reliability was not tested because the questionnaire was considered too specific to be answered by anyone other than the maintenance manager. The content validity of the measures were secured since they were all based on extensive litera-ture review and pre-tested before being sent out. No measure, however, had been used in previous studies and should be further developed. The construct valid-ity of SMAIN was tested in factor analysis by princi-pal components. The scales loaded on a single factor with Eigenvalue of 2.2, and all factor loadings were
Table 2
Bi-variate correlation between PMAIN and maintenance techniques
Condition Five human Maintenance Annual Other Corrective
monitoring senses optimization service preventive maintenance
) ) ) ) ) ) )
PMAIN 0.11 0.07 0.14 0.17 0.21 y0.43
)Significant at the p-0.05 level.
in the 0.6 to 0.8 range, indicating that the measure was valid. It is, however, more relevant to consider the measure to be an index rather than a construct.
The maintenance context, which was compared between configurations, was measured in terms of production process, industry, number of employees,
Ž .
turnover in USD US Dollars , breakdown
conse-Ž
quences six-point Likert scale from minor to very
.
serious , stop costs in USD, and maintenance related time spent on strategic planning, prevention, on-con-dition and corrective maintenance.
Operational performance was mainly measured
Ž .
using the return on sales ROS . It is an objective measure and was, therefore, difficult to compare between industries, or within industries competing on various markets. It is, however, still an aggre-gated measure of overall business performance. To measure the level of investment in quality and flexi-bility, two other measures were included. The level of investment in quality improvement programs was
Ž
estimated through a five-point semantic scale see
.
Appendix A . The perceived importance of quality, flexibility and other manufacturing capabilities were
Ž
measured on six point Likert scales from not
impor-.
tant to absolutely critical in the last Aperformance measureB.
4. Findings
There exist very few typologies of maintenance in literature and we could not find any complete
empir-Ž .
ically based classifications taxonomy . The analysis presented here addresses this lack of maintenance taxonomy. The analyses and findings are presented in several steps. First, an empirical taxonomy of maintenance configurations was identified. Then contextual, maintenance, and operational perfor-mance factors were compared between the groups of companies.
The scales gave both parametric and non-paramet-ric data. Therefore, different statistical techniques
Ž
were used in the analysis. F-tests ANOVA and
.
Scheffe’s pairwise comparison were carried out when the data is presented in interval scales. Mean
Ž
rank tests Kruskal–Wallis and Wilcoxon–Mann–
.
Whitney were used when the data was on the
ordinal level. Chi-square tests were used when the data was collected on a nominal scale.
4.1. The maintenance taxonomy
Cluster analysis was employed to identify the maintenance types from the variables SMAIN, HMAIN and PMAIN. The variables contained
differ-Ž .
ent scales four-, five- and six-point Likert scales and they were therefore standardized in the range between 0 and 1 before entry into the statistical analyses.
Ward’s minimum variance cluster method was used to identify outliers and form appropriate num-bers of clusters. There are several rules of thumb when finding an appropriate number of clusters. However, the most appropriate rule is to focus on the pronounced increase in the tightness of the clusters.
Ž .
Small changes of the clustering agglomeration co-efficient when conducting hierarchical cluster analy-sis indicate that fairly homogeneous clusters are being merged, while joining two very different clus-ters resulted in a large percentage change in the
Ž .
coefficient Hair et al., 1998 . For our data, the change from two to three clusters resulted in a 53.9% change and the change from three to four clusters a 21.0% change. Thus, the three-cluster model was chosen. Non-hierarchical cluster analysis with seed points from the hierarchical results were used to fine-tune the results and present the final clusters, resulting in somewhat adjusted group members and cluster centers. To check the stability of the cluster solution, a second non-hierarchical analysis was per-formed, this time allowing the procedure to collect seed points at random. The cluster sizes were compa-rable and the final cluster solution is therefore con-sidered consistent.
The final clusters should be distinct from each other and easy to interpret. We compared the cluster-ing variables by group means uscluster-ing one-way ANOVA tests. Scheffe’s pairwise comparison test was used to identify significant differences between individual pairs of groups on each of the three individual variables. Both tests indicated significant differences between the groups, indicating that the groups were
Ž .
distinct from each other Table 3 .
Table 3
Clusters and maintenance variables
Variables Clusters Statistics
Ž .1 Maintenance Ž .2 IT Maintainers Ž .3 Proactive
Ž . Ž . Ž .
Laggers ns123 ns53 Maintainers ns77
Ž . Ž . Ž .
Mean Std. Dev. Mean Std. Dev. Mean Std. Dev.
Ž .w x Ž .w x Ž .w x
Soft maintenance 3.37 0.72 2,3 3.76 0.81 1 3.92 0.72 1 Fs13.90, p-0.0001
Ž .w x Ž .w x Ž .w x
Hard maintenance 1.23 0.48 2 3.55 0.50 1,3 1.36 0.65 2 Fs372.42, p-0.0001
Ž .w x Ž .w x Ž .w x
Preventive 2.41 0.71 2,3 3.34 1.18 1,3 4.48 0.50 1,2 Fs165.74, p-0.0001
maintenance
Ž .
Note: Means and standard deviations are based on different scales. All measures were standardized ranging from 0 to 1 before entry into the cluster analyses. F-statistics are derived from one-way ANOVAs. All variables are significantly different at the p-0.01 level.
w x
Scheffe’s pairwise test of means was used for identifying pairwise differences. Numbers in brackets indicate the group numbers from which this group is significantly different at the p-0.05 level.
and AProactive MaintainersB. A short interpretation of the meaning of the groups is given below.
Cluster 1 — Maintenance Laggers: The first clus-ter contained almost half of the surveyed companies
Žns123 . It was named. AMaintenance LaggersB because it showed lower means on all clustering variables compared to both the other groups. The
Ž
soft issues commitment, status, knowledge and
con-.
tinuous improvement of maintenance were empha-sized on a medium level, which was significantly less than for both the other groups. The maintenance
Ž .
management information system MMIS was man-ual and separated from the rest of the organization. The relative use of preventive policies was signifi-cantly lower than in the other groups and is, there-fore, the most reactive cluster.
Cluster 2 — IT Maintainers: This was the
small-Ž .
est group ns53 , yet had the highest use of
com-puterized and integrated information systems for maintenance. It emphasized soft maintenance issues and preventive policies to medium levels, which was more than for the Amaintenance laggersB, but less than for theApreventive maintainersB.
Cluster 3 — Proactive Maintainers: The third group of companies focused on preventive mainte-nance policies and was also quite strong on the soft issues. The hard issues, however, were as under-de-veloped similar to theAMaintenance LaggersB.
It was interesting to note that no cluster empha-sized all three variables to a great extent. The AIT MaintainersB emphasized all variables on at least medium level. The AProactive MaintainersB empha-sized SMAIN on a medium level and HMAIN on a low level. The AMaintenance LaggersB emphasized all variables to low or medium extents. Therefore, we posit the existence of a theoretical fourth group
ŽWorld Class Maintainers? to Fig. 3, one which is. Ž
strong on all three dimensions the group was not
.
included in the empirical analysis .
Such a theoretical group should exist, because process stability and preventive maintenance are im-portant when shortening through-put times and de-creasing tied-up capital in industry. Extensive pre-ventive maintenance can hardly be applied without simultaneous emphasis on human, organizational and IT integration, which are the characteristics of the theoretical fourth group.
4.2. Contextual and maintenance factors
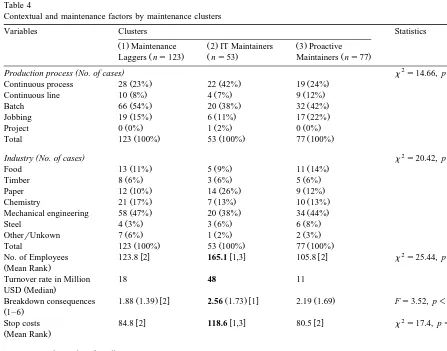
The next step of the analysis contained the identi-fication of contextual similarities and differences between the clustered configurations. It was conceiv-able that the need for proactive policies and comput-erized and company-wide integrated information sys-tems for maintenance was more critical in large companies with continuous mass production pro-cesses and high costs for disruption, than in smaller ones with batch or job-oriented processes. Table 4
Table 4
Contextual and maintenance factors by maintenance clusters
Variables Clusters Statistics
Ž .1 Maintenance Ž .2 IT Maintainers Ž .3 Proactive
Ž . Ž . Ž .
Laggers ns123 ns53 Maintainers ns77
2
( )
Production process No. of cases x s14.66, ps0.066
Ž . Ž . Ž .
Continuous process 28 23% 22 42% 19 24%
Ž . Ž . Ž .
Continuous line 10 8% 4 7% 9 12%
Ž . Ž . Ž .
Batch 66 54% 20 38% 32 42%
Ž . Ž . Ž .
Jobbing 19 15% 6 11% 17 22%
Ž . Ž . Ž .
Project 0 0% 1 2% 0 0%
Ž . Ž . Ž .
Total 123 100% 53 100% 77 100%
2
( )
Industry No. of cases x s20.42, ps0.202
Ž . Ž . Ž .
Food 13 11% 5 9% 11 14%
Ž . Ž . Ž .
Timber 8 6% 3 6% 5 6%
Ž . Ž . Ž .
Paper 12 10% 14 26% 9 12%
Ž . Ž . Ž .
Chemistry 21 17% 7 13% 10 13%
Ž . Ž . Ž .
Mechanical engineering 58 47% 20 38% 34 44%
Ž . Ž . Ž .
Steel 4 3% 3 6% 6 8%
Ž . Ž . Ž .
OtherrUnkown 7 6% 1 2% 2 3%
Ž . Ž . Ž .
Total 123 100% 53 100% 77 100%
2
w x w x w x
No. of Employees 123.8 2 165.1 1,3 105.8 2 x s25.44, p-0.0001
ŽMean Rank.
Turnover rate in Million 18 48 11
Ž .
USD Median
Ž .w x Ž .w x Ž .
Breakdown consequences 1.88 1.39 2 2.56 1.73 1 2.19 1.69 Fs3.52, p-0.04
Ž1–6.
2
w x w x w x
Stop costs 84.8 2 118.6 1,3 80.5 2 x s17.4, ps0.002
ŽMean Rank.
( )
Maintenance hours % of total
w x w x w x
Strategic Planning 6.9 3 8.9 3 14.1 1,2 Fs15.87, p-0.0001
w x w x w x
Prevention 21.2 2,3 32.3 1,3 48.5 1,2 Fs65.11, p-0.0001
w x w x
On-condition 7.7 3 11.2 12.4 1 Fs6.80, p-0.001
w x w x w x
Correction 64.0 2,3 47.2 1,3 24.9 1,2 Fs125.66, p-0.0001
Note: Some of the tests are based on less than 253 cases, due to missing data.x2 and F-statistics and associated p-values are derived from Chi-square, Kruskal–Wallis and one-way ANOVA tests. Wilcoxon–Mann–Whitney and Scheffe’s tests of means were used for identifying
w x
compares contextual and maintenance factors in terms of production process, industry, number of employ-ees, turnover rate, breakdown consequences, stop costs, and maintenance time spent on various poli-cies, between the three clustered groups.
The groups did not differ in terms of production process or industry membership, but the companies in the AIT MaintainersB group were significantly larger and had significantly higher breakdown costs compared to both the other groups. Despite the high breakdown costs, theAIT MaintainersBspent signifi-cantly less time on preventive policies than theA Pro-active MaintainersB. Almost half of their mainte-nance related time was spent on corrective activities, and eventhough it was difficult to state how much time should be spent on various policies, this figure seemed quite high. A rule of thumb presented by
Ž . Ž .
Wireman 1990 and Tomlingson 1993 , for exam-ple, indicated that no more than 40% of the mainte-nance related man hours should be spent on correc-tion in an average manufacturing plant.
4.3. Operational performance
The literature review and hypotheses in Section 2 on Aa maintenance management frameworkB indi-cated that the maintenance variables; SMAIN,
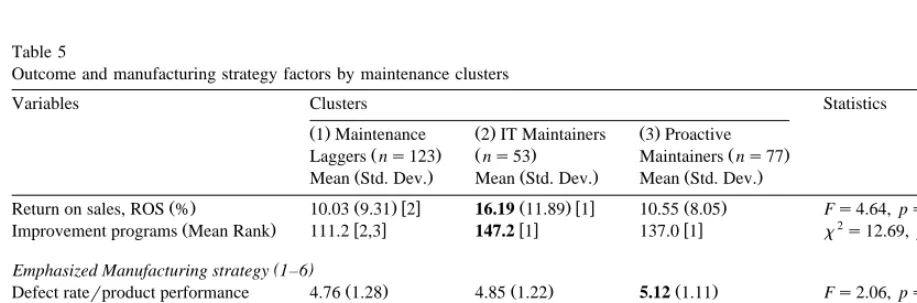
HMAIN and PMAIN were important for achieving high performance. Consequently, the two groups of companies with high or medium emphasis on one or several of the variables could be expected to perform better than the AMaintenance LaggersB group with the lowest relative emphasis on all variables. The three measures of operational performance, i.e. re-turn on sales, improvement programs, and manu-facturing capabilities, were compared between the configurations. Table 5 shows the results of the analyses.
AIT MaintainersB have the highest profitability
Žreturn on sales of all groups, which is significantly.
higher than the AMaintenance LaggersB on the p -0.02 level, or on the p-0.06 level compared to the AProactive MaintainersB. It is interesting to note the difference in profitability between AIT MaintainersB and AProactive MaintainersB. The former group is more profitable, eventhough they spent a relatively large proportion of time on corrective policies. Per-haps their emphasis on information technology and integration helped them to base the maintenance decisions on proper data and facts, resulting in more efficient and effective maintenance activities. The fact that the companies in the AIT MaintainersB group were larger than the other two groups may also have been a cause for higher profitability.
An-Table 5
Outcome and manufacturing strategy factors by maintenance clusters
Variables Clusters Statistics
Ž .1 Maintenance Ž .2 IT Maintainers Ž .3 Proactive
Ž . Ž . Ž .
Laggers ns123 ns53 Maintainers ns77
Ž . Ž . Ž .
Mean Std. Dev. Mean Std. Dev. Mean Std. Dev.
Ž . Ž .w x Ž .w x Ž .
Return on sales, ROS % 10.03 9.31 2 16.19 11.89 1 10.55 8.05 Fs4.64, ps0.01
2
Ž . w x w x w x
Improvement programs Mean Rank 111.2 2,3 147.2 1 137.0 1 x s12.69, ps0.02
( )
Emphasized Manufacturing strategy 1–6
Ž . Ž . Ž .
Defect raterproduct performance 4.76 1.28 4.85 1.22 5.12 1.11 Fs2.06, ps0.13
Ž .w x Ž . Ž .w x
Fastrdependable delivery 4.12 1.27 3 4.30 1.61 4.77 1.17 1 Fs5.80, p-0.01
Ž .w x Ž . Ž .w x
Rapid product change 3.68 1.48 3 3.81 1.58 4.22 1.37 1 Fs3.21, p-0.05
Ž .w x Ž . Ž .w x
Rapid vol.rset-up change 2.88 1.50 3 3.45 1.57 3.59 1.50 1 Fs5.72, p-0.01
Ž . Ž . Ž .
Production costs 4.83 1.26 5.25 0.88 4.96 1.19 Fs2.30, ps0.10
Ž . Ž . Ž .
Tied up Capital 4.16 1.39 4.69 1.25 4.30 1.32 Fs2.89, ps0.06
Note: Some of the tests are based on less than 253 cases due to missing data.x2, F statistics and associated p-values were derived from Kruskal–Wallis and one-way ANOVAs. Wilcoxon–Mann–Whitney and Scheffe’s test of means were used for identifying pairwise
w x
other explanation to the subtle profitability differ-ences could be that the measure of profitability is a single objective measure, which was difficult to compare between companies competing in various markets.
When it came to more indirect performance vari-ables, such as the establishment of quality and pro-cess improvement programs, and an emphasis on multiple manufacturing capabilities, the pattern was somewhat different and more synchronized with the hypotheses and our expectations. Here, we could not identify any significant difference between AIT MaintainersB and AProactive MaintainersB, but the AMaintenance LaggersB emphasized improvement programs and the manufacturing capabilities to a
Ž
lesser extent than the two other groups however, all
.
the differences are not significant . Production costs
Žcosts and defect rates quality were the two most. Ž .
important capabilities, while rapid product change
Ž .
and rapid volumerset-up change flexibility are the two least important capabilities for all groups. The AProactive MaintainersB showed the highest mean values for the quality, fast and dependable delivery
Ždelivery , and flexibility variables. They were sig-.
nificantly higher than those for the AMaintenance LaggersB. Consequently, process control and flexibil-ity seemed to be more important for companies with preventive maintenance policies, than for those rely-ing on more corrective policies.
5. Conclusions and comments
Although the impact of maintenance on the per-formances of manufacturing companies may be con-siderable, maintenance strategy has not yet received full attention in practice or in research. The findings of the current paper provide a framework for under-standing the role of preventive and integrated main-tenance, and for further research on the link between maintenance and performance. It indicates that main-tenance prevention and integration are important for the manufacturing strategy of a company, but that the mix of prevention and integration could differ between contexts. Those consultants and researchers that have promoted benefits of maintenance often fail to identify contextual issues that may make adoption difficult or ineffective. It is important that
managers do not consider specific maintenance prac-tices to be appropriate for all situations.
In the current paper, manufacturing companies were clustered into three configurations, based on their emphases on preventive maintenance, hard maintenance integration and soft maintenance inte-gration. The identified taxonomy showed that there was a variety of maintenance investment approaches and that each configuration could be profitable by itself.
Further analysis revealed that preventive and company-wide integrated maintenance were impor-tant for companies, with high breakdown conse-quences and stop costs, which seek competitive pro-cess control and flexibility. It was proposed that maintenance should be most important in lean manu-facturing organizations with AstreamlinedB pro-cesses, but this should be further researched.
Profitability was highest for the group with heavy
Ž
investments in information technology hard
inte-.
maintenance variables and dependent operational performance variables, could then be employed.
Another finding was that none of the clusters contained companies that simultaneously emphasized all three dimensions to any great extent. Therefore, it is interesting to analyze whether a high emphasis on all dimensions necessarily relates to increased effec-tiveness. This question could be studied in a broad based study, similar to the one conducted in this paper, but that focuses on companies in heavy indus-tries with serious breakdown consequences and high
Ž
stop costs i.e. companies that need preventive and
.
integrated maintenance .
The measures used have some drawbacks and need to be further developed in future research. All measures could be more detailed and expressed as multiple scales. This is especially true for HMAIN, which could cover other aspects than the information system. PMAIN focuses purely on hours spent on policies, but does not tell how well policies are carried out. SMAIN covers various aspects of soft integration. It could be extended and split into a set of related scales.
A. Measure listing
( )
A.1. PreÕentiÕe Maintenance PMAIN
Estimate the proportion of maintenance related
Ž .
time man-hours spent on strategic planning, on-condition, planned preventive activities or corrective
Ž
activities Please, distribute 100% of the
mainte-.
nance time .
w xA Planning, strategy and tactical issues %
w xB Planned preventive maintenance %
w xC Condition monitoring %
w xD Corrective maintenance %
Note: PMAIN measures the accumulated propor-tion of time spent onAPlanning, strategy and tactical issuesB, APlanned preventive maintenanceB and
Ž .
ACondition monitoringB on a five-point scale 1 A0 –20% of the total time spent on alternatives A, B
Ž .
and CB; 2 A81 –100% of the total time spent on alternatives A, B and CB.
( )
A.2. Hard Maintenance Integration HMAIN
Which are the characteristics of your Maintenance
Ž
Management Information System? Please, mark one
.
alternative .
1. None, or manual system
2. Partly computerized system operated from a sepa-rate computer system and network
3. Fully computerized system operated from a sepa-rate computer and network
4. Fully computerized system integrated into the overall Management Information System
Note: HMAIN is on ordinal level, but included in the cluster analysis as interval scaled.
( )
A.3. Soft Maintenance Integration SMAIN — Six-point summated Likert scales
w xA Estimate the level of commitment to
mainte-Ž
nance issues in the production department from
.
Avery lowBtoAvery highB
w xB Estimate the perceived status of maintenance
Ž
within the organization fromAvery lowBtoAvery
.
highB
w xC Estimate the level of general maintenance
Ž
knowledge within the production department from Aonly maintenance department has knowledgeB to Athe entire production department has very good
.
knowledge and understanding of maintenanceB w xD Estimate the existence of maintenance process
Ž
improvement programs fromAno activity has been carried out for several yearsBtoAprocess improve-ment has for several years had a central role in
.
maintenance. All employees are involvedB
A.4. ImproÕement Programs
AHow do you work with process and quality
Ž
improvement programs? Please, mark one
alterna-.
tive B
w xII Quality improvement activities have received increased importance, but are still scarce.
wIII Some employees work with quality improve-x
ment issues.
wIV Continuous quality improvement activities arex
important parts of the corporate strategy-several employees participate.
w xV Quality has a central role in the organization-improvement programs have for several years been important for continuously improving production and maintenance-all employees participate.
A.5. Maintenance Techniques
AWhich are the most important Amaintenance
Ž
techniquesB in your company? Mark the most im-portant with A1B and the second most important
.
withA2B B
w xA Condition monitoring, based on technology
Žvibration, termography, tribology, process con-.
trol, ultrasonic sound, etc.
w xB Condition monitoring based on human senses
Žeyesight, hearing, feeling, smelling, tasting.
w xC Failure and reliability based optimization
w xD Annual service
w xE Other scheduled preventive maintenance
Žscheduled inspection, etc..
w xF Corrective maintenance
w xG Other approach
A.6. Manufacturing Strategy
AFor your manufacturing plant, to what extent do
Ž
you emphasize the following issues: Six-point Lik-ert scales fromAnot importantBtoAthe issue has had
.
highest priority during several yearsB B
w xA Defect raterproduct performance
w xB Fastrdependable delivery
w xC Rapid product change
w xD Rapid vol.rset-up change
w xE Production costs
w xF Tied up Capital
References
Ahlmann, H., 1998. Servicing and maintenance. In: Elfving, G.
ŽEd. , ABB Industrial Manual. ABB, Vasteras, Sweden, pp.. ¨ ˚ 1063–1116.
Boyer, K., Ward, P.T., Leong, K.G., 1996. Approaches to the factory of the future: an empirical taxonomy. Journal of
Ž .
Operations Management 14 4 , 297–313.
Boyer, K., Leong, K.G., Ward, P.T., Krajewski, L.J., 1997. Unlocking the potential of advanced manufacturing
technolo-Ž .
gies. Journal of Operations Management 15 4 , 331–347. Brulin, G., Nilsson, T., 1995. Laran om arbetets ekonomi: om¨
arbete och produktivitet i modern produktion. Tiden, Kris-tianstad, Sweden.
Bowen, D.E., 1992. Total quality-oriented human resources man-agement. Organizational Dynamics, 29–41.
Chase, R.B., Kumar, K.R., Youngdahl, W.E., 1992. Service-based manufacturing: the service factory. Production and Operations
Ž .
Management 1 1 , 175–184.
Chen, I.J., 1996. Planning for advanced manufacturing technol-ogy: a research framework. International Journal of Operations
Ž .
and Production Management 16 5 , 4–24.
Corbet, C., Wassenhove, L., 1993. Trade offs? What trade offs? competence and competitiveness in manufacturing strategy?
Ž .
California Management Review 35 4 , 107–122.
Davenport, T.H., 1990. The new industrial engineering: informa-tion technology and business process redesign. Sloan Manage-ment Review, 11–27.
De Jong, E., 1997. Maintenance practices in manufacturing SMEs,
ŽWorking paper, National Key Centre for Advanced Materials
.
Technology, Monash University, Australia .
De Smet, R., Gelders, L.F., Pintelon, L.M., 1997. Case studies on disturbance registration for continuous improvement. Journal
Ž .
of Quality in Maintenance Engineering 3 2 , 91–108. Dean, J.W, Bednar, D.A., 1994. Management theory and total
quality: improving research and practice through theory
devel-Ž .
opment. The Academy of Management Review 19 3 , 392– 418.
Dean, J.W., Yoon, S.J., Susman, G.I., 1992. Advanced manufac-turing technology and organization structure: empowerment or
Ž .
subordination? Organization Studies 3 2 , 203–229. Dekker, R., 1996. Applications of maintenance optimisation
mod-els: a review and analysis. Reliability Engineering and
Sys-Ž .
tems Safety 51 2 , 229–240.
Deming, W.E., 1986. Out of the Crisis. MIT Press, Cambridge, MA.
Ericsson, J., 1997. Storningsanalys av tillverkningssystem: ett¨
Ž
viktigt verktyg inom lean production, PhD Thesis Lund Uni-versity, Department of Production and Materials Engineering
.
Lund, Sweden .
Geraerds, W.M.J., 1992. The EUT maintenance model.
Interna-Ž .
tional Journal of Production Economics 24 2 , 209–216. Gits, C.W., 1992. Design of maintenance concepts. International
Ž .
Journal of Production Economics 24 2 , 217–226.
Hair, J.F., Anderson, R.E., Tatham, R.L., Black, W.C., 1998. Multivariate Data Analysis. Prentice-Hall, London.
Hill, T, 1993. Manufacturing Strategy: The Strategic Management of the Manufacturing function. MacMillan, London. Idhammar, B., 1992. Underhallets hornstenar-rationellt underhall˚ ¨ ˚
I. Idhammars Forlag, Sodertalje, Sweden.¨ ¨ ¨
Jonsson, P., 1997. The status of maintenance management in Swedish manufacturing firms. Journal of Quality in
Mainte-Ž .
nance Engineering 3 4 , 233–258.
Jonsson, P., 1999. Achieving the potential benefits of advanced manufacturing technology — a study of Swedish metal
work-Ž .
ing companies. In: Kocaoglu, D.F., Anderson, T.R. Eds. , Technology and Innovation Management, Section-18: Manu-facturing Management. Portland State University, OR, pp. 485–492.
Juran, J., 1989. Juran on Leadership for Quality. Free Press, NY. Kelly, A., 1997. Maintenance Strategy: Business-Centred
Mainte-nance. Butterworth-Heinemann, Oxford.
Labib, A.W., 1998. World-class maintenance using a computer-ized maintenance management system. Journal of Quality in
Ž .
Maintenance Engineering 4 1 , 66–75.
Likert, R., 1967. The Human Organization: Its Management and Value. McGraw-Hill, NY.
¨
Ljungberg, O., 1998. Measurement of OEE as a basis for TPM activities. International Journal of Operations and Production
Ž .
Management 18 5 , 495–507.
Maffei, M.J., Meredith, J., 1994. The organizational side of flexible manufacturing technology: guidelines for managers. International Journal of Operations and Production
Manage-Ž .
ment 14 8 , 17–34.
Maggard, B.N., Rhyne, D.M., 1992. Total productive mainte-nance: a timely integration of production and maintenance.
Ž .
Production and Inventory Management Journal 33 4 , 6–10. Martin, H., 1997. Contracting out maintenance and a plan for future research. Journal of Quality in Maintenance
Engineer-Ž .
ing 3 2 , 81–90.
McGregor, D., 1990. The Human Side of Enterprise. McGraw-Hill, NY.
McKone, K.E., Schroeder, R.G., Cua, K.O., 1999. Total produc-tive maintenance: a contextual view. Journal of Operations Management 17, 123–144.
Miller, J.G, Roth, V.R., 1994. A taxonomy of manufacturing
Ž .
strategies. Management Science 40 3 , 285–304.
Mobley, R.K., 1990. An Introduction to Predictive Maintenance. Van Nostrand Reinhold, NY.
Nakajima, S., 1988. Introduction to TPM. Productivity Press, Cambridge.
Nakajima, S., 1989. TPM Development Program-Implementing Total Productive Maintenance. Productivity Press, Portland. Ouchi, W., 1981. TheoryAZB. Addison-Wesley, Reading, MA.
Patterson, J.W., Fredendall, L.D., Kennedy, W.J., McGee, A., 1996. Adapting total productive maintenance to Asten.
Pro-Ž .
duction and Inventory Management Journal 37 4 , 32–37. Pintelon, L.M., Gelders, L.F., 1992. Maintenance management
decision making. European Journal of Operational Research 58, 301–317.
Pintelon, L., Du Preez, N., Van Puyvelde, F., 1999. Information technology: opportunities for maintenance management.
Jour-Ž .
nal of Quality in Maintenance Engineering 5 1 , 9–24. Raouf, A., 1994. Improving quality productivity through
mainte-nance. International Journal of Operations and Production
Ž .
Management 14 7 , 44–52.
Rodriguez, J.R., 1990. Total productive maintenance. In: The
Ž .
Ernst & Young Quality Improvement Consulting Group Ed. , Total Quality: A Manager’s Guide for the 1990s. Kogan Page, London, pp. 152–161.
Sakakibara, S., Flynn, B.B., Schroeder, R.G., 1993. A framework and measurement instrument for just-in-time manufacturing.
Ž .
Production and Operations Management 2 3 , 177–194. Sherwin, D.J., 1999. A Review of Past and Current Overall
Models for Maintenance Management. Working Paper, Vaxjo¨ ¨ University, Vaxjo, Sweden.¨ ¨
Sherwin, D.J., 1993. The Reliability, Availability and Productive-ness of Systems. Chapman & Hall, London.
Shirose, K., 1992. TPM for Workshop Leaders. Productivity Press, Cambridge, MA.
Smith, A., 1993. Reliability-Centered Maintenance. McGraw-Hill, NY.
Spencer, B.A., 1994. Models of organization and total quality management: a comparison and critical evaluation. The
Ž .
Academy of Management Review 19 3 , 446–471. Suzuki, T., 1992. New Directions for TPM. Productivity Press,
Cambridge, MA.
Sweeney, M., 1991. Towards a unified theory of strategic manu-facturing management. International Journal of Operations and
Ž .
Production Management 11 8 , 6–22.
Sweeney, M., 1993. Strategic manufacturing management: restruc-turing wasteful production to world class. Journal of General
Ž .
Management 18 3 , 57–76.
Tomlingson, P.D., 1993. Effective Maintenance: The Key to Profitability. Van Nostrand Reinhold, NY.
Waldman, D.A., 1994. The contributions of total quality manage-ment to a theory of work performance. The Academy of
Ž .
Management Review 19 3 , 510–536.
Ward, P.T., Duray, R., Leong, G.K., Sum, C., 1995. Business environment, operations strategy, and performance: an empiri-cal study of Singapore manufacturers. Journal of Operations
Ž .
Management 13 2 , 99–115.