METHODS
The Kyoto protocol and payments for tropical forest:
An interdisciplinary method for estimating carbon-offset
supply and increasing the feasibility of a carbon market
under the CDM
Alexander S.P. Pfaff
a,*, Suzi Kerr
b, R. Flint Hughes
c, Shuguang Liu
d,
G. Arturo Sanchez – Azofeifa
e, David Schimel
f, Joseph Tosi
g,
Vicente Watson
gaSchool of International and Public Affairs,Room1306,Columbia Uni
6ersity,420W.118th Street,New York,NY10027,USA bMotu Economic Research,New Zealand
cUni
6ersity of Colorado,USA dUSGS/EROS Data Center,USA
eUni6ersity of Alberta,Canada
fMax Planck Institute for Biogeochemistry,Germany gTropical Science Center,San Jose,Costa Rica
Received 27 December 1999; received in revised form 18 May 2221; accepted 18 May 2000
Abstract
Protecting tropical forests under the Clean Development Mechanism (CDM) could reduce the cost of emissions limitations set in Kyoto. However, while society must soon decide whether or not to use tropical forest-based offsets, evidence regarding tropical carbon sinks is sparse. This paper presents a general method for constructing an integrated model (based on detailed historical, remote sensing and field data) that can produce land-use and carbon baselines, predict carbon sequestration supply to a carbon-offsets market and also help to evaluate optimal market rules. Creating such integrated models requires close collaboration between social and natural scientists. Our project combines varied disciplinary expertise (in economics, ecology and geography) with local knowledge in order to create high-quality, empirically grounded, integrated models for Costa Rica. © 2000 Elsevier Science B.V. All rights reserved.
Keywords:Forest; Land use; Carbon; Sequestration; Global warming
www.elsevier.com/locate/ecolecon
* Corresponding author. Tel.: +1 – 212 – 8544190; fax:+1 – 212 – 8545765.
E-mail addresses: [email protected] (A.S.P. Pfaff), [email protected] (S. Kerr), [email protected] (R.F. Hughes), [email protected] (S. Liu), [email protected] (G.A. Sanchez – Azofeifa), [email protected] (D. Schimel), [email protected] (J. Tosi), [email protected] (V. Watson).
1. Introduction
With the rise in concern about potential global climate change, decision makers are actively explor-ing the possibility of usexplor-ing forests as a carbon sink. The tropics may offer over two-thirds of such
opportunities.1 In Kyoto, developed countries
agreed to limit their emissions to 5% (on average) below 1990 levels by the period 2008 – 2012. Meet-ing these commitments will require significant cost and changes in energy use. In response to this challenge, it has been suggested that initiatives to slow deforestation and to promote natural forest regeneration and forestation could offset 12 – 15% of global fossil fuel carbon emissions from 1995 to 2050.2
The creation of certified emissions reductions (CERs) under the Clean Development Mechanism (CDM) established in Kyoto could incorporate tropical sequestration within the effort to meet Kyoto emissions targets. That could lower the cost of implementing these limits, yielding economic and sequestration benefits. To this point, though, inte-grated assessment (IA) of the value of incorporating tropical sequestration has been based on limited case studies using inadequate data and analytical studies inadequately linked to data. Estimates of carbon sequestration have been costly, site specific or very inaccurate. In short, empirical evidence on the potential of tropical carbon sinks is sparse. Despite the lack of reliable information, however, the international community must make key deci-sions soon on whether and how to include tropical
sinks in the CDM. How 6aluable would carbon
sequestration really be?And can we create a credible, workable system to reward additional efforts to sequester carbon?
Answering these questions requires an integrated approach to assessing carbon policies, although one
founded on solid disciplinary analyses. The ulti-mate goal is integrated assessment, but first one needs economic analysis of how land use responds to economic factors, as well as ecological analysis of what that implies for carbon. This paper proposes a general approach to both performing and inte-grating state-of-the-art disciplinary analyses and applying the result to policy. We illustrate that approach using preliminary results from our ongo-ing project on Costa Rica.
Our work is comparable with current integrated
assessment (IA) simulation modeling.3
Much of that work is US-focused, but other, related inte-grated works that contain consideration of Costa Rica include Vine and Sathaye (1997), Hall (1998) and Helmer and Brown (1998). However, these works do not provide state-of-the-art approaches in both disciplines, while our project moves from the academic to the policy-relevant for all aspects of the integrated analysis.
How 6aluable would carbon sequestration really
be? Society does not know how much carbon
se-questration would be generated in response to any given monetary reward for carbon sequestration. That information gap can be addressed by coupling disciplinary components to yield one integrated output, an estimated supply (or cost) function for C sequestration (i.e. a functional relationship between the monetary C reward and the C sequestration supplied by land users). This function provides answers to policy questions about the effects of carbon payments, provides a basis for estimating the value (both to a given country and globally) of using carbon trading within efforts to limit carbon emissions and, in principle, also provides inputs to existing integrated assessment models. Fig. 1 sum-marizes the basic integration of the disciplinary analyses. Payments based on the carbon implica-tions then feed back into the economic factors.
Fig. 1. Simple integrated model structure.
3For instance, Moulton and Richards (1990) and Richards et al. (1993), the special issue on forestry and climate change of the journal Biomass and Bioenergy in 1995, Chapter 9 of 1996 IPCC Report and Stavins (1999).
The economic building block should start with excellent data on actual land use and land cover, as well as on the factors that are expected to affect land-use choices. Many early analyses of land use were cross-country analyses limited by data
availability.4Recently, economists have been able
to use expanded data sets on important factors by working within particular countries.5The inference from this data must also be of high quality if it is to yield a useful map from key factors to land-use choices. Our analyses of Costa Rica provide a nice illustration on both fronts. The existing databases (including high-quality remote sensing data) rival those for any tropical country and we are extending them, in particular with land-cover data, further back in time and better data on the returns to land uses. Then, working from this solid base of data, we are both applying and extending the state-of-the-art in economic, observation-based modeling of land use.
The ecological side should start with credible measures of carbon in forest ecosystems. No matter how sophisticated one’s modeling efforts, ulti-mately there is no substitute for accurate data inputs. Then, as in the economic analysis, the modeling must also be of high quality if it is to yield a useful map from land use and land cover to carbon-storage outcomes. Our project again pro-vides a nice illustration on both fronts. We are starting with systematic and comprehensive mea-surement of above ground and soil C present within Costa Rican forests, ranging from tropical wet to tropical dry life zones. We are also quantifying C pools along land-use gradients that exist within life zones to provide measures of C dynamics in re-sponse to land-use change throughout Costa Rica. We then use this data to calibrate and verify both process-based and empirically-based ecological models of varying theoretical approach and com-plexity.
Can we create a credible, workable system to reward additional efforts to sequester C?A carbon market that functions well enough to permit C sequestration efforts in tropical locations to replace
emissions-reduction efforts, elsewhere, involves real challenges. For example, for a C market to function, there need to exist credible international rules determining carbon-sequestration baselines (i.e. what would occur if no policy initiatives take place); only then can society reward only the car-bon sequestration over and above baseline, so that emissions can be allowed to rise correspondingly in other countries while maintaining those latter
countries’ agreed net emissions.6 The coupled
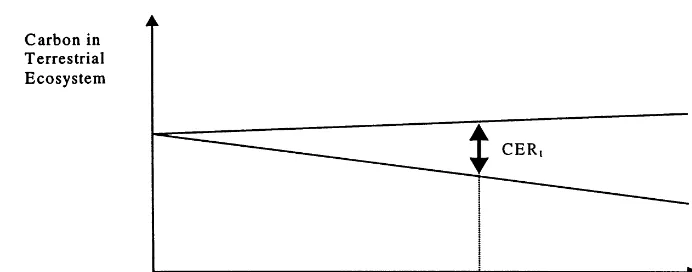
analyses described above provide the information for such baselines; the economic analysis projects the outcomes in various (counterfactual) scenarios and the ecological models translate the land-use outcomes into carbon storage. Applying the carbon storage estimates to both the baseline projection and the observed land use given actual carbon payments then determines the number of CERs to award — as in Fig. 2, where CERs are defined relative to a baseline. Our project estimates CER supply for relevant Costa Rican scenarios.
However, in creating any such carbon market, society must choose which land-use and ecological rules (or model estimates) should underlie the mar-ket. One issue is that both the accuracy of the rules defining CERs and the cost of applying those rules will affect the carbon-sequestration and economic impacts of C trading. Greater accuracy helps to guarantee that the envisioned sequestration out-comes will come about and improves the efficiency of sequestration efforts. However, greater accuracy may involve the use of more complex models and thus more complex rules, a greater scope for manip-ulation and higher costs of participation in C trading; this would yield less participation and thus less efficient implementation of Kyoto. For both the economic and the ecological analyses, we ask whether simpler models, easier to produce and use than the state-of-the-art, can retain sufficient accu-racy while lowering participation costs.
Thus, the best rules for an actual CER system may not be the scientifically most accurate possible
6Within the many ongoing efforts to consider carbon mar-kets, baselines constantly arise as a thorny issue. See the discussion within any number of such works: Dudek and Wiener (1996), Carter (1997), Hagler Bailly (1998), Lile et al. (1998), Pape and Rich (1998), Puhl (1998), Dixon (1999), Lazarus et al. (1999) and various A. Michaelowa papers. 4Two such examples are Lugo et al. (1981) and Allen and
Barnes (1985).
Fig. 2. Definition of certified emission reduction (CER).
rules. In order to address this tradeoff between the accuracy and costs of carbon-market rules, our project is carrying out sensitivity analyses on the final land-use and carbon outcomes in Costa Rica that result from varying the sophistication (accu-racy and cost) of the market rules.
Such integrated analysis for Costa Rica offers useful perspectives for considering these global questions. First, the great availability of data for Costa Rica should permit not only the greatest possible local accuracy, but also some ability to generalize the results (which makes them of in-creased interest as inputs to IA models). Second, Costa Rica is both economically and ecologically a great case study for learning, given not only its existing data sets but also the variation in ecolog-ical conditions, its small size and export
orienta-tion, and the various stages of economic
development Costa Rica experienced during the time period that we are studying.
In sum, for analytically considering these carbon policy questions, society requires an integrated analysis. Our project is generating a high-quality, integrated, spatially explicit model for Costa Rica, in order to both facilitate future analysis and demonstrate a new integrated methodology. Our sensitivity analysis of simpler rules is a search for a sufficiently accurate CER rule that is not too cumbersome for use in C markets. If this sort of analysis cannot produce a workable and credible rule, society will not be able to reap the potential of tropical forest C sinks.
The rest of the paper considers the methods for addressing the two questions highlighted above. We consider ecological and economic modeling in Section 2 and both data needs and our approaches to data collection in Section 3. Section 4 presents integration of the disciplinary modeling, and appli-cation to relevant policy scenarios (in particular, to both a baseline scenario and to the most relevant carbon-payments scenarios). Then we consider sensitivity analysis on the models, i.e. a search for simpler versions of integrated outputs that retain accuracy, but are easier and cheaper to use. In each section we offer a concrete example of the sug-gested approach from our ongoing analysis of Costa Rica.
2. Economic and ecosystem modeling
Two sorts of models are required. First, we must be able to translate policies into the land-use paths they cause. Second, in order to link policy changes to changes in carbon sequestration, we must be able to translate these induced changes in land use into changes in carbon storage.
returns. On the ecological side, we apply ad-vanced process models of C storage, in particular the CENTURY model, to simulate C dynamics in dominant ecosystems of Costa Rica. We also apply empirical models of C storage, in particu-lar both the current state-of-the-art of and ad-vances on Life Zone-type modeling of C storage in mature forests, across a wide range of ecologi-cal conditions.
2.1. Economic modeling of land use
Our goal is a map from exogenous physical and economic factors to predictions of land use. Our approach is statistical analysis of observed land-use choices guided by economic theory and the particular context. Such analysis is
increas-ingly common in the economics literature.7 This
is not so within multi-disciplinary integrated as-sessment (IA) modeling. The ‘engineering’ mod-els of land use that are typical of IA, share the starting point of economic modeling, i.e. that
people make individually rational land-use
choices. However, they assume that people be-have precisely according to the modeler’s view of how choices are made, imposing a very specific
structure on land-use decision making.8
If their specific assumptions about how decisions are made do not capture all aspects of actual deci-sion making, estimates may not explain current behavior well, let alone predict future responses. Further, such a divergence between model and reality must be expected, as no model could pos-sibly contain all the information available to the
land users themselves.9
Our use of observations of actual land use and factors affecting different returns to land uses permits analysis of actual rather than hypothetical behavior. Formal mod-eling of economic choices suggests in an orga-nized way what factors need to be observed for effective empirical analysis, as well as how statis-tical analyses could reveal their effects.
In a theoretical economic model of land use, a landowner solves a dynamic optimization prob-lem to choose the best use for each plot at each point in time. Landowners choose the land-use path with greatest returns. Returns depend on land characteristics, current and past land use, prices and yields of different crops, costs of pro-duction and access to markets, costs of changing land uses and expected future values of these factors. The owner’s problem features uncertain future returns, credit constraints, insecure tenure, limited information, and irreversible actions.
While a perfect empirical model would exactly predict the land choices at each point in time, in reality we don’t observe all factors affecting landowners (including their perceptions). Thus,
from our theoretical model we derive empirical/
econometric models, focusing on properly esti-mating the effects of observable factors while allowing for unknown effects of factors that af-fect land use, but for which we lack information. All of the factors’ coefficients are estimated from the observed data with standard error provided; we test our assumed error structure also.
We use both a traditional panel approach (Stavins and Jaffe, 1990) and a more dynamic
7See, e.g. Stavins and Jaffe (1990), Pfaff (1995) and Pfaff (1999), Chomitz and Gray (1996), Geoghegan et al. (1997), Cropper et al. (1999) and various models discussed in Kaimowitz and Angelsen (1998). Some have taken a demo-graphic approach to explaining land use (e.g. Harrison (1991) and Rosero-Bixby and Palloni (1996); such a focus is also common in cross-country empirical efforts, e.g. Rudel (1989)). However, this approach often leads to inadequate attention to non-population factors that affect land-use choices. It also raises the issue that, to some extent, population levels at any point in time arise as a reaction to other, underlying factors (and that this complicates inference and prediction).
8For applications to Costa Rica, see Hall et al. (1995), Veldkamp and Fresco (1995) and Bouman et al. (1997).
approach. In the traditional panel approach, changes in land use are regressed on changes in observable causal factors; if the observed factors remain fixed, the model predicts no change in land use. In contrast, the dynamic approach mod-els a continuous process of change affected by both the level and the changes in observable and unobservable factors. This type of model seems appropriate for a process of rapid economic de-velopment, to which many unobservable changes are intrinsic. To estimate this model we regress land use transitions (e.g. forest to pasture) against both levels and changes in observable factors and define a dynamic error structure.
The dynamic or duration approach that we are using has not previously been applied for land use, but is commonly used in labor economics and
technological adoption.10 The output of any such
estimation is a prediction of the probability that land changes use at a given time. For example, the coefficients of the estimated model may generate the prediction that an increase of 10 cents per kilo in the returns to growing coffee raises by 0.02 the probability that land with certain ecological char-acteristics is shifted from forest to coffee in a certain year.11
We are applying this approach to both aggre-gate (district-level) and disaggreaggre-gate (pixel-level) data on land use and factors that affect land use. The theoretical approach is the same regardless of data aggregation; the econometrics is different. When we use aggregate data we regress the defor-estation rate on observables, while when we use pixel level data the dependent variable is a dummy variable reflecting the transition of inter-est on an individual plot of land, e.g. a plot starting a period in forest and being cleared. The aggregate approach may be more easily applied in countries with limited data and by researchers with less econometrics knowledge. The disaggre-gate information, unlike averages over large possi-bly heterogeneous districts, is accurate even for
specific sites. With disaggregated data we can use explicit measures of contiguity to address unob-served spatial effects, such as spatial auto-correla-tion, that can generate spurious significance
estimates.12 This data allows us to use the full
power of the dynamic econometrics.
In thinking about the specific case of Costa Rica, note first that deforestation has been
significant13 and that it has yielded degradation
such as species loss, erosion of top soil and silta-tion.14
In terms of land use choices and factors that affect them, causes of deforestation include the expansion of the agricultural frontier and urban expansion, themselves linked to high popu-lation growth and the opening of the economy,
i.e. increased trade.15 Further, Costa Rica has
taken steps to protect areas of valuable natural and scenic habitats; currently, 29% of its territory is under some degree of protection, and this, too,
can affect the land-use choices.16 For instance,
Sanchez-Azofeifa et al. (1999b) indicate the value of protective reserves in curbing deforestation.
2.2. Ecosystem modeling of carbon sequestration
Our goal is a map from observable determi-nants to predictions of carbon storage. Any mod-eling approach must be based on an underlying conception and quantification of the physical pro-cesses that control net primary productivity (NPP). At a broad level, two distinct approaches to formalizing these underlying processes are pro-cess modeling and empirical modeling. The most efficient application of these ideas might coordi-nate or combine those two approaches.
Any such model predicts carbon storage as a function of a set of primitive ecological condi-tions. The sets of inputs and their manipulation for predictions, differ across approaches. We view the two approaches as a more complex one that
12See, for instance Anselin (1988).
13Centro Cientifico Tropical (1982), Sader and Joyce (1988) and Sanchez-Azofeifa et al. (1999b, 2000a).
14See Sanchez-Azofeifa and Quesada-Mateo (1995). 15Hall et al. (1985) and Lutz and Daly (1990). 16See Sanchez-Azofeifa et al. (1999a). 10See Kiefer (1988), Lancaster (1990) and Kerr and Newell
(1999).
requires costlier inputs and more effort to apply, i.e. process models, versus a simpler one with cheaper inputs and requiring less effort (in partic-ular for application over a wide range of ecologi-cal conditions), i.e. empiriecologi-cal models.
2.2.1. Process models
Many process models have been developed to simulate the dynamics of C stocks in various ecosystems, and their performance in simulating changes of soil organic C and standing biomass across a wide range of environmental and
man-agement conditions has been compared.17
We have selected the CENTURY model on the basis of model robustness across a wide range of condi-tions, as well as our previous experiences making use of the model in Costa Rica.
The CENTURY model is one of the most
established biogeochemical models in the world.18
It simulates C, N, P and S cycles in various ecosystems (including pastures, forests, crops and savannas) with the capability of modeling the impacts of management practices (e.g. fertiliza-tion, cultivation) and natural disturbances such as fire and hurricane.19
The model has been tested extensively against field measurements from
vari-ous ecosystems around the world20
and used for biogeochemical simulation purposes at the re-gional, continental, and global scales.21
The major inputs for the monthly-time-step version of CENTURY include: monthly average
maximum and minimum air temperature,
monthly precipitation, lignin content of the plant material, plant N content, soil texture, atmo-spheric and soil N inputs, initial soil C and N levels, and management practices such as
fertiliza-tion.22 A modeler must choose how to generate
such input parameters: fieldwork, existing data-bases, or the literature. From this set of inputs,
the model generates a rich set of outputs. Those most relevant to the C dynamics of an ecosystem can be grouped into: above- and below-ground primary productivity, above- and below-ground
standing biomass, CO2emissions during litter
de-composition, C:N ratios of plant tissues, C
re-moved during events such as grazing and
harvesting and soil C pool sizes.
Liu, a project member, has with others already adapted the CENTURY model to the Atlantic Zone of Costa Rica to simulate the dynamics of C
and N in land-use/land-cover conditions including
primary forests, secondary forests, pastures, and
banana plantations.23
Extending this regional work and applying the result to all of Costa Rica, we are calibrating CENTURY with field measures
of C stocks in various ecosystems/land use
gradi-ents across Costa Rica, and will then validate it with independent field measures. The output will be a mapping that links the observed characteris-tics of an area to C sequestration. This function can then be coupled with the outputs of economic modeling to permit the integrated policy analyses.
2.2.2. Empirical models
As suggested above, we view empirical and process models as complementary. Process models have the advantage that they can be used, with some caution, for novel or unobserved situations such as future climate changes or plantations with artificial mixtures of species. This is possible be-cause the model incorporates some detail regard-ing basic ecological processes (primary pro-duction, decomposition, nutrient cycling, soil hy-drology). In contrast, calibrated empirical models are best as interpolators, in situations close to
23Liu et al. (1999; 2000a; 2000b), Reiners et al. (1999) and Liu and Reiners (2000). As an example of the modeling within our project, the modified CENTURY model successfully cap-tured the dynamics of soil organic matter along a chrono-se-quence of pastures converted from primary forests in the Atlantic Zone of Costa Rica (Liu et al., 2000b). During the last two decades in certain regions of Costa Rica, there has been a dramatic conversion of forests to agricultural lands. In the Atlantic Zone, where forest-pasture conversion was domi-nant, :44% of the non-swamp forest was converted to
agri-cultural land from 1979 to 1996 (Reiners et al., 2000). 17VEMAP (1995) and Smith et al. (1997).
18Parton et al. (1987) and Schimel et al. (1997). 19See Parton et al. (1987) and Parton et al. (1993). 20For instance, see Parton et al. (1993), Schimel et al. (1994) and Smith et al. (1997).
21Schimel et al. (1994), VEMAP (1995) and Schimel et al. (1997).
those observed. The reason is that as more reduced-form models, their coefficients depend more on locally specific details.
In this context, empirical models such as the Holdridge life zone system (LZS) can be used as a guideline for organizing vegetation data generally,
and the LZS has been applied worldwide.24 In
Costa Rica, scientists are experienced with the system for a variety of applications, including C-sequestration studies; published LZS maps are available for Costa Rica and can be linked to maps of soils, topography and actual land use. This experience in local application, in Costa Rica or in the tropics more generally, has much to offer.
At its fundamental (i.e. first or bioclimatic) level, the LZS uses climatological data from standard meteorological information. This level estimates NPP from actual evapotranspiration (itself a function of biotemperature and moisture) and the relationship of primary productivity to this
funda-mental climatological data has been quantified.25
A nice example of the use of the LZS in integrated policy analysis appears in Repetto et al. (1991 p.82), where fundamental ecological data are used to predict timber volume. Additional levels in the LZS classification system also take into
account soils, rainfall distribution and the
disturbance regime (or the time since disturb-ance).26
Thus, when fully parameterized, the LZS is a multidimensional matrix that predicts NPP based on biotemperature, moisture (from precipitation measurements), soils and land-use data. Currently, this matrix is the organizing principle for much extant Costa Rican data, and can serve as a template for organizing additional information on C pools and fluxes. Our project includes this research to extend the parameterized LZS model; we will produce LZS-based regressions relating primary productivity and C storage in vegetation and soils to not only climatological but also soil
and disturbance conditions.27 These will allow us
to fully parameterize the LZS model.
Of course, the potential of the LZS as a basis for classification of locations or vegetation into roughly similar groupings derives from its validity as a first-cut predictive model. That is what underlies our suggestion that efficient ecological modeling could combine empirical and process modeling. In short, the detailed predictions of the more complex and costly process models could be
generated for a relatively small set of
representative locations and then the LZS model, using relatively easily obtained information, could be used to determine which of these representative process-model estimates should be applied to any other given location.
2.2.3. Model testing and deployment
For our process model, CENTURY, we will use data from 50% of the field sites (see below) to fully calibrate the model. Then both the CEN-TURY and LZS models will be validated using the field measurements (for CENTURY, the sec-ond 50% of them). The resulting models will plug into our first integrated assessment goal, the C-se-questration supply function for Costa Rica. They will also provide the starting point for our search for simplified models that retain predictive power (to guarantee sequestration outcomes), but are easier and cheaper to use.
3. Data needs and collection
In this section, we consider the data needs for both the ecological and the economic analyses. For economic purposes, i.e. modeling land use choices, the first data requirement is good mea-sures of land use, with both spatial detail and temporal coverage. For modeling, the second need is data regarding the factors that affect economic returns to land uses, which explain land use within economic models. Data needs for the ecological analysis of C storage are analogous:
24See Holdridge et al. (1971). 25Holdridge et al. (1971).
26The soils and rainfall distribution measures are deviations from average climatic conditions.
first, measures of C stocks in ecosystems, including systematic sampling of the variation within edaphic, climatic and land-use conditions; and second, data on those factors which may explain these C observations within the ecological models. In each sub-section, we also describe our
databases and/or our approach to ongoing data
collection for Costa Rica.
3.1. Economic data
3.1.1. Land use and land co6er
In many locations, relatively good data may exist for land use and land cover. While data sets for past years are often limited to census data, remote sensing by satellites is now producing ad-ditional high-quality data at a cost that is decreas-ing over time. This augurs well for economic analysis of land use in the future. At this point, though, sufficient data for historical analysis ex-ists in only some countries. Further, note that the number and the spatial detail of observations on factors that explain land use are not increasing at the same rate as the data on land use itself.
The potential in Costa Rica for excellent data of this sort is extraordinary, given several institu-tional initiatives concerning geographic data. Our team has already generated a detailed and com-prehensive land-cover data set (all of Costa Rica for six points in time going back to 1960; see Table 1 below) which is an important base for the work we have described. Given the difficulty of the inferences we want to make, though, including the estimation of rules that are useful for other countries, our project is endeavoring to increase the quality and scope of these data sets, for instance, moving to higher quality products and extending the data set back in time.
To increase quality, Arturo Sanchez and the Earth Observation Systems Laboratory (EOS-Lab, Department of Earth and Atmospheric Sci-ences at the University of Alberta) are processing
the 1978/1979 data acquired through our earlier
efforts to produce a data set of the same quality as his 1986 and 1997 forest-cover data (and, not, incidentally, permit better analysis of reforesta-tion). To increase scope, we are extending our data sets back in time, all the way to 1945 for at
least some of the country, and at least to the early
1960s for the whole country.28
3.1.2. Factors that influence land-use choices An economic approach describes land-use choices as efforts to maximize some form of re-turns (the definition of rere-turns, and the time frame considered, may vary between individuals). Thus, factors that affect these returns will explain land-use choices. Returns can be included empiri-cally in three ways. The first is to include qualita-tive factors that clearly affect land returns (e.g. local road density, to reflect transport costs, or soils, reflecting agricultural productivity). The sec-ond is to directly measure dollar-valued returns to different land uses. Such estimates of revenue minus cost require data on prices of all important crops across time, yields for different crops under different conditions at different times, and direct estimates of both production and transport costs. The third approach is to start with estimates of land value, which reflects returns over time, and then use hedonic approaches to relate these to the underlying qualitative factors.
For estimating land-use baselines, the first ap-proach may be preferred because it directly incor-porates factors of various types. For estimating responses to carbon payments, however, the sec-ond or third approaches, which include direct measures of returns, must be used. Of course, for any of these approaches to be feasible, exogenous variation in the explanatory variables must exist. Costa Rica is ideal for all of these estimation approaches, then, as a small export-oriented country that largely depends on imported technol-ogy, such that much of the variation in net crop returns is exogenous. Table 1 below summarizes the data we have collected to date in Costa Rica. We are working with the Costa Rican Ministry of Agriculture and other contacts in agriculture to improve the data. For instance, we are using historical records of Costa Rican transportation networks to create GIS maps of the main network at several points in time.
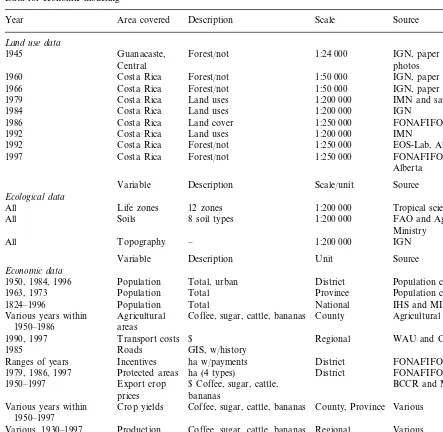
Table 1
Data for economic modelinga
Area covered
Year Description Scale Source
Land use data
Guanacaste, Forest/not
1945 1:24 000 IGN, paper maps/aerial
photos Central
Forest/not
1960 Costa Rica 1:50 000 IGN, paper maps
1966 Costa Rica Forest/not 1:50 000 IGN, paper maps
1979 Costa Rica Land uses 1:200 000 IMN and satellite images
Land uses 1:200 000
Costa Rica IGN
1984
Costa Rica
1986 Land cover 1:250 000 FONAFIFO
Land uses 1:200 000
Costa Rica IMN
1992
Costa Rica
1992 Forest/not 1:250 000 EOS-Lab, Alberta
1997 Costa Rica Forest/not 1:250 000 FONAFIFO/EOS-Lab,
Alberta
Description Scale/unit
Variable Source
Ecological data
12 zones 1:200 000
Life zones Tropical science center
All
Soils 8 soil types 1:200 000 FAO and Agricultural All
Ministry
– 1:200 000
Topography IGN
All
Description Unit Source
Variable Economic data
Population
1950, 1984, 1996 Total, urban District Population census
Population
1963, 1973 Total Province Population census
Total National
Population IHS and MIDEPLAN
1824–1996
Agricultural Coffee, sugar, cattle, bananas Agricultural census
Various years within County
1950–1986 areas
$
1990, 1997 Transport costs Regional WAU and CNP
1985 Roads GIS, w/history
Ranges of years Incentives ha w/payments District FONAFIFO ha (4 types) District
Protected areas FONAFIFO
1979, 1986, 1997
Export crop
1950–1997 $ Coffee, sugar, cattle, BCCR and MIDEPLAN
bananas prices
Crop yields
Various years within Coffee, sugar, cattle, bananas County, Province Various 1950–1997
Production Coffee, sugar, cattle, bananas Regional Various Various, 1930–1997
costs
All Costa Rica
1997 Land value District Tropical Science Center
1958–1978 Pasture value All Costa Rica County BCCR
1959–1978 Undeveloped All Costa Rica County BCCR
value
aIMN, National Meteorological Institute; IGN, National Geographic Institute; FONAFIFO, Forestry Ministry; MIDEPLAN, Ministry of development and planning; HIS, International Historical Statistics; CNP, domestic producer board; BCCR, Central Bank of Costa Rica; WAU, Wageningen Agricultural University.
3.2. Ecological data
3.2.1. In6entory of carbon and nitrogen stocks in
dominant ecosystems
Regarding actual measurements of C and N stocks in ecosystems, while numerous studies have
theoretically sophisticated it may be. Thus, we present a plan to measure current C stocks in dominant ecosystems and land-cover types in a detailed and extensive fashion. Our field efforts have started, but will take time; we cannot yet provide even preliminary data for Costa Rica.
Numerous field studies have examined soil C and N pools and dynamics in Costa Rica, considering, e.g.: soil organic carbon (SOC) pools (Motavalli et al., 1994), decomposition rates of SOC (Veldkamp, 1994; Motavalli et al., 1995), SOC changes after forest conversion (Veldkamp, 1994), soil C and N distribution in soil profiles (Martini and Macias, 1974; Veldkamp, 1994), tree-growth rates (Lieber-man and Lieber(Lieber-man, 1987) and fine root biomass (Gower, 1987). Additional studies have investigated the impacts of deforestation and tree plantations on
ecosystem C and N stocks in Costa Rica.29 Also,
long-term studies have examined net primary production and nutrient cycling in several
agro-forestry and cropping systems in Costa Rica.30
None of these studies, though, explicitly quantifies soil and aboveground C and N pools at the eco-system scale across the range of climatic, edaphic, climatic and land-use conditions encountered in Costa Rica.
Further, previous regional calculations consider the impact of land-use change on C dynamics,
including in Costa Rica.31 However, these tend to
use measurements of C pools and dynamics
elsewhere in the tropics and/or are not detailed
enough in their determination of the components of C and N stocks to be of great use for
eco-system-scale models like CENTURY.32
In addition, while forest inventory data exist for Costa Rica and is sometimes used, such data often
includes only measures of commercial or industrial products (e.g. saw-wood, veneer logs, pulpwood) and does not include non-merchantable species or sizes, small or defective trees, branches, bark, leaves, stumps, roots, surface litter or soil organic matter. Such ecosystem components can account for large portions of total C and N pools and may vary in ways that are not easily predicted from measures of large tree or bole biomass (Kauffman et al., 1998b).
These facts indicate the need for a systematic selection of field sites in order to sample above-ground and soil pools for obtaining unbiased estimates at the national scale. We are system-atically collecting field data to address this need. All sites to be sampled will be selected using extensive and detailed GIS databases of climatic, edaphic and land-use characteristics in Costa Rica. This will provide the widest and most pertinent range of sampling points across Costa Rica and permit us to make effective use of the extensive but divergent existing studies.
We have now started sampling, aiming to span the range in edaphic, climatic, and land-use char-acteristics encountered in Costa Rica. These include mature forests, dominant forms of manage-ment (e.g. pastures, banana and coffee crops), and secondary forests of various ages. Mature forest C pools will be used as hypothesized maxima for C sequestration, and actively managed sites (e.g. pastures and croplands) used as hypothesized minima for C sequestration.
We are sampling aboveground and soil pools of C using a nested plot design. A large plot (0.9 ha) will be established at each site, within which we will sample all of the constituent biomass components of that particular land-cover type. We will calculate biomass of each component using a combination of allometric equations and destructive sampling techniques (borrowing from previous studies of C and N dynamics in the Amazon Basin and tropical Mexico, while tailoring to be appropriate for Costa
Rica).33 From biomass, we will calculate C pools
from C concentrations determined from tissue 29See, e.g. Ewel et al. (1981), Matson et al. (1987), Reiners
et al. (1994), Veldkamp (1994), Fernandes et al. (1995), Gon-zalez and Fisher (1994), Stuhrmann et al. (1994) and Haggar and Ewel (1995).
30See Fassbender et al. (1991), Mazarino et al. (1993), Montagnini et al. (1993), Haggar et al. (1993) and Reeves et al. (1997).
31Hall et al. (1985), Houghton et al. (1991) and Brown (1997).
32Hughes et al. (2000a) note substantial discrepancies be-tween estimates of C and N pools calculated using studies outside of the tropical region in question and those using region-specific measures of C and N pools and dynamics.
samples that will be collected for each respective biomass component. Soil pools will be deter-mined through collection of soil samples to a 1-m depth; C% as well as bulk density will be deter-mined for each sample at each site.
Previous work has shown this methodology to be an effective and efficient means of quantifying dynamics of aboveground and soil C and N pools in response to land-use change in the Brazilian
Amazon,34 seasonally dry forests of Jalisco,
Mex-ico,35 and moist tropical forest systems of Los
Tuxtlas, Mexico.36
It provides not only total pools of C and N, but also measures of each of the various biomass components. Such detail is invaluable for the calibration and validation of ecological models, as these biomass components vary with respect to their rates of production and decomposition and levels of combustion; it per-mits more accurate calculation of average process
rates and/or the use of ecological models
requir-ing more detailed process inputs.
3.2.2. Factors that influence C storage
The amount of C storage at any given site depends on the climate (e.g. precipitation and temperature) and on soil conditions, as well as on human activities. Tropical ecosystems in general, and forests in particular, can accumulate a huge amount of carbon in biomass. Carbon storage in tropical soils is usually smaller than that in
bo-real soils, where decomposition rates of SOC are much slower, mainly due to lower temperature. Soil texture plays an important role in regulating the decomposition rate of SOC and therefore the release of nutrients. Soils with higher fraction of clay and silt can form aggregates with soil or-ganic matter. Those aggregates are more resistant to microbial decomposition. Thus, for modeling C storage, it is clear that one requires data on precipitation, temperature, and various character-istics of the soil. This is true whether one is using a relatively reduced-form empirical model or a complex process model.
In order to consider realistic, policy-relevant scenarios, one must also consider human influ-ences on the dynamics of C stocks. The most significant impact of human activities on C
stor-age comes through deforestation.37 However,
af-ter the conversion of forests to agricultural lands, management practices also play a significant role
in determining the magnitude of C storage.38 For
example, fertilized systems would sequester more carbon from the atmosphere than unfertilized
systems.39 Another example is that systems
combining trees and pasture systems (i.e. silvo-pastoral systems) would store more carbon than systems with grasses only. Thus, for explaining carbon storage, information on both land cover and land use is essential.
For a complete explanation of C storage, we must recognize that human activities affect C storage not only at the field or landscape scale but also at the regional and global scales. Plants
adapt to increased atmospheric CO2
concentra-tion by sequestering more C from the atmo-sphere.40The intensification of nitrogen cycling at the regional and global scales increase nitrogen deposition from the atmosphere, which leads to 34Kauffman et al. (1995), Kauffman et al. (1998a) and
Hughes et al. (2000b) in press, Cummings et al. in review. 35Kauffman et al., in prep..
36Hughes et al. (1999), Hughes et al. (2000a). For example, in the heavily deforested tropical region of Los Tuxtlas, Mex-ico, conversion of primary forests to pastures or cornfields resulted in declines of 95 and 91% of aboveground C and N pools, respectively (Hughes et al., 2000a). In contrast, soil pools of C and N remained relatively stable among sites located along the land-use gradient of this region. In addition, biomass accumulation by secondary forests in the Los Tuxtlas Region was shown to be rapid; results indicated that sec-ondary forests would attain aboveground biomass levels equivalent to those of primary forests of the region after 73 years of succession. However, rates of accumulation were very much constrained by the duration of prior land use; longer periods of land use resulted in slower rates of accumulation (Hughes et al., 1999).
37Houghton et al. (1999) claim deforestation emissions in the tropics equal about half of fossil fuel combustions.
38See, e.g. Paul et al. (1997).
39Hudson et al. (1994). For policy purposes one might wish to assess the total effect of fertilization from a broader per-spective, one including the carbon costs involved in its manu-facture and distribution (Schlesinger, 1999)
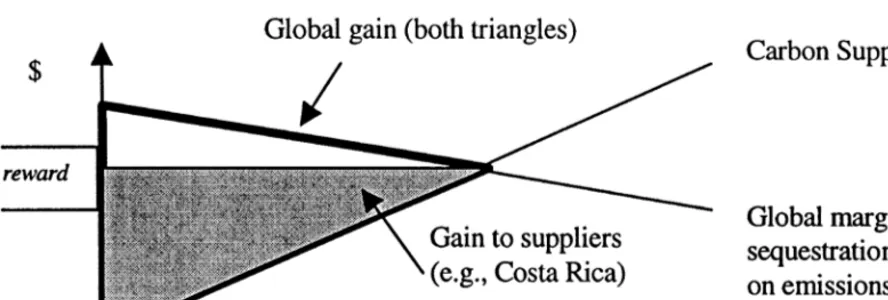
Fig. 3. Simple illustration of carbon supply and social value.
more C sequestration in most ecosystems, espe-cially in N-limited forests.41
For a given amount of nitrogen input, trees can sequester more carbon than crops or grasses because of higher C:N ratio in tree tissues. Finally, another factor influencing
C storage is climate change or climate
fluctuations.42
4. Integrated analysis
4.1. Carbon sequestration supply function — how
6aluable would C sequestration be?
The first integrated output of interest is a func-tion relating factors that affect, land use to the C sequestration that they cause. This function is generated by chaining the economic analysis to the ecological analysis. The resulting, integrated model can indicate, for example, additional se-questration relative to the baseline caused by a change in policy such as the creation of a park. All the data the model uses will be stored within a GIS, permitting spatially explicit simulations.
One policy question is how much sequestration will take place for any given C reward or, put
another way, what C reward is necessary to achieve any given amount of C sequestration. Another policy question is what value would ac-crue (both globally and to individual countries) from including C sequestration within the global mitigation effort. Using our integrated model, the answer to both is seen by working through the effect of an increase in the C reward.
A given reward will induce a certain level of additional protection of forests, with implied se-questration relative to the baseline. A higher re-ward will induce further protection, a greater supply of sequestration, and more C offsets. Thus, increasing rewards map out a carbon supply func-tion, as in Fig. 3. When estimated, a supply function answers directly the first policy question. The value of sequestration can also be seen. The value to a supplier is its producer surplus, i.e.
triangle above the cost of supplying offsets/CERs
and below the level of the reward. The global gain from offsets is the country gain plus the consumer
surplus for CER buyers.43
43Kerr et al. (2000b) provides an aggregate-data example of such a function; preliminary regressions explain deforestation using a direct estimate of the net economic returns to forest clearing. The key coefficient is that for the returns to land uses; because carbon payments for standing forest will reduce the net returns from deforestation, the inverse of this coefficient indicates their effect on land use and thus on C sequestration. 41Schindler and Bayley (1993).
4.2. Baselines — on what basis do we compute and reward additional carbon sequestration?
For such carbon trading to permit tropical C sequestration efforts to replace emissions-reduc-tion efforts in other countries, we need carbon baselines. Only then can society reward only the carbon sequestration over and above baseline, so that emissions can be allowed to rise correspond ingly in other countries while maintaining global net emissions. Fortunately, the economic analysis can produce a land-use baseline by projecting the values of the key factors influencing land use, absent carbon policies, and applying the estimated model to project land use. Given that, the esti-mated ecological model can then project the im-plied C sequestration.
In practice, projecting the future values of fac-tors in land use (such as prices or future roads) may not be so easy. However, a ready solution is at hand. Instead of imposing a single projection as the expected future path of land use and carbon (e.g. forest and biomass falls by 0.2% per year for 50
years), one could use a baseline function. For
example, if beef prices fall, one path (e.g. forest cover remaining constant) is the baseline, but if prices stay constant, another (e.g. 0.1% deforesta-tion per year) is used. Such funcdeforesta-tions of driving factors are precisely the output that arises from the economic analysis (and note that while the second approach in Section 3.1.2 above provides the co-efficient needed for a carbon-offset supply func-tion, the first approach includes more factors, and may have more explanatory power, and thus be better for baselines).44
Further attention is required, however. Suppose that the baseline function includes roads, as well as the level of beef prices. If beef prices fall indepen-dently of anything the country does, one might argue that the baseline should be adjusted so that no forest protection relative to the baseline would be credited to the country. Including prices in the
baseline will accomplish that. However, if the country cancels the building of a road precisely because of incentives to protect forests, perhaps it should get credit for reducing deforestation. Thus, we might not want to have roads in the baseline function, because if the baseline adjusts along with the roads, the country would not be credited. We might want to include in the baseline function only factors not controlled by the countries. For in-stance, one might use international prices, and perhaps also the level of development (e.g. GDP per capita), as countries are unlikely to distort that just for C payments.
4.3. Optimal carbon-market rules — how accurate should carbon-offset rules be?
A reason to develop simplified versions of the disciplinary and integrated analyses of tropical forest sinks is that, despite the gains from increased accuracy, the required increase in effort and com-plexity imposes costs. A first obvious cost of increasing accuracy is an increase in direct costs of the analyses (in pilot sequestration projects, it has been observed that generating acceptable C mea-sures can be a significant cost). Second, both direct costs and uncertainty about the outcome of the certification process will discourage potentially valuable projects. Fewer C trades will take place, so some gains from trade will be lost. The third cost of using more data and more complex compu-tations is an increased scope for manipulation. Complex rules may become non-transparent black boxes. Also, as more complex rules involve more costly data collection, this may reduce monitoring efforts by third parties to check claims by CER producers. Ironically, then, increased effort and complexity to reduce some errors may in fact lead to others.
Thus, one would like to derive simplified but accurate versions of the economic and ecological and, ultimately, also the integrated analyses. The derivation of these simpler models (or rules) from state-of-the-art models is itself a significant re-search undertaking. For instance, if the
CEN-TURY model provides the best absolute
predictions of field C measurements, one might derive simpler but still accurate versions on the 44Compare e.g. Kerr et al. (2000a) with Kerr et al. (2000b).
basis of the simulated results of the full model. This could involve multiple-regression analysis, sometimes called meta-modeling because models of only a few variables are developed from the results of the complete model. Such techniques have proven effective elsewhere (Parton et al., 1993; Schimel et al., 1994). However, whether a version with few variables, i.e. requiring few in-puts, can yield high absolute accuracy remains an open and important question. For an empirically-based ecological model like the LZS, there are also modeling choices of this type if simpler versions of the model are to be derived for use in policy. For instance, one might conclude that the first-level regressions (using climate data only) are suffi-ciently accurate, i.e. that the additional cost of parameterizing the second level (including soil and disturbance regime) is not worthwhile.
For the economic modeling, another motivation for simplifying the data requirements and the statistical analysis as much as possible is the potential to apply the outputs to other countries. Some key factors such as current land use, trans-port costs, ecological constraints, GDP per capita and population are clear candidates for such sim-pler models. This point highlights the potential value of being able to apply the economic ap-proach at an aggregate level. While pixel-level data may be available for Costa Rica, even for earlier periods, for many countries only aggregated data may be available, in particular for earlier periods of time. More generally, even if it may be possible to get pixel-level data for many countries it may be cheaper and easier to just collect the aggregate data, yielding one sort of simpler, cheaper model. Finally, the statistical analysis will be simpler when using aggregate data, another reason why this would be an easier version to use.
5. Discussion
If carbon sequestration in tropical forests (in particular within developing countries) is to be included within the options for implementing the Kyoto Protocol or other such agreements, policy makers will require integrated models that can both project baselines for land use and translate
observable land use and physical characteristics of sites into measures of carbon. This will permit them to define international rules for the creation of carbon offsets that are feasible and adequately accurate. This paper has described a general methodology for creating the requisite disciplinary models and for linking them to form just such an integrated model: and has illustrated the imple-mentation of that methodology using our ongoing project in Costa Rica.
This methodology is designed to project land use and carbon at a national level. That avoids the persistent problem of leakage outside project ar-eas, a problem that plagues baseline estimates for particular projects. While clearly it does not ac-count for international leakage (arising, e.g. through effects on prices that affect behavior else-where), we would argue that this is small relative to internal leakages, at least when countries are small and carbon prices are low.
Another important point regarding baselines is that we proposed baselines that are not fixed paths of forested area (e.g. 1% deforestation per year for 20 years), but rather are functions of exogenous factors (e.g. if international beef prices happen to fall, then forest clearing is expected to fall indepen-dent of the country’s actions). This reduces the risk associated with fixing a baseline, from the points of view of both the country and the international community.
Our integrated modeling strives to use state-of-the-art methodology in each discipline while forc-ing each discipline to make its outputs feed into the truly integrated analyses and models used for policy evaluation. This is proving to be a valuable learning experience for all of us. The need to explicitly integrate results is altering the ap-proaches of all team members.
data available globally (especially on the ecologi-cal side) for such policy analysis.
Acknowledgements
This paper has grown out of an ongoing re-search agenda on land use and carbon sequestra-tion in Costa Rica. We have benefited from comments at the NBER Summer Institute, an AERE session at the ASSAs, a Kennedy School-DOE workshop on carbon sequestration, the 1999 Open Meeting on Human Dimensions of Environ-mental Change, and two anonymous referees. In addition, the authors thank for generous support the Tinker Foundation for an Institutional Grant on ‘Achieving Greatest Benefits from Sequestra-tion in Costa Rica’, the Center for Environmental Research and Conservation at Columbia Univer-sity, the Harvard Institute for International Devel-opment, and the National Center for Ecological Analysis and Synthesis at UC-Santa Barbara, a Center funded by NSF (Grant No. DEB-94-21535), UC-Santa Barbara, and the State of Cali-fornia, where we have been supported as the Carbon Sequestration Working Group.
References
Allen, J.C., Barnes, D.F., 1985. The causes of deforestation in developing countries. Ann. Assoc. Am. Geograph. 75, 163 – 184.
Bouman, B.A.M., Jansen, H.G.P., Schipper, R.A., Nieuwen-huyse, A., Hengsdijk, H., 1997. A methodology for sus-tainable land use exploration at the regional level: application to the Atlantic Zone of Costa Rica. Draft manuscript. Wageningen Agricultural University, The Netherlands.
Brown, S., 1997. Estimating biomass and biomass change of tropical forests: a primer. FAO Forestry Paper. FAO, Rome.
Busch, C., Sathaye, J., Sanchez-Azofeifa, G.A., 1999. Lessons for Greenhouse Gas Accounting: A Case Study of Costa Rica’s Protected Areas Project. Lawrence Berkeley Na-tional Laboratory, Berkeley, CA.
Carter, L., 1997. Modalities for the Operationalization of Additionality. Presentation at the International Workshop on Activities Implemented Jointly, Leipzig, Germany 5 – 6, 1997.
Centro Cientifico Tropical, 1982. Costa Rica: Perfil Ambien-tal, Estudio de Campo.
Cole, C.V., Paustian, K., Elliot, E.T., Metherell, A.K., Ojima, D.S., Parton, W.J., 1993. Analysis of agroecosystem carbon pools. Water Air Soil Poll. 70, 357 – 371.
Chomitz, K.M., Gray, D.A., 1996. Roads, land use and deforestation: a spatial model applied to Belize. World Bank Econ. Rev. 10 (3), 487 – 512.
Cropper, M., Griffiths, C., Mani, M., 1999. Roads, population pressures, and deforestation in Thailand, 1976 – 1989. Land Econ. 75 (1), 58 – 73.
Cummings, D.L., Kauffman, J.B., Hughes, R.F., Total above-ground biomass, forest volume, and tree density of Amazo-nian tropical forest delineated by projecto RADAMBRASIL in Northern Rondonia, Brazil. In review in Ecology.
Dixon, R.K., 1999. The UN Framework Convention on Climate Change Activities Implemented Jointly (AIJ) Pilot: Experi-ences and Lessons Learned. Kluwer Academic, Boston, MA. Dudek, D.J., Wiener, J.B., 1996. Joint Implementation, Trans-action Costs and Climate Change. Organization for Eco-nomic Cooperation and Development, Paris, France. Ewel, J., Berish, C., Brown, B., Price, N., Raich, J., 1981. Slash
and burn impacts on a Costa Rican wet forest site. Ecology 62, 816 – 829.
Fassbender, H.W., Beer, J., Heuveldop, J., Imbach, A., En-riquez, G., Bonnemann, A., 1991. Ten year balance of organic matter and nutrients in agroforestry systems at CATIE, Costa Rica. For. Ecol. Manag. 45, 173 – 183. Fernandes, D.N., Sanford, R.L. Jr, 1995. Effects of recent
land-use practices on soil nutrients and succession under tropical wet forest in Costa Rica. Conserv. Biol. 9, 915 – 922ica.
Geoghegan, J., Wainger, L., Bockstael, N., 1997. Spatial land-scape indices in a hedonic framework: an ecological econom-ics analysis using GIS. Ecol. Econ. 23, 251 – 264. Gonzalez, J.E., Fisher, R.F., 1994. Growth of native forest
species planted on abandoned pasture land in Costa Rica. For. Ecol. Manag. 70, 159 – 167.
Gower, S.T., 1987. Relations between mineral nutrient availabil-ity and fine root biomass in two Costa Rican tropical wet forests: A hypothesis. Biotropica 19, 171 – 175.
Haggar, J.P., Ewel, J.J., 1995. Establishment, resource acquisi-tion, and early productivity as determined by biomass allocation patterns of three tropical tree species. For. Sci. 41, 689 – 708.
Haggar, J.P., Tanner, E.V.J., Beer, J.W., Kass, D.C.L., 1993. Nitrogen dynamics of tropical agroforestry and annual cropping systems. Soil Biol. Biochem. 25, 1363 – 1378. Hagler Bailly, 1998. Evaluation of Using Benchmarks to Satisfy
the Additionality Criterion for Joint Implementation Projects. Hagler Bailly, Boulder, CO.
Hall, C.A.S. (Ed.), 1998. Ecology of Tropical Development: The Myth of Sustainable Development in Costa Rica. Academic Press, New York.
Hall, C.A.S., Tian, H., Qi, Y., Pontius, G., Cornell, J., 1995. Modelling spatial and temporal patterns of tropical land-use change. J. Biogeog. 22, 753 – 757.
Harrison, S., 1991. Population growth, land use and defor-estation in Costa Rica, 1950 – 1984. Interciencia 16 (2), 83 – 93.
Helmer E.H., Brown, S., 1998. Gradient analysis of biomass in Costa Rica and a first estimate of country-wide emis-sions of greenhouse bases from biomass burning. In press in: Hall C.A.S. (Ed.), 1998. Ecology of tropical develop-ment, the myth of sustainable development in Costa Rica. Academic Press, New York.
Holdridge, L.R., Grenke, W.C., Hatheway, W.H., Liang, T., Tosi, J.A. Jr, 1971. Forest Environments in Tropical Life Zones: A Pilot Study. Pergamon Press, Oxford, UK. Houghton, R.A., Skole, D.L., Lefkowitz, D.S., 1991.
Changes in the landscape of Latin America between 1850 and 1985 II. Net release of CO2 to the atmosphere. For. Ecol. Manag. 38.
Hughes, R.F., Kauffman, J.B., Jaramillo, V.J., 1999. Biomass, C, and nutrient dynamics of secondary forests in a humid tropical region of Mexico. Ecology 80, 1892 – 1907.
Hughes, R.F., Kauffman, J.B., Jaramillo-Luque, V.J., 2000a. Ecosystem-scale impacts of deforestation and land use in a humid tropical region of Me´xico. Ecol. Appl. 10, 515 – 527.
Hughes, R.F., Kauffman, J.B., Cummings, D.L., 2000b. Fire in the Brazilian Amazon: 3. Biomass, carbon, and nutri-ent dynamics in slashed second- and third-growth forests. Oecologia, in press.
Kaimowitz, D., Angelsen, A., 1998. Economic Models of Tropical Deforestation: A Review. CIFOR.
Kauffman, J.B., Cummings, D.L., Ward, D.E., Babbitt, R., 1995. Fire in the Brazilian Amazon: 1. Biomass, nutrient pools, and losses in slashed primary forests. Oecologia 104, 397 – 408.
Kauffman, J.B., Cummings, D.L., Ward, D.E., 1998a. Fire in the Brazilian Amazon: 2. Biomass, nutrient pools and losses in cattle pastures. Oecologia 113, 415 – 427. Kauffman, J.B., Cummings, D.L., Hughes, R.F., 1998b.
Biomass decline in Amazon forest fragments. Science 282, 1611.
Kauffman, J.B., Cummings, D.L., Jaramillo, V.J., Biomass and structure of tropical deciduous forests and pastures in the Chamela region of Mexico. M.S. in preparation. Kerr, S., Newell, R., 1999. Technology Adoption In
Re-sponse To Environmental Regulation: evidence from the US lead phasedown. Paper at AERE/ASSA Annual Meetings, January 5, NY.
Kerr, S., Pfaff, A.S.P., Sanchez, A., Boscolo, M., forthcom-ing 2000a. What Role For Tropical Forests In Climate Change Mitigation? The Case Of Costa Rica, in Central America Project, Environment: Conservation and Com-petitiveness, edited by Harvard Institute for International Development, in Harvard Series in International Develop-ment, Harvard University Press, Cambridge.
Kerr, S., Pfaff, A.S.P., Sanchez, A., forthcoming 2000b. The Dynamics of Deforestation and the Supply of Carbon Sequestration: Illustrative Results from Costa Rica, in Central America Project, Environment: Conservation and Competitiveness, edited by Harvard Institute for Interna-tional Development, in Harvard Series in InternaInterna-tional Development, Harvard University Press, Cambridge. Kiefer, N.M., 1988. Economic duration data and hazard
functions. J. Econ. Literat. 15, 646 – 679.
Lancaster, T., 1990. The Econometric Analysis of Transition Data. Econometric Society Monograph No. 17, Cam-bridge University Press.
Lazarus, M., Kartha, S., Ruth, M., Bernow, S., Dunmire, C., 1999. Evaluation of Benchmarking as an Approach for Establishing Clean Development Mechanism Baselines. Tellus Institute, Boston, MA.
Lieberman, D., Lieberman, M., 1987. Forest tree growth and dynamics at La Selva, Costa Rica (1969 – 1982). J. Trop. Ecol. 3, 347 – 358.
Lile, R., Powell, M., Toman, M., 1998. Implementing the Clean Development Mechanism: Lessons from US Pri-vate-Sector Participation in Activities Implemented Jointly. Discussion Paper 99-08. Resources for the Future, Washington, DC.
Liu, S., Reiners, W.A., 2000. Interfacing a N2O flux model with GIS-based spatial database for scaling-up N2O fluxes from sites to a humid tropical region. Comp. GeoSci. (In review). Liu, S., Reiners, W.A., Keller, M., Schimel, D.S., 2000a. Simulation of nitrous oxide and nitric oxide emissions from tropical moist primary forests in the Costa Rican Atlantic Zone. Environ. Model. Software (In press).
Liu, S., Reiners, W.A., Keller, M., Schimel, D.S., 1999a. Model simulation of changes in N2O and NO emissions with conversion of tropical rain forests to pastures in the Costa Rican Atlantic Zone. Global Biogeochem. Cycl. 13, 663 – 677.
Liu, S., Reiners, W.A., Bouman, B.A.M., Gerow, K., Schimel D.S., Keller, M., 2000b. Simulated impacts of edaphic, biological and management factors on N2O and NO emis-sions from pastures in the Atlantic Zone, Costa Rica. (In review).
Lugo, A.E., Schmidt, R., Brown, S., 1981. Tropical forests in the Caribbean. Ambio 10, 318 – 324.
Lutz, E., Daly, H., 1990. Incentives, Regulations and Sustain-able Land Use in Costa Rica. Environment Working Paper No. 34. The World Bank, Washington, DC.
Martini, J.A., Macias, M., 1974. A study of six Latosols from Costa Rica to elucidate the problems of classification, productivity and management of tropical soils. Soil Sci. Soc. Am. Proc. 38, 644 – 652.
Matson, P.A., Vitousek, P.M., Ewel, J.J., Mazzarino, M.J., Rebertson, G.P., 1987. Nitrogen transformations following tropical forest felling and burning on a volcanic soil. Ecology 68, 491 – 502.
Montagnini, F., Ramstad, K., Sancho, F., 1993. Litterfall, litter decomposition and the use of mulch of four indige-nous tree species in the Atlantic lowlands of Costa Rica. Agrofor. Sys. 23, 39 – 61.
Motavalli, P.P., Palm, C.A., Parton, W.J., Elliot, E.T., Frey, S.D., 1994. Comparison of laboratory and modeling sim-ulation methods for estimating carbon pools in tropical forest soils. Soil Biol. Biochem. 26.
Motavalli, P.P., Palm, C.A., Parton, W.J., Elliot, E.T., Frey, S.D., 1995. Soil pH and organic C dynamics in tropical forest soils: Evidence from laboratory and simulation studies. Soil Biol. Biochem. 27.
Moulton, R.J., Richards, K.R., 1990. Costs of Sequestering Carbon Through Tree Planting and Forest Management in the United States. GTR WO-58. Dept. of Agriculture, Forest Service.
Parton, W.J., Schimel, D.S., Cole, C.V., Ojima, D.S., 1987. Analysis of factors controlling soil organic matter levels in Great Plains grasslands. Soil Sci. Soc. Am. J. 51, 1173 – 1179.
Parton, W.J., Scurlock, J.M.O., Ojima, D.S., Gilmanov, T.G., Scholes, R.J., Schimel, D.S., Kirchner, T., Menaut, J.C., Seastedt, T., Moya, E.G., Kamnalrut, A., Kinya-mario, J.I., 1993. Observations and modeling of biomass and soil organic matter dynamics for the grassland biome worldwide. Global Biogeochem. Cycl. 7, 785 – 809. Pape, A., Rich, J., 1998. Options for Guiding Greenhouse
Gas Emission Baseline Determination. CERI Alberta Off-set Development Workshop, Canada, February, 2 – 3. Pfaff, A.S.P., 1995. The Economics of Deforestation:
Evi-dence from the Brazilian Amazon and New England. Ph.D. Dissertation, M.I.T., Department of Economics. Pfaff, A.S.P., 1999. What drives deforestation in the Brazilian
Amazon? Evidence from satellite and socioeconomic data. J. Environ. Econ. Manag. 37 (1), 26 – 43.
Puhl, I., 1998. Status of Research on Project Baselines under the UNFCCC and the Kyoto Protocol. Organisation for Economic Co-operation and Development, Paris, France. Reeves, M., Lal, R., Logan, T., Sigaran, J., 1997. Soil
gen and carbon response to maize cropping system, nitro-gen source, and tillage. Soil Sci. Soc. Am. J. 61, 1387 – 1392.
Reiners, W.A., Bouwman, A.F., Parsons, W.F., Keller, M., 1994. Tropical rain forest conversion to pasture: Changes in vegetation and soil properties. Ecol. Appl. 4, 363 – 377.
Reiners, W.A., Liu, S., Gerow, K., Keller, M., Schimel, D.S., 2000. Land use changes in Costa Rica’s Atlantic Zone: Net effects on N2O and NO emissions (in preparation). Repetto, R., Cruz, W., Solorzano, R., de Camino, R.,
Wood-ward, R., Tosi, J., Watson, V., Vasquez, A., Villalobos, C., Jimenez, J., 1991. Accounts Overdue: Natural Re-source Depreciation in Costa Rica. World ReRe-sources In-stitute, Washington DC, in collaboration with the Tropical Science Center, Costa Rica.
Richards, K.R., Moulton, R.J., Birdsey, R.A., 1993. Costs of Creating Carbon Sinks in the US. Energy Conver. Manag. 34 (9 – 11), 905 – 912.
Rodriguez, J., Corrales, L., Pratt, L., 1998. Potencial de Carbono y Fijacion de Dioxido de Carbono de la Biomasa en pie por encima del suelo en los bosques de la Republica de Belice, Costa Rica, El Salvador, Guatemala, Nicaragua, Panama, Honduras. Documentos de Trabajo. Rosero-Bixby L., Palloni, A., 1996. Population and
Defor-estation in Costa Rica. Paper presented at the Annual Meeting of the Population Association of America in New Orleans.
Rudel, T.K., 1989. Population, development, and tropical deforestation: a cross-national study. Rur. Sociol. 54 (3), 327 – 338.
Sader, S., Joyce, A., 1988. Deforestation Rates and Trends in Costa Rica, 1940 to 1983. Biotropica 20, 11 – 19. Sanchez-Azofeifa, G.A., Quesada-Mateo, C., 1995.
Defor-estation carbon dynamics and sustainable mitigation mea-sures in Costa Rica: the Puerto Viejo de Sarapiquri case study. Interciencia 20, 396
Sanchez-Azofeifa, G.A., 1996. Assessing Land Use/Cover Change in Costa Rica. Earth Sciences Department. Uni-versity of New Hampshire, Durham, NH.
Sanchez-Azofeifa, G.A., Harriss, R.C., Skole, L.D. (2000a). Forest cover and deforestation rates in Costa Rica using remote sensing imagery. Biotropica (in review).
Sanchez-Azofeifa, G.A., Quesada-Mateo, C., Gonzales-Que-sada, P., Dayanandan, S., Bawa, K.S., 1999a. Protected areas and conservation of biodiversity in the tropics. Conserv. Biol. 13 (2)
Sanchez-Azofeifa, G.A., Daily, G., Ehrlich, P., Wein, R., 2000b. Effectiveness of national parks and biologic re-serves to control tropical deforestation. Biol. Conserv. Submitted.
Schimel, D.S., Braswell, B.H., Holland, E.A., Mckeown, R., Ojima, D.S., Painter, T.H., Parton, W.J., Townsend, A.R., 1994. Climatic, edaphic, and biotic controls over storage and turnover of carbon on soils. Global Bio-geochem. Cycl. 8, 279 – 293.
Schimel, D.S., Braswell, B.H., Parton, W.J., 1997. Equi-librium of the terrestrial water, nitrogen, and carbon cy-cles. Proc. Natl. Acad. Sci. USA 94, 8280 – 8283. Smith, P., et al., 1997. A comparison of the performance of
nine soil organic matter models using datasets from seven long-term experiments. Geoderma 81, 153 – 225.
Stavins, R., 1999. The costs of carbon sequestration: a re-vealed-preference approach. Am. Econ. Rev.
Stavins, R.N., Jaffe, A., 1990. Unintended impacts of public investments on private decisions: the depletion of forested wetlands. Am. Econ. Rev. 80 (3), 337 – 352.
Stuhrmann, M., Bergmann, C., Zech, W., 1994. Mineral nu-trition, soil factors and growth rates of Gmelina arborea plantations in the humid lowlands of northern Costa Rica. For. Ecol. Manag. 70, 135.
Veldkamp, E., 1994. Organic carbon turnover in three tropical soils under pasture after deforestation. Soil Sci. Soc. Am. J. 58, 175 – 180.
Veldkamp, A., Fresco, L.O., 1995. Modelling land use changes and their temporal and spatial variability with CLUEA; A pilot study for Costa Rica. Wageningen Agricultural Uni-versity, Department of Agronomy. Report No. 410 100 086 VEMAP, 1995. Vegetation/ecosystem modeling and analysis project. Comparing biogeography and biogeochemical models in a continental-scale study of terrestrial ecosystem
responses to climate change and CO2 doubling. Global Biogeochem. Cycl. 9, 407 – 437.
Vine, E., Sathaye, J., 1997. The Monitoring, Evaluation, Re-porting and Verification of Climate Change Mitigation Projects: Discussion of Issues and Methodologies and Re-view of Existing Protocols and Guidelines. Lawrence Berke-ley National Laboratory Report No. 40316. BerkeBerke-ley, CA. Watson R.T. et al., 1996. Climate Change 1995. Impacts, Adaptations and Mitigation of Climate Change: Scientific-Technical Analyses. Cambridge University Press.