Corresponding author: [email protected]
Increasing serum transaminase is not
associated with the serum isoniazid and
rifampicin levels in tuberculosis patients
treated with fixed-dose combination
antituberculosis in Yogyakarta
Ratih Puspita Febrinasari1*, Erna Kristin2, Iwan Dwiprahasto2
1Department of Pharmacology, Faculty of Medicine, Universitas Sebelas Maret, Surakarta, 2Department of Pharmacology and Therapy, Faculty of Medicine, Universitas Gadjah
Mada, Yogyakarta, Indonesia
DOI: http://dx.doi.org/10.19106/JMedSci004804201504
ABSTRACT
Tuberculosis (TB) remains a major health problem in the world. Isoniazid (INH) and rifampicin
are irst-line antituberculosis that can cause hepatotoxicity characterized by an increase
of serum transaminase level. Previous study showed the increase in transaminase level of TB patients due to INH and rifampicin. However, it did not explain about its correlation with the drugs concentration. The aim of this study was to evaluate the relationship between the increase of serum INH and rifampicin concentrations and the increase of serum transaminase level in TB patients. This was a cross sectional study involving 31
TB patients who underwent intensive phase of treatment with ixed-dose combination antitubercuosis therapy (FDC-ATT) in Yogyakarta. Serum transaminase levels i.e. AST and ALT before and at the end of the intensive phase of treatment were determined by
an automatic chemical analyzer. Serum INH and rifampicin concentrations at the end
of the intensive phase of treatment were measured by HPLC. t- test, Mann Whitney,
Fisher and Spearman tests were used to analyze the data. Mean of INH and rifampicin
concentrations were 2.72 ± 0.46 µg/mL and 4.12 ± 0.42 µg/mL, respectively. Mean of INH and rifampicin concentrations of TB patients with high AST level (5.03 ± 4.14 µg/mL and 8.52 ± 3.06 µg/mL) tended to be higher than those with normal AST level (2.47 ± 0.27 µg/mL and 3.64 ± 0.32 µg/mL). However, they were not signiicantly
difference (p>0.05). Furthermore, mean of INH and rifampicin concentrations of TB
patients with high ALT level (7.07 ± 6.24 µg/mL and 10.67 ± 3.76 µg/mL) also tended to be higher than those with normal AST level (2.42 ± 0.26 µg/mL and 3.66 ± 0.30 µg/mL). However, they were not also signiicantly difference (p>0.05). In conclusion,
there are no correlation between INH and rifampicin concentrations and the increase of transaminase level in TB patients after intensive phase of treatment.
ABSTRAK
menunjukkan kenaika transaminase serum pasien TB disebabkan INH dan rifampisin. Namun demikian tidak dijelaskan hubungannya dengan kadar obat dalam tubuh. Tujuan penelitian ini adalah untuk mengkaji hubungan antaran kenaikan kadar INH dan rifampicin serum dengan kenaikan transaminase pada pasien TB. Penelitian ini merupakan penelitian potong lintang yang melibatkan 31 penderita TB yang menjalani pengobatan fase intensif dengan obat antituberkulosis kombinasis dosis tetap di Yogyakarta. Kadar transaminase serum yaitu SGPT dan SGOT sebelum dan setelah pengobatan fase intensif diukur
automatic chemical analyzer. Kadar INH dan rifampicin serum pada akhir pengobatan fase
intensif diukur dengan HPLC. Uji t, Mann-Whitney, Fiher dan Spearman digunakan dalam analisis data. Rerata kadar INH dan rifampisisin beturut-turut adalah 2,72 ± 0,46 µg/ mL dan 4,12 ± 0,42 µg/mL. Rerata kadar INH dan rifampisin serum pasien TB dengan kadar SGPT tinggi (5,03 ± 4,14 µg/mL dan 8,52 ± 3,06 µg/mL) cenderung lebih tinggi dibandingkan pasien dengan SGPT rendah (2,47 ± 0,27 µg/mL dan 3,64 ± 0,32 µg/mL). Namun demikian perbedaan ini tidak bermakna secara signiikan (p>0,05). Demikian juga
rerata kadar INH dan rifampisin serum pasien TB dengan kadar SGOT tinggi (7,07 ± 6,24
µg/mL dan 10,67 ± 3,76 µg/mL) cenderung lebih tinggi dibandingkan pasien dengan SGOT rendah (2,42 ± 0,26 µg/mL dan 3,66 ± 0,30 µg/mL). Namun demikian perbedaan ini juga tidak bermakna secara signiikan (p>0,05). Dapat disimpulkan tidak terdapat
ubungan antara kadar INH dan rifampisin serum dengan kenaikan kadar transaminase pada pasien TB setelah pengobatan fase intensif.
Keywords : serum transaminase – isoniazid – rifampisin - ixed dose combination –
hepatotoxics
INTRODUCTION
Tuberculosis (TB) remains a major health problem in the world including in Indonesia. In 2007, an estimated 9.27 million new cases of tuberculosis in the world was reported with the incidence was approximately 140 cases per 100,000 population. This incidence increased from the previous report of 9.24 million new cases in 2006 and 8.3 million new cases in 2000.1 Indonesia is the third highest
number of TB cases in the world after India and China. It is estimated that the number of TB patients in Indonesia around 10% of the total number of TB patients in world.2
According to the World Health Organization (WHO) the number of TB cases in Indonesia around 566,000 or 244/100,000/year, with the death cases reached 91,000 person/year.3
Rifampicin, isoniazid (INH), pyrazina-mide, ethambutol and streptomycin are the
irst-line drugs for TB. They are available in the form of a package of ixed-dose
combinations (FDCs) consisting of a combination of 2 or4 drrugs in one tablets.2
The advantages of the FDC antituberculosis therapy (FDC-ATT) include better patient
compliance, simpliication of prescription,
easier management of drug supply, reduced cost and less chances of developing drug resistance, whereas the disadvantages include priscribing errors, development of side effects, trust excessive of the treatment observer and decrease of rifampicin bioavailability.3-5
Drug-induced hepatotoxicity caused by isoniazid (INH), rifampicin, and pyrazinamide is commonly observed in patients receiving antituberculosis treatment.6 In clinical
practice, hepatotoxicity is characterized by the increase of serum transaminase levels more than three times the upper limit of normal, accompanied by symptoms such as anorexia, nausea, vomiting or abdominal pain or those
more than ive times the normal limit without
Rifampicin is well known as a potent cytochrome P450 (CYP) inducer. It has been known to markedly decrease serum concentrations of various drugs, which are concomitantly administered treatment.8
Administration of rifampicin along with INH in FDC-ATT may increase serum concentration of toxic metabolite of INH such as mono acetylhydrazine lead to increase hepatotoxicity.9-11 This study was conduted
to evaluate the association between serum concentrations of INH and rifampicin and serum transaminase in tuberculosis patients
treated with ixed-dose comibinations
antituberculosis in Yogyakarta.
SUBJECTS AND METHODS
Subjects
This cross sectional study was performed from August 2009 to January 2010 in Yogyakarta. The pulmonary tuberculosis patients who underwent the intensive phase of tuberculosis treatment in the Community Health Care and Center for Pulmonary Disease Treatment (BP4) in Yogyakarta were selected. The inclusion criteria were smear positive pulmonary tuberculosis, aged more than 18 years, had never received antituberrculosis drugs, currently received FDC-ATT category 1 and willing to participate in the study by signing a written informed consent. The exclusion criteria were had diabetes mellitus, disturbed liver function, could ot well communicate and not willingness to follow the tuberculosis treatment program with DOTS (direct observed treatment, short course). The protocol of this study has been approved by the Medical Health Research Ethics Committee, Faculty of Medicine, Universitas Gadjah Mada, Yogyakarta.
Procedure
On the day that had been agreed, patients were gathered to be selected. An explanation
concerning the background, objectives, beneit of the study was given. Patients who fulilled
the criteria were given an informed consent to be signed. Demographics data of patients include name, age, gender, weight, height and body mass index (BMI) were then recorded. Data of medical history, physical examination and nutritional status were obtained from medical records or questionnaires. Before the intensive phase of treatment initiated (day 0), the blood sample were taken from the median cubital vein of patients and serum transaminase levels i.e. aspartate aminotransferase (AST/ GOT) and alanin aminotransferse (ALT/GPT) were determined. During the intensive of treatment, patient’s clinical symtomps include nausea, vomiting and jaundice were monitored and recorded. In case of jaundice observed during the intensive of treatment, serum transaminase of the patients was determined. At the end of the intensive of treatment (day 56), the blood sample were taken again and serum transaminase, INH as well as rifampicin levels were determined. The serum INH and rifampicin levels were determined by using high-performance liquid chromatography (HPLC) method in the Integrated Research and Testing Laboratory, Universitas Gadjah Mada, Yogyakarta.
Statistical analysis
RESULTS
Characteristics of subjects
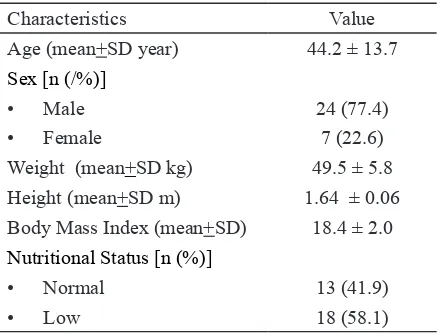
Thirty one pulmonary tuberculosis patients who meet the inclusion and exclusion creteria were enrolled in this study. The characteristics of paients were presented in TABLE 1. The aged of subjects varied from 21 to 71 years with the mean of 44.2 ± 13.7 years. In addition, based on the nutritional status the majority of subjects were under weight (58.1%) with the mean of BMI vaue was 18.4 ± 2.0.
TABLE 1. Characteristics of subjects (n=31)
Characteristics Value
Age (mean+SD year) 44.2 ± 13.7
Sex [n (/%)]
• Male 24 (77.4)
• Female 7 (22.6)
Weight (mean+SD kg) 49.5 ± 5.8 Height (mean+SD m) 1.64 ± 0.06 Body Mass Index (mean+SD) 18.4 ± 2.0
Nutritional Status [n (%)]
• Normal 13 (41.9)
• Low 18 (58.1)
Serum INH, rifampicin, AST and ALT levels
The serum INH level of subjects after intensive phase of treatment (day 56) wide varied from 0.53 to 13.32 µg/mL with the average of 2.72 ± 0.46 µg/mL, while those serum rifampicin level also wide varied from 0.49 to 14.43 µg/mL with the average of 4.12 ± 0.42 µg/mL. Serum AST level after intensive phase of treatment showed that 3 (9.6%) subjects had high serum AST level
(˃37 mg/dL) whereas most of subjects had
normal serum AST level (15-37 mg/dL). Furthermore, serum ALT level after intensive of treatment showed that 2 (6.5%) subjets had high serum ALT level (>40 mg/dL), whereas most of subjects had normal serum ALT level (5-40 mg/dL).
Gender, nutritional status, age and dose in relations to AST and ALT levels
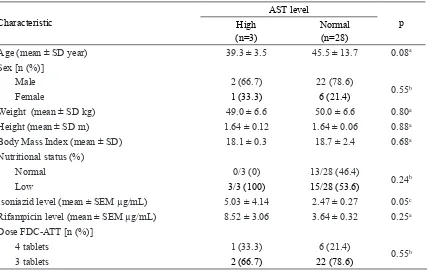
Based on the AST level showed that most of subjects were male (24 subjects or 77.4%), only 7 (22.6%) subjects were female (TABLE 1). Subjects with high AST level were dominated by male (2 subjects or 66.7%) and only 1 subject or 33.3% was female. Similarly result was observed in the subjects with normal AST levels. Twenty two or 78.6% subjects were male and only 6 or 21.4% were female (TABLE 2).
Although the serum INH level in subjects with high AST level (5.03 ± 4.14 µg/mL) was two time higher than it in subjects with normal AST level (2.47 ± 0.27 µg/mL). However,
it was not signiicantly different (p = 0.05).
Similarly result was observed in the serum rifampicin level. The serum rifampicin level in subjects with high AST level (8.52 ± 3.06 µg/mL) was also higher than it in subjects with normal AST level (3.64 ± 0.32 µg/mL).
However, it was not signiicantly different (p
= 0.25) (TABLE 2).
TABLE 2. Characteristics of subjects based on AST (n=31)
Characteristic
AST level
p High
(n=3)
Normal (n=28)
Age (mean ± SD year) 39.3 ± 3.5 45.5 ± 13.7 0.08a
Sex [n (%)]
• Male 2 (66.7) 22 (78.6)
0.55b
• Female 1 (33.3) 6 (21.4)
Weight (mean ± SD kg) 49.0 ± 6.6 50.0 ± 6.6 0.80a
Height (mean ± SD m) 1.64 ± 0.12 1.64 ± 0.06 0.88a
Body Mass Index (mean ± SD) 18.1 ± 0.3 18.7 ± 2.4 0.68a
Nutritional status (%)
• Normal 0/3 (0) 13/28 (46.4)
0.24b
• Low 3/3 (100) 15/28 (53.6)
Isoniazid level (mean ± SEM µg/mL) 5.03 ± 4.14 2.47 ± 0.27 0.05c
Rifampicin level (mean ± SEM µg/mL) 8.52 ± 3.06 3.64 ± 0.32 0.25a
Dose FDC-ATT [n (%)]
• 4 tablets 1 (33.3) 6 (21.4)
0.55b
• 3 tablets 2 (66.7) 22 (78.6)
aIndependent t-test; bFisher’s exact test; cMann-Whitney U test
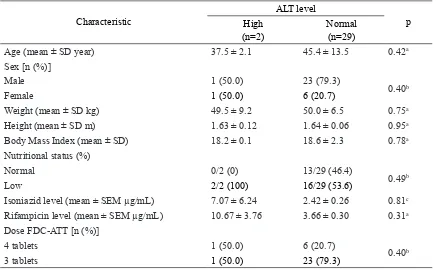
Based on ALT level showed that most of subjects were also male (24 subjects or 77.4%), only 7 (22.6%) subjects were female (TABLE 1). Subjects with high ALT level were similar between male and female, whereas subjects with normal ALT level were dominated by male 23 (79.3%) and only 6 or 20.7% subjects were female.
Similar result was observed between serum INH and rifampicin levels in relation with AST level and with ALT level. Although the serum INH level in subjects with high ALT level (7.07 ± 6.24 µg/mL) was almost three time higher than it in subjects with normal ALT level (2.42 ± 0.26 µg/mL). However,
it was not signiicantly different (p = 0.05).
Similarly result was observed in the serum rifampicin level. The serum rifampicin level in subjects with high ALT level (10.67 ± 3.76 µg/mL) was also higher than it in subjects with normal ALT level (3.66 ± 0.30 µg/mL).
However, it was not signiicantly different (p
= 0.25) (TABLE 3).
TABLE 3. Characteristics of subjects based on ALT (n=31)
Characteristic
ALT level
p High
(n=2)
Normal (n=29)
Age (mean ± SD year) 37.5 ± 2.1 45.4 ± 13.5 0.42a
Sex [n (%)]
Male 1 (50.0) 23 (79.3)
0.40b
Female 1 (50.0) 6 (20.7)
Weight (mean ± SD kg) 49.5 ± 9.2 50.0 ± 6.5 0.75a
Height (mean ± SD m) 1.63 ± 0.12 1.64 ± 0.06 0.95a
Body Mass Index (mean ± SD) 18.2 ± 0.1 18.6 ± 2.3 0.78a
Nutritional status (%)
Normal 0/2 (0) 13/29 (46.4)
0.49b
Low 2/2 (100) 16/29 (53.6)
Isoniazid level (mean ± SEM µg/mL) 7.07 ± 6.24 2.42 ± 0.26 0.81c
Rifampicin level (mean ± SEM µg/mL) 10.67 ± 3.76 3.66 ± 0.30 0.31a
Dose FDC-ATT [n (%)]
4 tablets 1 (50.0) 6 (20.7)
0.40b
3 tablets 1 (50.0) 23 (79.3)
aIndependent t-test; bFisher’s exact test; cMann-Whitney U test
Correlation beween isoniazid and rifam-picin levels and AST and ALT levels
No signiicant correlation between the
serum INH and rifampicin levels, dose of
FDC-ATT as well as nutritional status and the difference in the ALT and AST levels were observed in thi study (TABLE 4).
TABLE 4. Correlation between isoniazid, rifampicin levels, dose of FDC-ATT and nutritional status with ALT and AST levels
Characteristic difference AST p value difference ALT p value
Isoniazid level 0.431 0.782
Rifampicin level 0.529 0.890
Dose of FDC-ATT 0.329 0.820
Nutritional status 0.135 0.800
Analysis with Spearman test
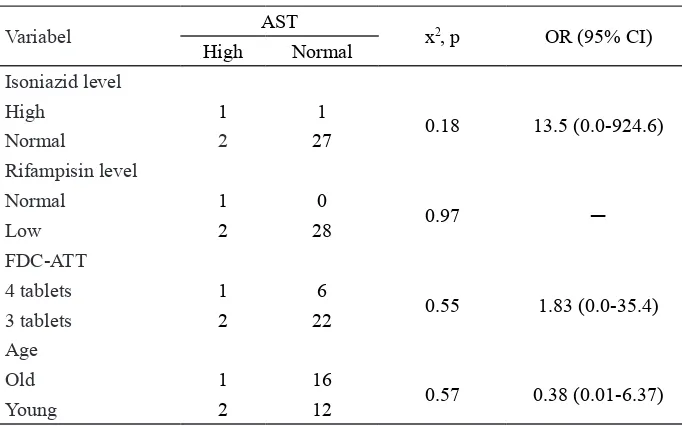
To evaluate the inluence of the INH and
rifampicin levels, dose of FDC-ATT and age on the serum AST level, the Fisher’s exact test was performed (TABLE 5). Subjects with
high serum INH level (≥ 5 µg/mL) had risk
of high serum AST level 13.5 greater than those with low serum INH level (< 5 µg/mL).
However, it was not statistically signiicant
TABLE 5. Inluence of serum INH and rifampicin levels, dose of FDC-ATT as well as
age on the risk of increase in serum AST level
Variabel AST x2, p OR (95% CI)
High Normal
Isoniazid level
High 1 1
0.18 13.5 (0.0-924.6)
Normal 2 27
Rifampisin level
Normal 1 0
0.97 ─
Low 2 28
FDC-ATT
4 tablets 1 6
0.55 1.83 (0.0-35.4)
3 tablets 2 22
Age
Old 1 16
0.57 0.38 (0.01-6.37)
Young 2 12
Analysis with Fisher’s Exact Test
Furthermore, the risk of developing high serum AST levels in subjects with dose of 4 tablets FDC-ATT was 1.83 times greater than those with dose of 3 tablets FDC-ATT.
However, it was not also statistically signiicant
(OR = 1.83; 95 % CI: 0.0-35.4). Age had no effect on the increase in serum AST level (OR = 0.38; 95% CI: 0.01 to 6.37).
To evaluate the inluence of the INH and
rifampicin levels, dose of FDC-ATT and age on the serum ALT level, the Fisher’s exact test was performed (TABLE 5). Subjects with
high serum INH level (≥ 5 µg/mL) had risk
of high serum AST level 28.0 greater than those with low serum INH level (< 5 µg/mL).
However, it was not statistically signiicant
(OR=28.0;95% CI: 0.0-6844.55).
TABLE 6. Inluence of serum INH and rifampicin levels, dose of FDC-ATT as well as age
on the risk of increase in serum ALT level
Variabel ALT x2, p OR (95% CI)
High Normal
Isoniazid level
High 1 1
0.13 28.0 (0.0-6844.55)
Normal 2 28
Rifampisin level
Normal 1 0
0.65 ─
Low 1 29
FDC-ATT
4 tablets 1 6
0.55 3.83 (0.0-171.00)
3 tablets 2 22
Furthermore, the risk of developing high serum ALT levels in subjects with dose of 4 tablets FDC-ATT was 3.83 times greater than those with dose of 3 tablets FDC-ATT. However, it was not also statistically
signiicant (OR = 3.83; 95 % CI: 0.0-171.00).
Characteristics of subjects who have extreme data
One of the subjects in this study had the highest serum drugs level compared to other subjects. Serum INH and rifampicin levels of this subject were 13.32 µg/mL and 14.43 µg/mL, respectively. Characteristics of this
subject was a man with 39 years old, 55 kg body weight and low nutritional status (BMI of 17.9). He received 4 tablets FDC-ATT containing INH 300 mg and rifampicin 600 mg daily during the intensive phase of treatment. The serum AST and ALT levels of this subject before the intensive of treatment were normal. However, this serum AST and ALT levels
increased ive time at the end of the intensive
of treatment, whereas his serum urea level (13 mg/dL) and serum creatinine level (0.96 mg/dL) were normal. This subject underwent intensive phase compliance of treatment, therefore he underwent continuos phase of treatment with drug-induced hepatotoxicity monitoring.
DISCUSSION
Effect of serum INH concentration on serum transaminase
The mean serum INH concentration two hours after FDC-ATT on 31 subjects was 2.72 ± 0.46 µg/mL varied from 0.53 to 13.32 µg/mL with the median of 2.21 µg/ mL. McIlleron et al.12 reported that two hours
after INH ingestion the median serum INH concentration was 5.0 µg/mL with the lowest concentration was 0.4 µg/mL and the highest
concentration was 13.6 µg/mL. Although the median of serum INH concentration in this study was different compare to that reported McIlleron et al.,12 however the range of serum
INH concentration was similar.
The mean serum INH concentration of subjects with high ALT level was almost three time higher than it in subjects with normal
ALT level although it was not signiicantly
different. The increase of ALT level until
ive times of normal was found in one (3.3%)
subjectin this study. The increase of ALT level of patients who underwent tuberculosis treatment was reported in previou studies.
An increase of ALT level until ive times on
0.56% of tuberculosis patients who treated with single dose of INH was reported.13
An another study also reported an increase of serum transaminases until three times of normal on 0.3% of laten tuberculosis patients after treatment.14
Previous studies reported that INH hepatotoxicity was associated with the patient acetylator status in the N-acetyltransfrase 2 (NAT2) genotype.15-18 Slow acetylator
status was a signiicant risk factor for
drug-induced liver injury (DILI) in TB patients.19-22
Isoniazid is metabolized to acetylisoniazid by NAT, which is then hydrolyzed to acetylhydazine. Acetylhydrazine can be transformed into diacetylhydrazine by acetylation process and oxidized by CY2E1 to form hepatotoxic metabolites. Low NAT activity in slow acetylator status will increase the risk of hepatotoxicity due to the majority acetylhydrazine is oxidized.23
Effect of serum rifampicin concentation on serum transaminase
was relatively low therefore it did not inluence
serum transaminase of the patients. Van Crevel et al.24 reported that serum rifampicin
concentration two hours after ingestion can be categorized into subtherapeutic levels (<4
µg/mL), low concentration (4-8 µg/mL),
therapeutic levels (8- 20 µg/mL), and toxic
levels (> 20 µg/mL). Furthermore, it was
also reported that 70% of the TB patients had subtherapeutic rifampicin concentrations (<4
µg/mL) and no toxic rifampicin concentration
in serum was observed.24 Another study
reported 64% of TB patients had plasma rifampicin concentration less than 8 µg/mL after rifampicin treatment.25 In this study, 55%
of the TB patients had subtherapeutic, 40% of those had low therapeutic and only 3% of those had therapeutic level. The different
in drug preparation may inluence the serum
rifampicin of TB patients. In this study rifampicin were given in FDC-ATT.
The mean serum rifampicin concentration of subjects with high ALT level was also almost three time higher than it in subjects with normal ALT level although it was not
signiicantly different. It was indicated that
serum rifampicin level did not affect the increase in serum transaminase. Previous studies conducted on TB patients showed the increase of serum transaminase level was not associated with the serum rifampicin level.26,27
Effect of age, gender and nutritional status on serum transaminases
No association between age and serum transaminase level was observed in this study. The serum transaminase level of the younger
TB patients (18-40 years) was not signiicantly
different compare to those older patients (>40 years). Previous studies also showed that the age was not associated with the incidience of hepatotoxicity.6,28,29 Conversely, Mahmood
et al.30 reported that serum transaminase
increased in older TB patient (>35 years). Gender was not also associated with the increase of serum transaminase in this study. The serum transaminase level of male
TB patients was not signiicantly different
compare to female TB patients. However, previous studies reported that the increase of serum transaminase was more frequent in female TB patients.30,31 Similar with this
study, the nutritional status was reported not associated with the serum transaminase.17,30,31
AKNOWLEDGEMENTS
The authors would like to thank all patients who participated in this study. This study could be conducted after supported by directos of the Community Health Care and Center for Pulmonary Disease Treatment (BP4) in Yogyakarta
CONCLUSION
In conclusion, the increase of serum transaminase is not associated with serum INH and rifampicin levels in pulmonary tuberculosis patients receiving FDC-ATT.
REFERENCES
1. World Health Organization. Global tuberculosis control 2007: epidemiology, strategy, inancing. Geneva: World Health Organization, 2009. 2. Departemen Kesehatan RI. Pedoman nasional
penanggulangan tuberkulosis. Jakarta : Departemen Kesehatan RI, 2007.
3. World Health Organization. Tuberculosis care and control in refugee and displaced population: an interagency ield mannual, 2ed. Geneva: World Health Organization, 2007. 4. Bangalore S, Kamalakkannan G, Parkar
http://dx.doi.org/10.1016/j.amjmed.2006. 08.033
5. Blomberg B, Spinaci S, Fourie B, Laing R. The rationale for recommending ixed-dose combination tablets for treatment of tuberculosis. Bull WHO 2001; 79: 61-8. 6. Anand AC, Seth AK, Paul M, Puri P.
Risk factor of hepatotoxicity during anti-tuberculosis treatment. MJAF 2006; 1(62):45-9.
http://dx.doi.org/10.1016/s0377-1237(06) 80155-3
7. Yee D, Valiquette C, Pelletier M, Wongnawa M, Sunbhanich M. Incidence of serious side effects from irst-line antituberculosis drugs among patients treated for active tuberculosis. Am J Respir Crit Care Med 2003; 167:1472-7.
https://doi.org/10.1164/rccm.200206-626OC 8. Mahatthanatraku W, Nontaput T, Ridtitid W,
Wongnawa M, Sunbhanich M. Rifampin, a cytochrome P450 3A inducer, decreases plasma concentrations of antipsychotic
risperidone in healthy volunteers. J Clin
Pharm Ther 2007; 32(2):161-7.
h t t p : / / d x . d o i . o r g / 1 0 . 1 1 1 1 / j . 1 3 6 5 -2710.2007.00811.x
9. Roy B, Chowdhury A, Kundu S, Santra A, Dey B, Chakraborty M. Increased risk of antituberculosis drug-induced hepatotoxicity in individuals with glutathione S-transferase M1’null’ mutation. J Gastroenterol Hepatol 2001; 16: 1033-7.
h t t p : / / d x . d o i . o r g / 1 0 . 1 0 4 6 / j . 1 4 4 0 -1746.2001.02585.x
10. Steele MA, Burk RF, DesPrez RM. Toxic hepatitis with isoniazid and rifampin. A meta-analyses. Chest 1991; 99:465-71. http:// dx.doi.org/10.1378/chest.99.2.465
11. Bass NM, Drug-induced liver disease. In: Friedman SL, McQuaid KR, Grendell JH. (eds) Diagnosis and Treatment in Gastroenterology,
2nd ed. Singapore: McGraw-Hill Companies
Inc, 2003.
12. McLlleron H, Wash P, Burger A, Norman J, Folb PI, Smith P. Determinants of rifampin, isoniazid, pyrazinamide, and ethambutol pharmacokinetics in a cohort of tuberculosis patients. Antimicrob Agents Chemother 2006; 50(4):1170-7. http://dx.doi.org/10.1128/ AAC.50.4.1170-1177.2006
13. LoBue PA, Moser KS. Isoniazid- and rifampin-resistant tuberculosis in San Diego County, California, United States, 1993– 2002. Int J Tuberc Lung Dis 2005; 9:501–6. 14. Fountain FF, Tolley E, Chrisman CR, Self
TH. Isoniazid hepatotoxicity associated with treatment of latent tuberculosis infection: a 7-year evaluation from a public health tuberculosis clinic. Chest 2005; 128:116–23. http://dx.doi.org/10.1378/chest.128.1.116 15. Gronhagen, Riska C, Hellstrom PE, Froseth
B. Predisposing factors in hepatitis induced by isoniazid-rifampin treatment of tuberculosis. Am Rev Respir Dis 1978; 118:461–6.
16. Dickinson D, Bailey W, Hirschowitz B. The effect of acetylation status on isoniazid (INH) hepatitis. Am Rev Respir Dis 1977; 115:395. 17. Hwang SJ, Wu JC, Lee CN, Yen FS, Lu CL,
Lin TP, Lee SD. Aprospective clinicalstudy of isoniazid-rifampicin-pyrazinamideinduced liver injury in an area endemic for hepatitis B. J Gastroenterol Hepatol 1997; 12:87–91. http://dx.doi.org/10.1111/j.1440-1746.1997.
tb00353.x
18. Parthasarathy R, Sarma GR, Janardhanam B, Ramachandran P, Santha T, Sivasubramanian S, Somasundaram PR, Tripathy SP. Hepatic toxicity in South Indian patients during treatment of tuberculosis with short-course regimens containing isoniazid, rifampicin and pyrazinamide. Tubercle 1986; 67:99–108.
http://dx.doi.org/10.1016/0041-3879(86) 90003-6
hepatitis by molecular biology test. Tuberk ve tor derg 2008; 56(1):81-6.
20. Fukino K, Sasaki Y, Hirai S, Nakamura T, Hashimoto M, Yamagishi F, Ueno, K. Effects of N-acetyltransferase 2 (NAT2), CYP2E1 and glutathione-S-tranferase (GST) genotypes on the serum concentrations of isoniazid and metabolites in tuberculosis patients. J Toxicol Sci 2008; 33(2):187-96. http://dx.doi.org/10.2131/jts.33.187
21. Huang YS, Chern HD, Su WJ. Polymorphism of the NAT2 gene as a susceptibility risk factor for antituberculosis drug induced hepatitis. Hepatol 2002; 3:883-9.
https://doi.org/10.1053/jhep.2002.32102 22. Anggraini DI. Pengaruh status asetilator
terhadap kadar isoniazid dalam serum dan konversi sputum pada pengobatan tahap intensif penderita tuberculosis paru dewasa di Yogyakarta [Tesis]. Yogyakarta: Universitas Gadjah Mada; 2010.
23. Huang YS, Chern HD, Su WJ, Wu JC, Lai
SL, Yang SY, et al. Polymorphism of the
N-acetyltransferase 2 gene as a susceptibility risk factor for anti- tuberculosis drug-induced hepatitis, Hepatology 2002; 35(4): 883–9. http://dx.doi.org/10.1053/jhep.2002.32102 24. van Crevel R, Alisjahbana B, de Lange WC,
Borst F, Danusantoso H, van der Meer JW, et
al. Low plasma concentrations of rifampicin
in tuberculosis patients in Indonesia. Int J Tuberc Lung Dis 2002; 6(6):497-502.
25. Kimerling ME, Phillips P, Patterson P, Hall M, Robinson A, Dunlap NE. Low serum antimycobacterial drug levels in non-HIV-infected tuberculosis patients. Chest 1998;
113:1178-83. http://dx.doi.org/10.1378/chest. 113.5.1178
26. Anonim. A double-blind placebo-controlled clinical trial of three antituberculosis chemoprophylaxis regimens in patients with silicosis in Hong Kong. Hong Kong Chest Service/Tuberculosis Research Centre, Madras/British Medical Research Council. Am Rev Respir Dis 1992; 145(1):36-41. http://dx.doi.org/10.1164/ajrccm/145.1.36 27. Menzies D, Dion MJ, Rabinovitch B, Mannix
S, Brassard P,Schwartzman K. Treatment completion and costs of a randomized trial of rifampin for 4 months versus isoniazid for 9 months. Am J Respir Crit Care Med 2004; 170:445–9.
https://doi.org/10.1164/rccm.200404-478OC 28. Prihatni D, Parwati I, Sjahid I, Rita C. Efek
hepatotoksik anti tuberkulosis terhadap kadar aspartate aminotranferase an alanine aminotransferase serum penderita tuberkulosis paru. Ind J Clin Patol Med Lab 2005; 12(1):1-5.
29. Rusmawati. Gizi kurang sebagai faktor risiko drug induced karena obat antituberkulosis [Tesis]. Yogyakarta: Universitas Gadjah Mada; 2006.
30. Mahmood K, Hussain A, Jairaman KL, Talib A, Abbasi B, Salkeen S. Hepatotoxicity with antituberculosis drugs: the risk factors. Pak J Med Sci 2006; 23(1):33-8.